
Enhancing Digital Travel Experiences: A Performance Case Study of
Key Websites in India
Nitin Reddy, Peddi Gowtham Balaji, Chamikar P, Yenuganti Omkar Chowdary and Radha D
Department of Computer Science and Engineering, Amrita School of Computing,
Bengaluru, Amrita Vishwa Vidyapeetham, India
Keywords: Performance Optimization Tools, Page Load Speed and Efficiency, Core Web Vitals Insights, Actionable
Improvement Suggestions, Global Testing Capabilities, Mobile Responsiveness Focus.
Abstract: Website speed and efficiency play important roles for delivering excellent users experience especially in high
traffic Website 3 and Website 4 whereby users interaction, conversion rates, and their perceived attitude
towards a Website is influenced by the availability and speed of the Website. This work then performs an
assessment of the said travel websites to identify how well they are performing through key performance
indicators including FCP, LCP, TTI, TBT, CLS and TTFB. Using site analytics tools including but not limited
to Google Lighthouse, Google PageSpeed Insights and GTmetrix, this research aims at gauging performance
across the two platforms, the areas of strength as well as the opportunities for enhancements. The findings
offer practical knowledge about how such platforms operate in practice, and may reveal specific impediments
to rapid operating velocity, active user participation, and visual constancy. On this basis, this study provides
specific recommendations for improvement in loading time, blocking scripts, layout stability, and overall
usability at desktop and mobile web platforms.
1 INTRODUCTION
Website performance is one of today’s essential
components that either positively or negatively
influences user experiences concerning various web-
based interfaces, including travel plat- forms such as
Website 3 and Website 4, Website 5, Website 2,
Website 1, Website 6. Used by millions of users to
book hotels, airlines, and vacation packages slight
delays will lead to abandonment, and negative
perception towards the brand or company. This work
presents an analysis of Website 3 and Website 4 with
an emphasis on time to first byte, page speed,
interactivity, and reliability. Our goal, therefore, is
to establish a benchmark for these sites based on the
findings of analyses using sophisticated tools such as
Google Lighthouse, PageSpeed
Insights, and GTmetrix to determine what
strengths these sites have and what weaknesses should
be leveraged or fixed to capture user attention and
encourage interaction.
The market features increased competition from
players in the travel and booking platforms domain,
with users implying high standards from
performance, load speed, and relevancy within search
results. These are the specific questions that this study
aims to answer: What specific measures define
Website 3’s and Airbnb’s KPI, and what do Website
4 KPI include? We aim to provide insights into their
SEO strategies, traffic patterns, and performance
efficiency, which are crucial for maintaining market
share and user satisfaction.The rest of the paper is
structured as follows: Section II is the Literature
Review, Section III is the Experiments, Section IV is
the Analysis, and the final section is Conclusion
Future Work.
2 RELATED WORK
Kumar et al. (Kumar, Kumar, et al. 2021). emphasize
the vulnerability of websites and stress the idea of
monitoring and analyzing the performance of Web
sites with respect to accessibility, usability and
security. Some of the tools used for audits include the
SEOptimer and the Qualidator and these give
important changes that need to be made for the user
to have a better experience as well as pointing out the
Reddy, N., Gowtham Balaji, P., P, C., Chowdary, Y. O. and D, R.
Enhancing Digital Travel Experiences: A Performance Case Study of Key Websites in India.
DOI: 10.5220/0013593000004664
Paper published under CC license (CC BY-NC-ND 4.0)
In Proceedings of the 3rd International Conference on Futuristic Technology (INCOFT 2025) - Volume 2, pages 389-397
ISBN: 978-989-758-763-4
Proceedings Copyright © 2025 by SCITEPRESS – Science and Technology Publications, Lda.
389

strengths in security. For this reason their studies
demonstrate the importance of such tools to identify
and prevent the issues that might interfere with the
user interaction or draw attention to the existing
security threats. According to the study, performance
check is suggested as best practice that can be adopted
in the ever growing technological environment for
constant evaluation of quality and safety of the
website.
The work focus on the effect of web analytics on
SMEs in the kingdom of Saudi Arabia especially in e-
commerce business.
(Pradana, and Suprayogi, 2021). The study
focused in the quan- titative characteristics of the
internet and/web data part within the managerial
perception of the SMEs that employ tools such as the
GA to evaluate their performance. Through
interviews with eight Saudi SMEs, the authors
identified four key themes: the types of the web
analytics tools, which are required for the
organizations, the factors, that make organizations
start using web analytics tools, and the impacts, which
the tools have on financial and non-financial
performances and the decision making process. The
study found that the utilization of these tools was
useful in the enhancement of performance of SMEs
and to SMEs, they assisted in decision making by
providing direction in form of KPIs. This study
emphasizes on the importance of adopting WAM to
boost the business performance of SME and
advocates for a better understanding of KPI by policy
makers. However, the study also has its limitations;
the number of participants is limited and the study
focuses only on particular kind of industries;
therefore, the researchers should use a larger and
more heterogeneous population and geographic area.
The author aims at optimizing the SFV website
(Panduwika, and Solehatin, 2024) which consists of
applying Google PageSpeed Insight optimization
techniques. This optimization comprised of down-
scaling images by 30per and converting them to webp
format with respect to the image quality and
determine the increase in the website loading speed.
This improvements increased the PageSpeed score
from 47 to 63 and proved that such optimizations are
effective. From social experiment conducted among
twenty users it was revealed that 82 per cent users
were satisfied with the improvement in features of
website such as speed, image, etc. Therefore, it
reiterates the importance of periodic assessment of
the site and changes in factors connected with the
User Experience.
The author aims at examining the effect of
employing web analytics tool on the performance of
small and medium en- terprises SMEs in Saudi Arabia
focusing on the e-commerce segment (Almatrafi,
Alharbi, et al. 2023). In the present research, with
the data obtained from eight interviews of the
employees of SMEs, the authors interested in
identification of usage of Google Analytics, Zid
Analytics and other tools. Some of the major benefits
realised when using web analysis tools are;; improved
financial and or non-financial performance, improved
decision making, and realisation of general business
strategies. From the research, the enhancement of the
above tools improves business performance, clients’
satisfaction and organization effectiveness.
Muhammad Saad, et.al. (Saad, Zia, et al. 2022)
uses a cross-sectional survey re- search method to
evaluate usability characteristics of healthcare web
sites. The articles chosen are mostly comprised from
the year 2017 to 2021 From the identified digital
libraries like IEEE, ACM, Scopus, ScienceDirect and
other scholarly journal databases. From the initial
search, we found 10,512 papers out of which 55
papers were selected based on research questions and
quality assessment They exactly used usability
Features like identifying and emphasizing special
characteristics that affect interaction and experience
in health care websites, usability testing methodolo-
gies that were used to measure or assess gains
associated with linkage to usability related issues,
frequently encountered test challenges for users and
developers. This extended approach should provide
significant inputs which can be useful lines, and
Challenges faced by them are Qualifying common
usability issues arising from user and developer.
The paper focuses on the deem of e- government
website efficiency for which DEA as a non-
parametric method is employed (Supriya, Rathinavel,
et al. 2024). It also considers stacking for improving
its predictive performance, and the method by which
models and methods can be combined for the purpose
of achieving such a function with attention given to
the statistical, computational, and representational
thereof. As for the future research, of course, other
models of DEA, ensemble and data mining
techniques can be used to enhance the evaluation
phase of the current paper where DEA is integrated
with the DMS to evaluate Jordan’s e-Government
portals.
The author made a comparative analysis of journal
coverage among three major databases: SciVerse
Web of Science, Sco- pus, and Dimensions database
(Singh, Singh, et al. 2021). When they compared it
with the latest master journal lists they found out that
in terms of coverage it was a lot lower; Web of
Science had the smallest coverage while Dimensions
INCOFT 2025 - International Conference on Futuristic Technology
390

offered the largest and most comprehensive coverage.
Thus, 99.11per of the 58,620 total journals inside of
WoS are also inside both Scopus and Dimensions,
while records inside of Scopus are 96.42per inside of
Dimensions. The study also revealed cross-sectional
differences in article production rates and discipline
orientation for the 20 coun- tries between the years
2010- 2018. The present study suggests that the
choice of database can influence bibliometric analysis
rather substantially and also, this study opens the
possibility that Dimensions may be of particular value
as it is somewhat more comprehensive.
(Kumaladewi, Rahajeng, et al. 2023) applied
WebQual 4.0, Importance Performance Analysis
(IPA), and GTmetrix to a study of user satisfaction
and web performance. The survey was carried with
84 students and got web quality average of the
WebQual index at 81per points, which indicates the
Web site quality and Usability 79per and Information
Quality 83per and Service interaction quality 83per.
The above analysis provided by IPA identified
essential areas of concern relating to learnability or
the capability to teach or discuss the site in addition
to the ease of navigation improvement in contrast to
the performance test by GTmetrix that rendered the
site a Grade C implying rather satisfying but
somewhat improvable technical performance. In all,
the study shows that the hypothesis that website is
positively evaluated is true though there is need to
target certain areas to make user satisfied and improve
the performance of the website.
The work examines the flow dynamics of a
website from the e- business standpoint Cociorva
(Narassima, Shriram et al. 2022) using multiple
analytics tools to measure critical parameters,
including performance, accessibility, and SEO.
Analytically, this paper elucidates how a detailed
approach can be important in comprehending the
pattern of users and the efficiency of the e-commerce
business in order to fine tune strategies for improved
operational results. There is already a highly
expressiv emphasis on the systematic processing of
the issues at hand and finding keen and efficient ways
to improve the satisfaction of the users along with
raising the business yield. In his study, More
specifically, there is a use of fixation of web analytics
for managing innovative business models for
sustainable competitive advantage in digital
economy.
The author developed a web-based application for
performance testing of e-commerce site with using
the WebpageTest, Page- Speed Insight GTmetrix
performance testing tools (Dhivvya, Dath, et al.
2024). The present research deals with nine
performance parameters like Load Time, First Byte,
Total Blocking Time and the like and out of which ten
e-commerce sites of Bangladesh will be considered
for analysis. The website is built in PHP/MySQL,
CSS/HTML, thus, you can just paste the URL of a
website in order to check its speed automatically. It
was seen from this study that; WebpageTest and
GTmetrix provided more elaborative results where
site7 took the least TBT of 0.03 seconds and site10
took the most LT of 17.78 seconds. Planned
improvements for the update is making the mobile
version of the site, and improving testing.
3 EXPERIMENT
3.1 Google Lighthouse Tools
Google Lighthouse is an optimization tool from
which we use and analyze such indicators of web
page performance as FCP, LCP, SI, TTI. It highlights
issues to do with performance and provides measures
to use as far as loading time, rendering, and
CSS/Javascript are concerned. For example there are
such recommendations as lazy load or code split, it
means that, Insites, for example, estimates not only
the DOM Themes but also the adaptability of the site
to Web Standards. It also estimates the following –
how well the layout is suited for mobile devices, how
stable the layout is (CLS), correct accessibility
aspects for instance color difference, text for the
visually impaired, ARIA labels.
3.2 Page Speed Insights Tools
Overview
PSI measures the Web page load on a mobile and
desktop using the various KPI, which are FCP, SI,
LCP, TTI, and CLS. That of which invaluable that it
provides advice on how to limit superfluous JS that
loads, also servers optimised images apart from the
choice of removing resources that slow down the
rendering process as well as caching resources. Lab
data along with field data are used in this tool for
performing analysis for performance and checking for
mis configurations as well as common breaches like
WebP images and redirects. In particular, metrics that
are valuable to the user such as TTI and Total
Blocking Time (TBT) need to be optimized.
Enhancing Digital Travel Experiences: A Performance Case Study of Key Websites in India
391

3.3 GTmetrix
GTmetrix is a web-based service that evaluates
website perfor- mance for the desktop and mobile
versions of a site using Page- Speed Insights and
YSlow. Performance scores: It gives different scores
where the page loading times are perfect, and a
waterfall chart makes it easy to find out what caused
the delay such as large images or scripts. These tools
keep record of the history of the processes and trends
on them while also having the video replay which as
McCormick said shows where loading issues are. It
also expands the mobile site for testing and consumer
targeting with first priority given to the international
market. However, due to the guidance for front-end
and backend optimization tips, GTmetrix enhances
engagement with the audience, hence reducing
bounce rates and improving better responsiveness and
performance of websites to rank higher in SERP.
4 ANALYSIS
4.1 Google Lighthouse Tools
Specifically, the Lighthouse report for website 1
shows that its performance score is 65; this means that
further improvements must be made with regard to
the load speed optimization. On this aspect, the site
achieved an impressive 91, which indicates good
accessibility for users of different abilities and a
possibility of a small improvement. Improved score
for the best practices is 93 which means that their
conformity to web standards and security protocols is
good and they can and still improve a little. However,
the SEO score of 42 is very poor, emphasizing the
high potential for work on the website’s increase of
scores in rankings.
Some of the others important findings of the
report include; at first contentful paint the slow
motion has been recorded at 2.3 seconds on average
while the acceptable norm is 1.8 seconds on average.
The Largest Contentful Paint (LCP) is at 2.4 seconds,
and while it has a passing score, there exist room for
improvement. A considerable Total Blocking Time of
3,290 milliseconds is demonstrated, which shows that
scripts or processes interfere with interactivity. The
Speed Index is calculated at 2.8 seconds, and reflects
the average time to receive the first painted pixel
which is the visible part of the page, so it seems that
there is potential for increasing the speed of page
loading for the sake of convenience for the users.
However, the CLS is 0, which means there is no shift
of the page layout during loading and this is favorable
for end users.
Possible for enhancing the performance of the
whole Website 1, for example, is the decrease of TBT
through the improvement of the load speed of scripts
and resource sizes for faster interaction. Other
peculiarities of SEO that would be helpful in making
this website more noticeable include meta tags
optimization, improving the texts and ensuring their
mobile compatibility. By doing the above, it can be
easier for Website 1 to improve on the areas of
weakness so as to make it easier for the customer to
access and use the site and hence improve on the
quality of services offered.
According to the Lighthouse report for the
webpage 2, the score is 90 which dispositions it to the
high performance and good optimization and speed.
However, the accessibility score obtained at this site is
73; this merely means that every contenye is
accessible but there is still a great chance of making
this site suitable for all users especially the disabled.
The practice gap is best at 93, meaning that there is
good compliance with web standards and security
needs with little to focus on. On the flip side, the
provided SEO score is 50, which is again low and
there is good potential for increased visibility on the
search engines.
Head Measurement indicates that First Contentful
Paint achieves a value of 2.7s which is not very
welcoming since it basically shows the ability of the
website to load first time to the user. The Largest
Contentful Paint stands at 3.0s, slightly above the
threshold of 2.5s and optimal improvements exist to
maximize the UX for the customers. On the positive
side Total Blocking Time is 0 milliseconds. Excellent.
That means no blocking resources or heavy scripts
slow down the interactivity of the proposed
prototypes. The Speed Index is at 2.8 at the range of
which is tagged good performance, the CLS was 0
meaning no instances of layout shifts throughout the
loading. Hopefully it is perfect for us for a complete
transition to making user experience hassle free.
This will make the overall performance better if
Website 2 ensures the measures such as resource
loading for focusing on first content paint which deals
with loading of critical assets or optimizing the images
to impact the largest contentfull paint.
Other problems like contrast and correct alt texts for
images can be solved to allow more consumers into a
website. Meta tags should be optimized, and the page
content should be improved to raise the SEO practice.
The effect will be even more visibility on SERP. In
these aspects, Website 2 is more about further
enhancing general user involvement and satisfaction
alongside taking the lead in travel information.
INCOFT 2025 - International Conference on Futuristic Technology
392
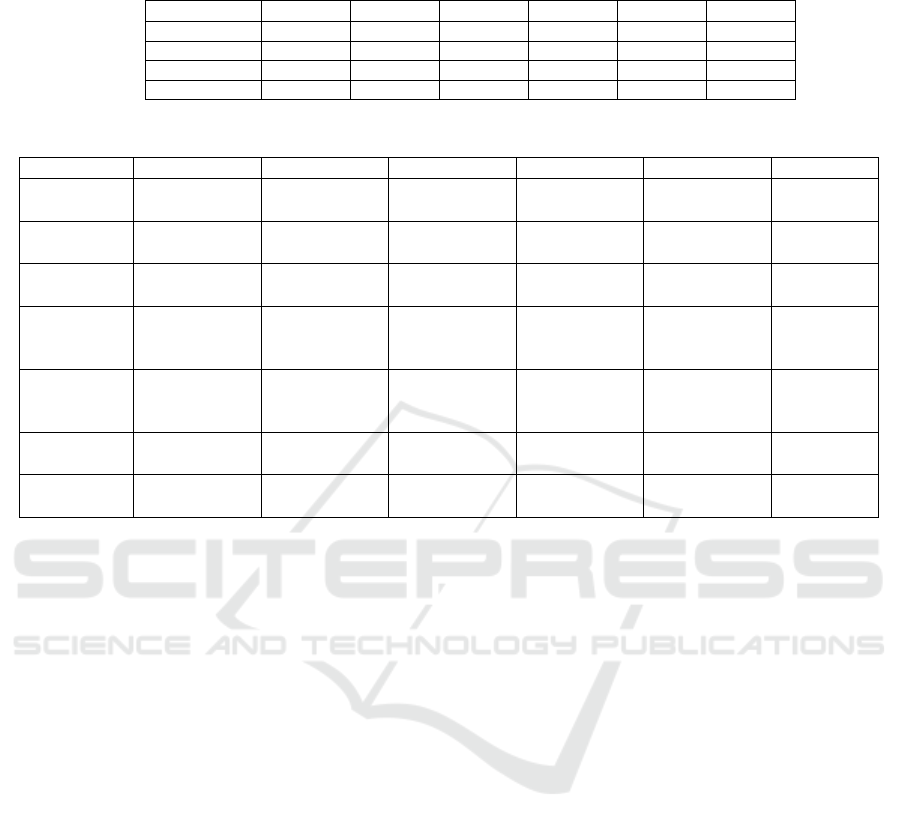
Table 1: Performance analysis of various Travel Websites
Website-1 Website-2 Website-3 Website-4 Website-5 Website-6
Performance 65 9029767162
SEO 42 50 100 50 42 50
Accessibility 91 73 92 67 90 73
Bes
t
Practices 93 93 57 96 89 100
Table 2: Performance and Structure Metrics of Various Travel Websites as Analyzed by GTmetrix
Website-1 Website-
2
Website-3 Website-
4
Website-5 Website-
6
GTmetrix
Grade
D (67%) C (78%) E (59%) A (95%) C (75%) B (86%)
Performance
Score
63% 85% 43% 97% 63% 86%
Structure
Score
74% 67% 82% 93% 92% 86%
Largest
Contentful
Paint
832 ms 1.1s 2.0s 1.2 s 1.4 s 1.1s
Total
Blocking
Time
1.6s 235ms 1.6 s 0 ms 616 ms 224ms
Cumulative
La
y
out Shift
0.01 0.02 0.09 0.03 0.01 0
Total Page
Size
7.23MB 3.81 MB 6.23 MB 1556KB 1.70 MB 2.06MB
Analyzing Website 3 using Lighthouse we come
across a score of 29 which proves this website to be
rather poor example in terms of optimization and
loading speed. By definition, this site is in the low-
performance area; that is how I became aware of this
site at this stage in the first place to work on the
improvement of its performance and usability. On the
other hand, the access score is 92 that shows the site
is almost perfect and provides good use experience
for a huge amount of users including disabled. The
score by the best practices is 57, which barely meets
the average levels of adherence to the web
development standards as well as security protocols,
indicating that much more work needs to be done in
this aspect. But at the same time, what I also like
about the site is that it comes with a perfect SEO score
at 100 best for search presence and makes the site
easily accessible to the users as-well.
In the primary performance metrics, major
problems can be seen: The first paint can take as long
as 4.6 seconds, that is slow enough and the first view
of the page can already give a prejudiced view of the
website’s speed. The Largest Contentful Paint sits at
a scary 7.1 seconds which is way high compared to
the threshold value of 2.5 seconds. It indeed needs a
faster enhancement to make the use of the website
more effective and impressive for the users. In
addition, the Total Blocking Time is 4,300
milliseconds. This shows that heavy scripts or
blocking resources are greatly affecting interactivity
and could eventually frustrate users. The interaction
time pointed by Speed Index is 9.6 seconds, therefore
overall time for loaded visible content is slower. This
hurts user experience. The CLS of the CLS on the
other hand is 0.041 meaning there are very fewer
layout shifts during the page load and therefore
supports a visually stable experience.
All the above-taken performance issues would be
eliminated if only Website 3 will dedicate its efforts
towards bringing the load time of main resources and
scripts as well as the First Contentful Paint, the
Largest Contentful Paint into perspective. Some of
the ways of enhancing the responsiveness include,
performing code splitting, image optimization, and
the loading of non critical resources without
interrupting the flow because best practices
improvement around web standards as well as
security protocols would in fact serve to enhance the
reliability of websites as a whole. It would focus on
the areas to increase number of users, to decrease
bounce rates and to enhance the customer confidence
in using the online booking, thereby making it more
efficient as well as effective in long run.
Enhancing Digital Travel Experiences: A Performance Case Study of Key Websites in India
393

That is according to the Lighthouse report of the
website 4 it has performance score of 76. Any rate,
this is a good score as far as optimization is
concerned; nevertheless, it has a very fast load speed,
so it occupies the rank of middle performance.
Therefore the accessibility score according to the
EAG is 67. This implies that the usability for persons
with impaired ability could have been enhanced;
however, there exists a significant improvement
endeavor in respect to this aspect. It came up with 96
for best practices which makes it probable for the site
to be in compliance with good modern internet
standards and security best practices. The SEO score
is at 50 meaning that there are a number of places
where search engine result has to be enhanced.
Some other key metrics show the performance of
the site: FCP is at 3.1, thus a little above the optimal
level and can be adopted in straining for increasing
the impressions of the users. Largest Contentful Paint
stands at 3.5 seconds, which is higher than the target
of 2.5 seconds and, therefore, indicate that something
needs to be done to improve this figure so that the user
experience can be optimized. On the other hand the
Total Blocking Time is as low as 280 ms which means
that the blocking of scripts and
other interactions
does not significantly affect user interactivity. A
Speed Index of 5.3 seconds means the time required
to load only visible content and hints at certain
improvements that can potentially increase the
‘happiness’ of a user. The score for the Cumulative
Layout Shift is 0.00; that indicated that there are no
disturbing shifting of formats during the loading of
the site that would cause instability and discomfort to
views. Thus, any kind of optimization in FCP and
LCP times will be beneficial for the general
performance of the system. Some drawbacks include
poor access arrangement should be enhanced and
proper optimization technique will greatly improve
both user experience and site exposure. All these
areas of improvement will not only increase the site’s
performance metric, but it would also increase the
level of satisfaction of users once on the platform.
The optimization and load speed of the
website5 stand at 71 out of 100 hence classified as;
in the medium-performance optimization and load
speed according to the Lighthouse re- port. This
website shows good accessibility, which equals to
90, therefore is an example of a very accessible
website for people with disabilities. Moreover, the
best practices score is 89Key performance metrics
provide further insights: Regarding the First
Contentful Paint (FCP), the result is good and make
users satisfied because they have to wait only 1.5
seconds. For page rendering, LCP equals to 2.5
seconds that is on the edge of the advised top mark, so
even the minor optimization increases the chances of
user satisfaction. However, the Total Blocking Time
is significantly high and causes 1,500 milliseconds;
fixing this problem is good for user interaction. The
Speed Index is high and the record achieved is 2.2,
which is a good performance loading time for the
visible parts of the website, which Benefits the user
experience.
Also, with the value of 0, the website passes all
the CLS criteria, meaning that a user will not
experience any a heavy shifting or re-flowing of the
page’s elements while loading the web page.
The enhancements to be applied to the Website 5
to raise the overall performance include decreasing
the Total Blocking Time and increasing the efficiency
of SEO optimization to raise the ranking in the search
engine. If these concerns are to be addressed, then
there are possibilities where the website can improve
on user experience and in return, the number of users
would increase giving out maximum user satisfaction
hence improving on repeat use.
The performance report of the website 6 done by
the Light- house report has indicated a poor
performance by giving the result of 31 meaning its
slow to load and poorly optimized. The implication
of such a score is that there is a lot that needs to
be done to optimize for faster page loading speed
experience from the users’ perspective. The total and
maximum possible accessibility score should be
around 85 and which when broken down should be at
medium because the general accessibility of the site
is fairly good but there are areas of considerable need
for improvements in order to provide for non-disabled
user’s better services. Using best practice matrices,
the score stands at 64 which is technically below the
average and pointing towards a list of problems with
web standards, security, and development practices
for enhancements. However, the SEO score is quite
moderate with the website securing an average score
of 78 before it can be exposed more to several
search engines. The most important metrics raise
concern; the FCP is rated at 3.9 seconds which is slow
and can be improved by reducing image size,
optimizing servers etc. Largest Contentful Paint
(LCP) is worse with taking 5.5 seconds to load while
the threshold should have been a mere 2.5 seconds –
twice as worse impacts the overall user experience.
The Total Blocking Time is also equal to 1,500 ms,
and, again, it is critical; decreasing the above-
mentioned heavy scripts and increasing the third-
party resources would make the site faster. The Speed
Index is 6.2 seconds, all the loading time to the
visible
INCOFT 2025 - International Conference on Futuristic Technology
394
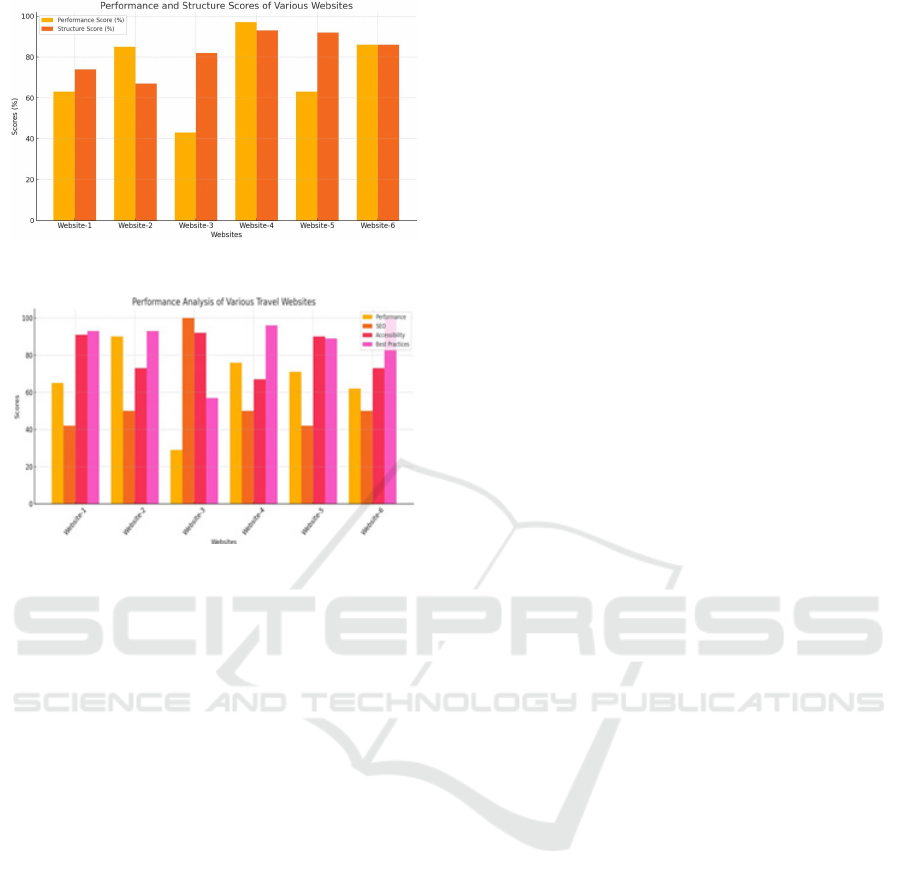
Figure 1: Visualization plot for website analysis
Figure 2: Bar Graph for Performance and Structure Scores
of Various Websites
elements is below the threshold that is considered good feel
by the users. Finally, there is CLS score which is 0.15
meaning that pages have tiny sized layout shift during
loading that results in reduction of quality of user
experience when a user tries to engage with content that is
partially loading.
4.2 GTmetrix
4.2.1 Website-1
For website 1, it is clear that there are opportu- nities
for improvement when it comes to performance
metrics; on ‘GTmetrix Grade’ the site is rated at 63per
which, on the scale used, indicates that the site
performance is only slightly above average or just
below average; depending on how the score is
interpreted. Moving to the happier note, Largest
Contentful Paint happens at 832ms which all denote
the largest element seen loads rather well. But TBT is
high at 1.6 sec; therefore, there is a sign of slowness
in the user Interface as well as the response time.
They outline very low CLS, at 0.01, suggesting that
the page is asey with almost no fluctuation in layout.
Nevertheless, because the total page size is good size,
7,23 MB, and it generates 228 requests, it will be
likely to negatively influence overall speed.
Nevertheless, reducing the blocking time and
optimising the page sizes might further increase the
satisfaction and thus engagement of visitors like
website1
4.2.2 Website-2
2 performance metrics that were analyzed on the
website 2 have shown decent efficiency but there are
still potentialities for further enhancement. Indeed,
the website gotten a Gtmetrix grade of C at 78per,
as well as a performance score of 85. This is actually
a type of satisfying and already indicates an upward
trend. Its Structure Score is even lower and equals
to 67per, which means that it could perform
significantly better in terms of the website structure
optimization. At 1.1 seconds it boasts of a great
largest Contentful Paint to signify good load time
for the largest visible element. Total Blocking Time
amounted to 235ms which hints at some latency
affecting the resource’s interaction side for the user.
The CLS is again low at 0.02 which refers that there
is pinpoint stability of the screen with little distortion.
In addition, the site is generating high requests, the
entire page is also very heavy and weighs 3.81MB,
which means that high requests of 583, would slow.
In sum, to improve utilization and follow the likely
occurrence of quick and easy access to the web site,
TripAdvisor should improve the established structure
of its site and reduce its requests.
4.2.3 Website-3
The performance metrics of the website 3 are
concerning as it scores only a low GTmetrix Grade
at E level and just 43per Performance Score.
Measuring the LCP to 2.0 seconds, it is below average
about the time that will take in loading the largest
visible element, which might provoke an annoyed
user. The TBT stands at 1.6 seconds; this indicates the
extent of blocking times that still obstruct user
interaction and responsiveness. At a Cumulative
Layout Shift of 0.09, there is slight visual instability.
While this score seems low and likely shouldn’t have
manifested itself as it did, it does uncover problem
spots on the website. The total page size is
6.23MB, meaning it is pretty big-a probable reason
for slower loads-generating a significant 330
requests across the site. Booking.com needs to
emphasize optimizations that prioritize decreasing
page sizes and requests while maximizing load speeds
in order to drive broader performance improvements.
These are the enhancements that improve user
experience and ensure sustenance in customer
engagement on the platform.
Enhancing Digital Travel Experiences: A Performance Case Study of Key Websites in India
395

4.2.4 Website-4
The performance metrics for the website 4 are
excellent, reflecting the perfect effectiveness with
which it strives to provide a fast and responsive user
experience. This is achieved by having scored a
remarkable GTmetrix Grade of A (95per), where the
site clearly boasts a striking Performance Score of
97per and scores 93per on the Structure Score. Some
key indicators of speed comprise a Largest Contentful
Paint of just 1.2 seconds, reflecting a swift load
time for the most important visible element. TBT is
also 0ms, meaning there is no blocking problem and
has a completely responsive page. CLS is at 0.03,
which shows a minor visual instability but within
acceptable limits. The total size of the page is highly
efficient at 156KB, suggesting quick loading time,
and the website requires only 14 requests to load
everything, which further improves general
performance. These metrics reflect how MakeMyTrip
performs on the technical front but also covers points
that promote user satisfaction. The end result would
be smooth browsing, higher user engagement, better
conversion rates, and customer loyalty.Website 4
website performs exceptionally well, with high
performance and structure scores. It has a fast load
time, no blocking issues, and minimal layout shifts,
ensuring a smooth and responsive user experience.
4.2.5 Website-5
The performance metrics of the website 5 indi-
cate moderate overall effectiveness in many areas
with some to be improved. The GTmetrix Grade C
suggests 75per performance whereas the
performance score only has 63per, showing a lot
of room for improvement. The Structure score is
quite good at 92per, and it suggests a very well-
organized website. The LCP measures at 1.4
seconds, which is quite fast but has some more room
for optimization. However, the Total Blocking Time
(TBT) is surprisingly high at 616ms, which creates
quite large responsiveness problems that would affect
the user experience. The best thing is that the
Cumulative Layout Shift (CLS) is excellent, at 0.01,
with very stable visual presentation and very nearly
no layout shifts. With these strengths, however, the
site brings a total page size of 1.70MB, and it makes
106 requests, which is far higher than ideal for an
efficient load time. For better performance, Goibibo
could focus on the reduction of blocking time and the
number of requests as such improvements might
result in a user experience of less blocks and more
engagement that leads to better customer satisfaction
and retention.
4.2.6 Website-6
Performance metrics for Lastminute.com are
rather good with a GTmetrix Grade of B (86per). The
website has a good score in terms of performance,
with 86per and is paired along with a structure score
at 86per hence indicating the quality design and
functionality. Largest Contentful Paint is at an
impressive 1.1 seconds, pointing to a good load time
for the most significant visible element. It also has
Total Blocking Time quite low at 224ms and shows
excellent response with minimal delays when a user
interacts with the page. An absolutely interesting
aspect of information is that the website scores a total
of Cumulative Layout Shift, which is 0; thus, no
visual instability is witnessed when loading,
improving overall usability. With a total page size of
2.06MB, the site remains in a moderate size and
supports easy loading. Also, the site generates 129
requests, which is very efficient. The response given
by users regarding Lastminute.com has been smooth
and interactive, which makes it an excellent platform
for online travel services.
5 CONCLUSION AND FUTURE
WORK
In each website exhibits specific areas for
improvement to enhance overall user experience and
functionality. website-3 should focus on Performance
improvements, particularly in page speed and
reducing blocking time, to complement its excellent
Accessibility and SEO scores. website-1 and website-
5 can boost user satisfaction by enhancing speed and
optimizing loading times to improve their moderate
Performance scores. website-4 performs well but
could increase Accessibility to ensure a more
inclusive experience. website-6.com has strong
security and standards compliance due to its high Best
Practices score but could improve on speed and user
interface fluidity by optimiz- ing blocking time and
accessibility features. website-2 is well- rounded;
however, slight improvements in Accessibility would
make it more user-friendly for a broader
audience.Ultimately, website-2 emerges as the top
performer due to its strong balance across metrics,
closely followed by website-4 for its competitive
scores in key areas. website-5, website-1, and
website-6.com also show commendable
performance but have room for targeted
improvements. Despite website-3’s high SEO and
Accessibility scores, it ranks lowest overall due to
substantial gaps in speed and Best Practices,
INCOFT 2025 - International Conference on Futuristic Technology
396

highlighting specific opportunities to optimize user
experience.
6 FUTURE WORK
Future work could focus on a broader analysis by
testing additional travel websites to gain a
comprehensive understanding of performance trends
in the industry. Expanding the performance tests to
include detailed security audits, as well as examining
the impact of design changes on user engagement,
could yield deeper insights. Furthermore, given the
increasing use of smartphones for travel-related web
access, exploring the impact of these opti- mizations
on mobile devices would be beneficial.
Conducting user satisfaction surveys could also
complement technical evaluations, ensuring that both
technical performance and user experience are
addressed comprehensively.
REFERENCES
Kumar, N., Kumar, S. and Rajak, R., 2021, December.
Website Performance Analysis and Evaluation using
Automated Tools. In 2021 5th International Conference
on Electrical, Electronics, Communication, Computer
Technologies and Optimization Techniques
(ICEECCOT) (pp. 210-214). IEEE.
Pradana, F.A. and Suprayogi, S., 2021. Critical discourse
analysis on Chinese and American news websites
reporting South China Sea territorial dispute.
Linguistics and Literature Journal, 2(2), pp.84-92.
Panduwika, P. and Solehatin, S., 2024. Performance
measurement implementation on the smart fisheries
village website using page speed insight. Journal of Soft
Computing Exploration, 5(2), pp.161-172.
Almatrafi, A.M. and Alharbi, Z.H., 2023. The impact of
web analytics tools on the performance of small and
medium enterprises. Engineering, Technology Applied
Science Research, 13(5), pp.11753-11762.
Saad, M., Zia, A., Raza, M., Kundi, M. and Haleem, M.,
2022. A comprehensive analysis of healthcare websites
usability features, testing techniques and issues. IEEE
access, 10, pp.97701-97718.
Supriya, M., Keshav Rathinavel, and Divya Radhakrishnan.
"Development of a Comprehensive Learning
Management System using Full Stack Technology: A
Modern Approach to Educational Platforms." In 2024
5th International Conference on Data Intelligence and
Cognitive Informatics (ICDICI), pp. 1426-1431. IEEE,
2024.
Singh, V.K., Singh, P., Karmakar, M., Leta, J. and Mayr,
P., 2021. The journal coverage of Web of Science,
Scopus and Dimensions: A comparative analysis.
Scientometrics, 126,
Kumaladewi, N., Rahajeng, E. and Arif, B., 2023,
November. Analyze and Measure Website Quality
Using WebQual 4.0, Importance Performance Analysis
Methods and GTMetrix. In 2023 11th International
Conference on Cyber and IT Service Management
(CITSM) (pp. 1-6). IEEE.
Narassima, M. S., Shriram K. Vasudevan, K. Vimalkumar,
and S. P. Anbuudayasankar. "Blockchain-based
seamless end-to-end shipping with android
application." International Journal of Internet
Technology and Secured Transactions 12, no. 3 (2022):
265-285.
Dhivvya, J. P., Guru Aswini Dath, Mahesh Kumar Chinta,
and Ankit Karki. "Granular Network Traffic
Classification on Mobile Application Service for Better
Parental Control." In 2024 IEEE International
Conference on Interdisciplinary Approaches in
Technology and Management for Social Innovation
(IATMSI), vol. 2, pp. 1-6. IEEE, 2024.
Enhancing Digital Travel Experiences: A Performance Case Study of Key Websites in India
397
