
Smartwatch-Enabled Data Analytics for AI-Based Evaluation of
Teaching and Learning Processes
Deepali Kayande
a
and Swetta Kukreja
Amity School of Engineering and Technology, Amity University Maharashtra, Mumbai, India
Keywords: Smartwatch-Enabled Analytics, Artificial Intelligence in Education, Teaching-Learning Evaluation, Student
Engagement Monitoring, Cognitive Load Assessment, Data-Driven Pedagogy.
Abstract: The importance of the teaching-learning process in shaping outcomes is critical, necessitating the
development of new evaluation methods for effective implementation. This paper presents a framework for
evaluating and optimizing a smart teaching-learning ecosystem, utilizing data analytics and AI methodologies
facilitated by smartwatches. Wearable technology captures real-time physiological and behavioral metrics
(e.g., heart rate, physical activity, and attention levels) from students during classroom instruction. Artificial
intelligence algorithms analyze this data to assess engagement, cognitive load, and responsiveness to various
instructional methods. These insights are synthesized into actionable feedback for educators, providing
information that can enhance pedagogical strategies that align more closely with learner needs. This facilitates
the examination of trends and anomalies among various learner types to improve inclusivity in education.
This study illustrates the practicality of employing data analytics alongside wearable technology to develop a
comprehensive methodology for evaluating learning and teaching effectiveness. The preliminary results
demonstrate the system's ability to provide accurate, scalable, and real-time insights, advancing beyond
statistical analyses to support evidence-based educational interventions. This solution represents a significant
advancement in modernizing academic assessment and integrating technology and pedagogy.
1 INTRODUCTION
The teaching-learning process is the basis of
education, influencing information acquisition and
strengthening critical thinking and growth abilities.
The traditional assessment method falls short in
consistently examining how the various classroom
dynamics play out individually. This gap shows the
need for new, data-driven methodologies to analyze
and enhance teaching methods and learning results
(Nada, Alsaleh, et al. , 2020), (Munna and Kalam,
2016).
With the rise of wearables like smartwatches and
the capability of artificial intelligence (AI), the
chance to dramatically modify educational evaluation
has come. Smartwatches, are portable devices with
sophisticated sensors, enabling real-time gathering of
biological and field data (e.g., heart rate, activity
level, and attention level). These measurements give
a unique view into student engagement, cognitive
load, and responsiveness across instructional sessions
a
https://orcid.org/0009-0003-8794-6316
which may lead to a fuller understanding of the
teaching-learning process (Morales, Arroyo, et al. ,
2023).
This study provides a methodology to efficiently
employ smartwatch-enabled data analytics and AI in
analyzing and enhancing educational methods. Using
live data, artificial intelligence algorithms investigate
tendencies and offer applicable suggestions for
instructors, which permits a better contoured and
move towards joint studying experience. The
methodology also exposes patterns and outliers
across diverse learner demographics, expanding
possibilities to guarantee fairness and flexibility in
learning beyond the particular classroom. In contrast
to static, one-size-fits-all assessment paradigms, the
recommended alternative embraces dynamic,
evidence-based procedures. Initial findings
demonstrate that the technology can deliver accurate,
scalable, and real-time data, allowing instructors to
improve their approaches and ultimately boost
student accomplishment. This research marks an
Kayande, D. and Kukreja, S.
Smartwatch-Enabled Data Analytics for AI-Based Evaluation of Teaching and Learning Processes.
DOI: 10.5220/0013592600004664
Paper published under CC license (CC BY-NC-ND 4.0)
In Proceedings of the 3rd International Conference on Futuristic Technology (INCOFT 2025) - Volume 2, pages 367-373
ISBN: 978-989-758-763-4
Proceedings Copyright © 2025 by SCITEPRESS – Science and Technology Publications, Lda.
367

important step in updating academic evaluations to
fulfill the demands of a fast-changing educational
environment by merging technology and pedagogy.
2 LITERATURE SURVEY
The table covers major research publications on AI
and data analytics applications, concentrating on
methodologies, technology, and conclusions. The
research includes smartwatch-enabled data analysis
for user experience (S-O-R theory), healthcare
monitoring (early disease diagnosis), and stress
detection using deep learning models (CNN, LSTM).
Additional study covers face recognition (98.66%
accuracy), EEG-based attention detection (96%
accuracy using RNN), voice activity detection (86%
accuracy), and multimodal data fusion for gaze
analysis (92.5% accuracy). Object identification and
attention analysis utilizing sophisticated deep
learning models (e.g., YOLO V8) demonstrated great
accuracy and performance across datasets. These
studies demonstrate the promise of AI in many
disciplines, stressing accuracy and scalability.
3 PROPOSED METHODOLOGY
3.1 Data Collection and System Design
The major aim of the first research phase was to
develop an elaborate framework for incorporating
wristwatch data into the teaching-learning assessment
process. Heart rate, physical activity, and attention
levels were identified as significant markers of
student involvement and cognitive load. The system
architecture was designed with wristwatch data input,
AI-powered processing layers, and output modules
that deliver helpful insights.
3.2 AI-Powered Data Analysis
To manage physiological and behavioral data
obtained from smartwatches, machine learning
models were constructed and trained. These models
predicted engagement levels and cognitive states by
assessing physical activity, heart rate variability, and
other data. A better knowledge of the factors
determining learning efficacy was made possible by
the AI-powered study, which also discovered patterns
in the way students reacted to diverse teaching styles.
Early experiments indicated that these models may
give accurate and meaningful insights regarding
classroom dynamics.
3.3 Feedback Mechanism
Implementation
To bridge the gap between data analysis and practical
solutions, a feedback mechanism was put in place.
Teachers were able to alter their teaching approaches
to better meet the requirements of certain students or
groups owing to the system's personalized feedback.
Comprehensive data on engagement patterns,
changes in cognitive load, and responses to
instructional tactics were all included in the feedback.
This curriculum supported a dynamic and adaptive
learning environment by stressing the real-world
application of AI-driven insights.
3.4 Testing and Validation
A restricted dataset was employed for the system's
first testing to establish its effectiveness and utility.
The findings proved the system's potential to manage
real-time smartwatch data and offer relevant insights
correctly. Small improvements were made to increase
the feedback system's accuracy and fine-tune the
algorithms. This stage established the potential and
scalability of merging wearable technology with
artificial intelligence for educational evaluation.
Figure 1. Architecture Diagram representing the steps
followed in the work implemented
4 EXPERIMENTS AND RESULTS
4.1 Basic Dataset
A dataset of 250 engineering students, including
social, behavioral, and physiological data from
smartwatches, was gathered to quantify attention and
involvement during class. Variables include
movement, response time, heart rate, and engagement
INCOFT 2025 - International Conference on Futuristic Technology
368
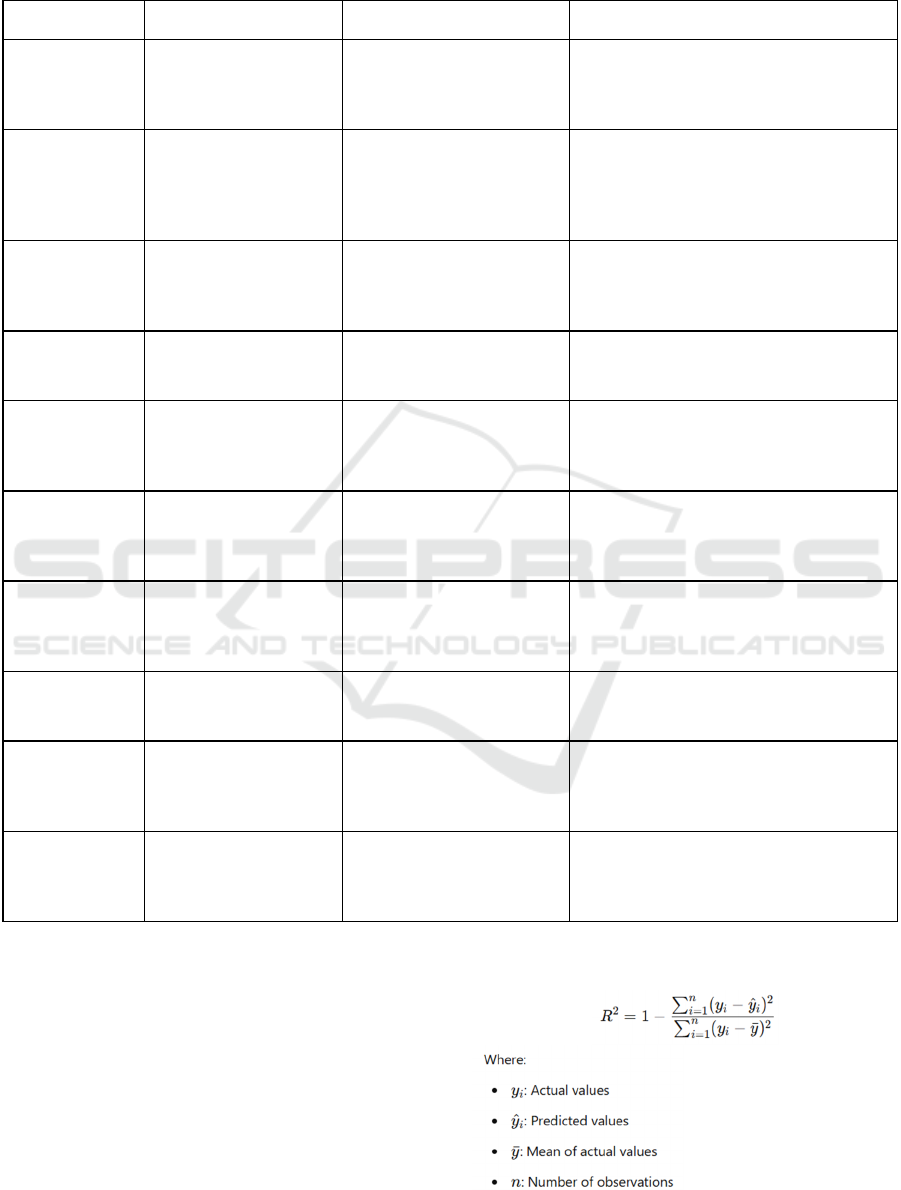
Table 1: Literature Survey comparison table with various authors and their findings
Paper Key Focus Methods/Technologies Used Results/Findings
Uzir et. al., (Uzir,
Halbusi, et al. ,
2021)
User experience, trust,
and happiness with AI-
enabled smartwatches
durin
g
COVID-19
S-O-R theory, surveyed 486
users in Bangladesh
Product quality, service quality,
convenience, and simplicity influence user
experience and trust. Moderated by age and
g
ender.
Masoumian
Hosseini, et. al
(Hosseini,
Hosseini, et al. ,
2023
)
Smartwatch usage in
healthcare
Reviewed 35 publications on
topics like COVID-19, heart
disease, and stress monitoring
Smartwatches recognize early signs of
illnesses but require better algorithm
precision and reliability for medical use.
R. Murugappan et
al. (Murugappan,
Bosco, et al. ,
2020
)
Stress detection via
physiological inputs
Deep learning models (CNN,
LSTM), noise reduction, and
normalization
Achieved 93% accuracy for stress vs. non-
stress, 85% for stress vs. amusement, and
83% for stress vs. amusement vs.
meditation.
V. Warak et al.
(Warankar, Jain,
et al. , 2024
)
Face recognition, eye
gaze, and head rotation
models
Dataset of 100,000 images,
standardization, augmentation
Achieved 98.66% accuracy in controlled
conditions and 97.78% in unpredictable
conditions.
S. Sudharasan et
al. (Sudharsan,
Siddharth, et al. ,
2024)
EEG signal analysis for
attention span detection
SVM, Random Forest, RNN;
theta and beta wave cleaning
Achieved accuracy: SVM (73%), Random
Forest (75%), and RNN (96%).
V. Karthikraj et
al. (Karthikraj,
Patil, et al. ,
2021
)
]
Vocal activity detection
using student video data
PoseNet, multiclass
classification
Achieved 86% accuracy for vocal activity
detection.
T. Singh et al.
(Singh,
Mohadikar, et al. ,
2021)
Facial analysis using deep
learning models
CPAM, DNNR; datasets:
300W-LP, AFLW2000,
NIMH-CHEFS
CPAM achieved MAE < 3°, outperforming
QuatNet and HyperFace (MAE up to 6°).
K. Mallibhat et al.
(Mallibhat, , et al.
, 2021)
Multimodal data fusion
for eye gaze and micro-
expression
CNNs, LSTM, SVM; real-
time cameras and sensors
Achieved 92.5% accuracy in analyzing eye
gaze and micro-expressions.
Wenchi Ma et al.
(Wenchi, Wu, et
al. , 2020)
Object detection using
multi-scale deep fusion
networks
MDFN with Inception
Modules and VGG-16;
datasets: KITTI, PASCAL
VOC, COCO
Achieved accuracies: KITTI (83.9%),
PASCAL VOC (79.3%), and COCO
(29.8%).
A. P. Kumar & N.
S. Kumar(Kumar,
and, Kumar,
2020)
Attention analysis using
annotated datasets
YOLO V8, CNN; features:
pupil area, gaze tracking
Achieved high performance with accuracy
(98.6%), precision (98.4%), recall (98.2%),
and F1-score (98.5%).
measures. Machine learning techniques were utilized
to assess model performance using R2 and Mean
Absolute Error (MAE). R2 examines how well the
model explains variation, whereas MAE quantifies
prediction error. High R2 and low MAE suggest high
model fit, guiding method selection, and
enhancement via preprocessing and feature
engineering to improve forecast accuracy.
R
2
Score (Coefficient of Determination): It
measures the proportion of variance in the dependent
variable that is predictable from the independent
variables.
Smartwatch-Enabled Data Analytics for AI-Based Evaluation of Teaching and Learning Processes
369
Mean Absolute Error (MAE): It measures the
average magnitude of the errors in a set of
predictions, without considering their direction.
Accuracy: It measures the percentage of correctly
predicted instances (especially for classification
tasks)
The basic parameters considered for the dataset
are:
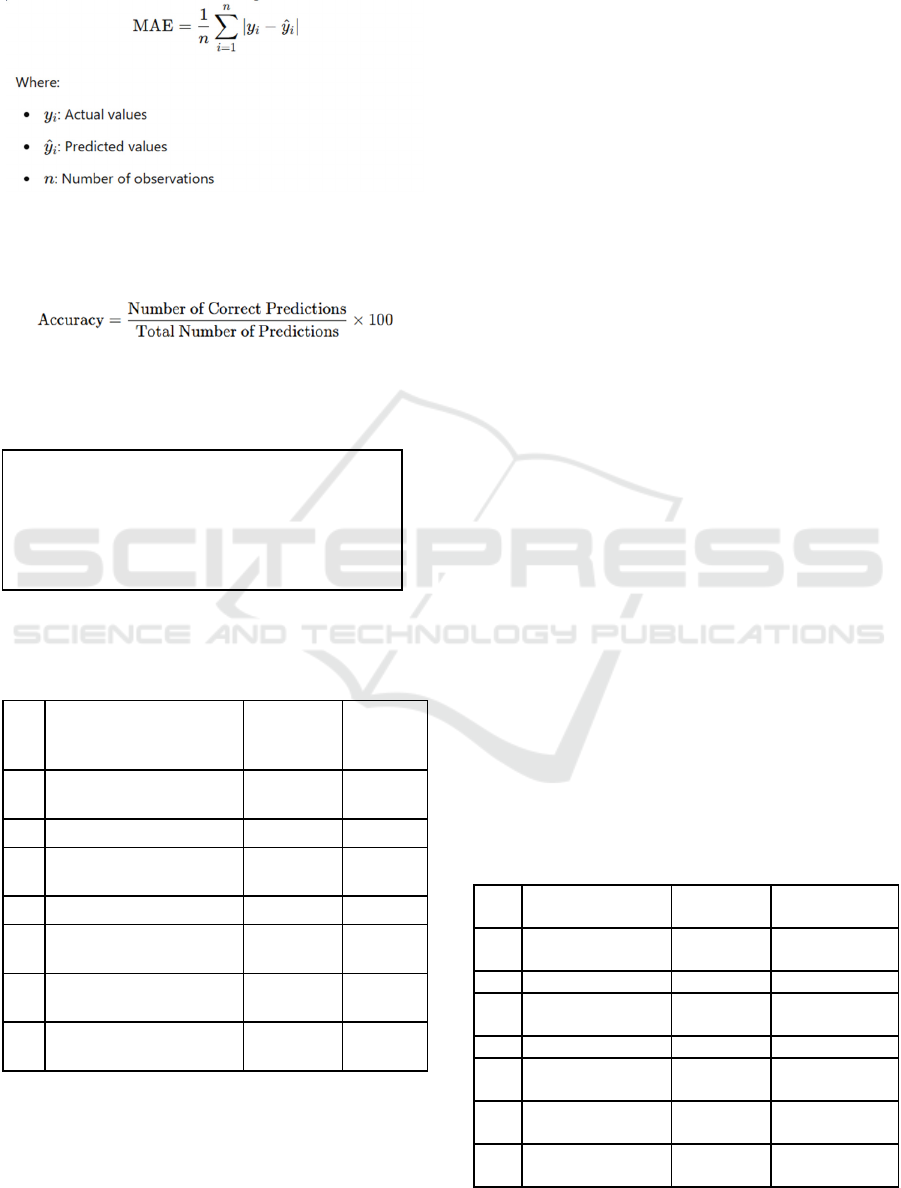
Table 2: Results obtained for ML algorithms with basic
dataset used
Sr.
No
Model Average R²
Score
Mean
Absolute
Erro
r
1 Support Vector
Regression
-0.138 20.623
2 Random Forest -0.124 23.102
3 Gradient Boosting
Re
g
resso
r
-0.131 22.865
4 XGBoost Re
g
resso
r
-0.309 24.520
5 K-Nearest Neighbors
(
KNN
)
-0.250 23.896
6 Tuned Gradient Boosting
Regresso
r
-0.004 20.529
7 Tuned XGBoost
Re
g
resso
r
0 20.443
SVR slightly outperformed Linear Regression in
terms of MAE but still had a negative R² score,
reflecting limited predictive power and inability to
capture meaningful relationships in the data.
The Random Forest model exhibited a negative R²
and the highest MAE, suggesting potential overfitting
or an inability to generalize well to new data.
Among the models tested, Gradient Boosting
performed best. However, the negative R² score
suggests it still struggles to capture meaningful
patterns in the data.
XGBoost's performance is worse than Gradient
Boosting, with a more negative R² score, indicating
further difficulty in explaining the variance in
engagement scores.
KNN showed intermediate performance but was
unable to generalize well, reflected by the negative R²
score.
For Tuned Gradient Boosting Regressor the R²
score is close to zero, indicating the model explains
almost none of the variance, though it has improved
significantly from prior negative scores. The MAE
has also reduced, indicating the predictions are closer
to actual engagement scores.
XGBoost achieved the best performance, with an
R² score close to zero. This means it still slightly
underperforms against a naive mean predictor, but the
improvement suggests it is much closer to capturing
underlying patterns compared to previous results.
4.2 Normalized Dataset
The dataset has been normalized to guarantee uniform
scaling and reduce biases from various variable
ranges. Physiological markers (e.g., heart rate, skin
conductance), session details (e.g., length, task
difficulty), and behavioral indications (e.g.,
movement, reaction time, distractions) were scaled
equally, with the engagement score as the objective
variable. Normalization enhanced model con-
vergence and stability, boosting machine learning
performance.
Table 3. Results obtained for ML algorithms with the
normalized dataset used
Sr.
No
Model Average R²
Score
Mean Absolute
Erro
r
1 Support Vector
Re
g
ression 0.352 0.437
2 Random Forest 0.466 0.358
3 Gradient Boosting
Regresso
r
0.31 0.59
4 XGBoost Regresso
r
0.408 0.497
5 K-Nearest
Nei
g
hbors
(
KNN
)
0.212 0.499
6 Tuned Gradient
Boosting Regresso
r
0.475 0.490
7 Tuned XGBoost
Re
g
resso
r
0.505 0.462
Student_ID, Session_ID, Time_of_Day,
Session_Duration, Task_Complexity, Heart_Rate,
Heart_Rate_Variability, Skin_Conductance,
Physical_Movement, Response_Time,
Distraction_Incidents, Focus_Duration,
E
n
g
a
g
ement
_
Score
INCOFT 2025 - International Conference on Futuristic Technology
370
Support Vector Regression shows decent
performance; better MAE but lower R² than RF. It has
a moderate R² score (0.352), explaining 35.2% of the
variance, with an MSE of 0.434, reflecting higher
prediction errors than the Random Forest model.
Random Forest shows strong performance; good
balance of R² and MAE. Also achieves the highest R²
score (0.466), indicating it explains about 46.6% of
the variance in the Engagement_Score. It also has the
lowest MSE (0.358), suggesting smaller prediction
errors compared to the other models.
Gradient Boosting Regressor, shows moderate but
underperforms compared to RF and SVR.
XGBoost Regressor performs well but improves
significantly with tuning.
K-Nearest Neighbors (KNN) has weak
performance; not suitable for this dataset.
Tuned Gradient Boosting Regressor has improved
but slightly behind XGBoost in performance.
Tuned XGBoost Regressor has best overall
performance; with highest R² and lowest MAE.
4.3 Updated parameters
To further enhance the results, the dataset was revised
to include further physiological and environmental
parameters from smartwatches and sensors, which
include heart rate, HRV, EDA, SpO₂, respiration rate,
body temperature, steps, motion intensity, screen
interactions, sleep quality, ambient light, and noise
levels. The expanded dataset, covering dynamic
engagement factors like light and noise, offers a solid
foundation for implementing machine learning to
discover trends, improve precision, and obtain
insights into the teaching-learning process.
The updated parameters considered for the dataset
are:
Table 4. Results obtained for ML algorithms with updated
dataset used
Sr.
No
Model Average R²
Score
Mean Absolute
Erro
r
1 Support Vector
Machine
-0.046 12.382
2 Random Forest -0.175 13.116
3 Gradient Boosting
Regresso
r
-0.175 13.116
4 XGBoost Regressor -0.445 14.482
5 K-Nearest
Nei
g
hbors
(
KNN
)
-0.223 13.198
For Support Vector Machine the predictions are
not accurate enough, likely due to SVR being
sensitive to parameter tuning and feature scaling.
For Random Forest a slight improvement in
accuracy is observed but still poor performance
overall.
For Gradient Boosting Regressor the predictions
deviate significantly from the actual values, as
reflected in the low accuracy.
In XGBoost Regressor the highest percentage
error indicates poor predictive performance.
A small improvement over Random Forest and
Gradient Boosting in terms of accuracy is seen with
K-Nearest Neighbors (KNN).
4.4 After feature engineering
Through improving findings, feature engineering was
applied to further refine physiological,
environmental, and behavioral metrics for
engagement analysis. Engagement levels were
estimated using a "Focus Index" (HRV and stress
metrics) and a "Restlessness Score." Conditions like
heart rate, skin conductance, and sleep quality were
examined alongside contextual factors, with
regulated variations added for reliability. This
improved dataset records intricate relationships,
improving model training and evaluation.
The parameters after feature engineering for the
dataset are:
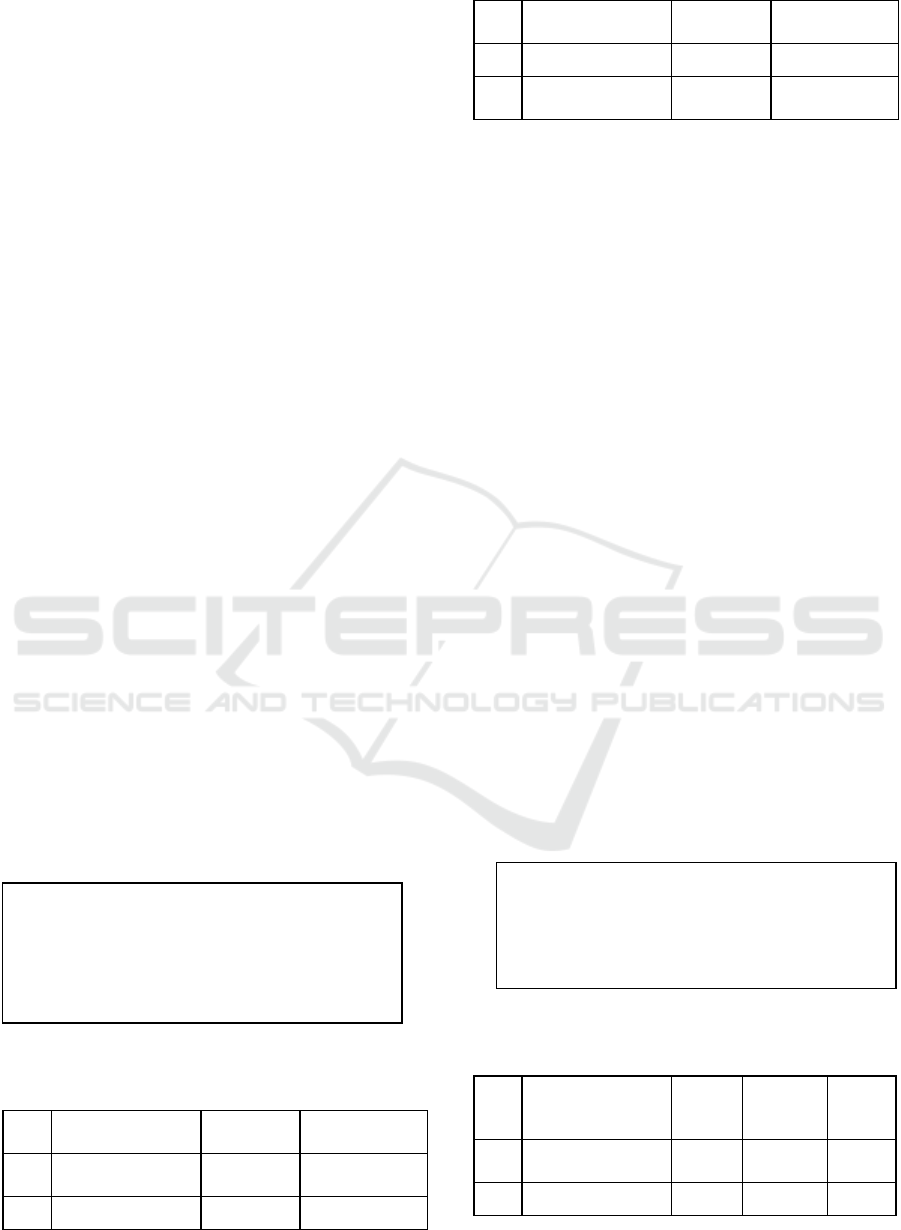
Table 5. Results obtained for ML algorithms with feature
engineered dataset
Sr.
No
Model Average
R² Score
Mean
Absolute
Erro
r
Accurac
y
1 Support Vector
Machine
0.601 0.233 84
2 Random Forest 0.975 0.015 93.5
Heart Rate, HRV, EDA (Skin Conductance),
Respiration Rate, Steps, Skin Temp, Activity Level,
Sleep Quality, Time of Day, Noise Level, Focus
Index, Restlessness Score, Cognitive Load Index,
Engagement
User ID, Timestamp, Heart Rate (bpm), HRV (ms),
EDA (μS), SpO₂ (%), Respiration Rate
(breaths/min), Body Temp (°C), Steps Count,
Motion Intensity, Screen Interactions, Sleep Quality
(%), Ambient Light (lux), Noise Levels (dB),
E
n
g
a
g
ement Score
Smartwatch-Enabled Data Analytics for AI-Based Evaluation of Teaching and Learning Processes
371
3 Gradient Boosting
Regresso
r
0.969 0.017 95
4 XGBoost Regressor 0.956 0.015 94.5
5 K-Nearest
Nei
g
hbors
(
KNN
)
0.781 0.148 91.5
Support Vector Machine is slightly better fit than
Linear Regression, but with slightly lower accuracy.
Random Forest shows excellent fit, very low
MAE, and high accuracy. It seems to be the best
performing model.
Gradient Boosting Regressor is another strong
performer, very close to Random Forest in terms of
fit and MAE. High Accuracy.
Similar to Random Forest, XGBoost Regressor
shows a strong fit, low MAE, and high accuracy.
For K-Nearest Neighbors (KNN) performance
falls between the tree-based models and linear
models. Relatively lower MAE.
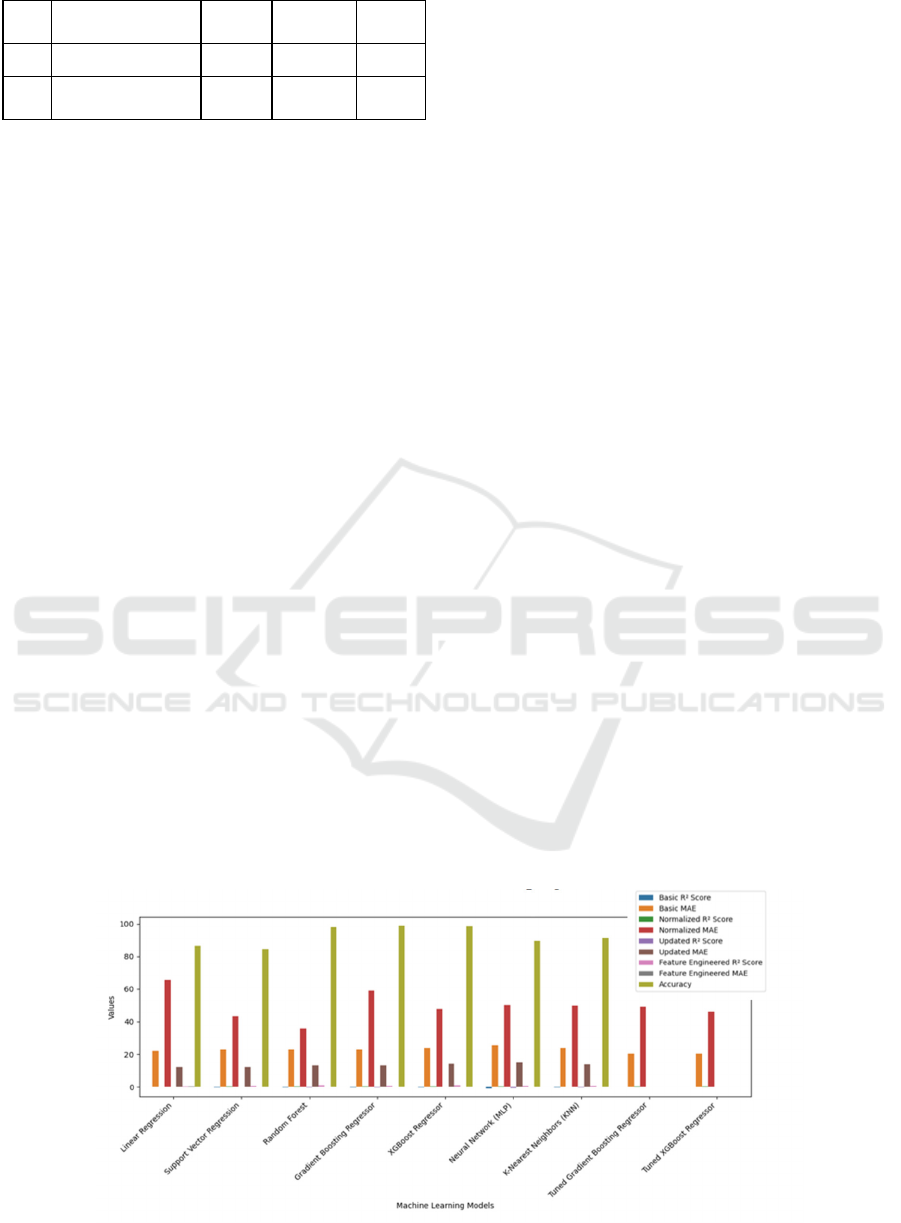
Nine machine learning models' performances are
compared in the table using four different datasets: a
feature-engineered dataset, a normalized dataset, an
updated dataset with updated parameters, and a basic
dataset with limited parameters. Models such as
Random Forest, Gradient Boosting Regressor, and
XGBoost Regressor achieved near-perfect R2 scores
(0.975, 0.969, and 0.956, respectively) and the lowest
Mean Absolute Errors (MAE) of 0.015, 0.017, and
0.019, along with high accuracy exceeding 98%.
Overall, feature engineering greatly improves
performance. Although they performed somewhat
better than ensemble models, neural networks (MLP)
and KNN also demonstrated improvement. Lower R2
scores and greater MAEs were obtained from basic
and normalized datasets, demonstrating the crucial
role that feature engineering and data pretreatment
play in model performance.
5 CONCLUSION AND FUTURE
SCOPE
The investigation analyses several machine learning
models across several datasets to forecast
engagement levels. The results show that ensemble
approaches, in particular Random Forest, Gradient
Boosting Regressor, and XGBoost Regression,
continuously beat other models, with high accuracy
(up to 99%), low Mean Absolute Error (MAE as low
as 0.0149), and high 𝑅2 scores (up to 0.975).
Performance was greatly enhanced via feature
engineering and dataset augmentation, underscoring
the need for data pretreatment. With low or negative
R2 values, linear models such as Linear Regression
and Support Vector Regression (SVR) did not
perform well, demonstrating their incapacity to grasp
the intricate relationships present in the datasets.
Because of their greater MAE and lesser accuracy,
neural networks (MLP) and KNN performed
mediocrely compared to ensemble models.
More sophisticated data pretreatment methods,
including deep feature synthesis or automated feature
selection, can be the subject of future studies to
improve prediction accuracy even more. Model
robustness and generalizability can be enhanced by
testing with bigger and more varied datasets.
Investigating sophisticated architectures such as deep
learning models (such as Transformer-based or
recurrent neural networks) that are adapted to
temporal or sequential data may also reveal complex
interaction patterns. Further enhancing predictive
performance may involve adjusting hyperparameters
and using ensemble learning or model stacking.
Implementation in real-time in dynamic
environments, such as wearable technology for
tailored engagement monitoring, is another
developing area.
Figure 2. Comparative Performance of Machine Learning Models
INCOFT 2025 - International Conference on Futuristic Technology
372
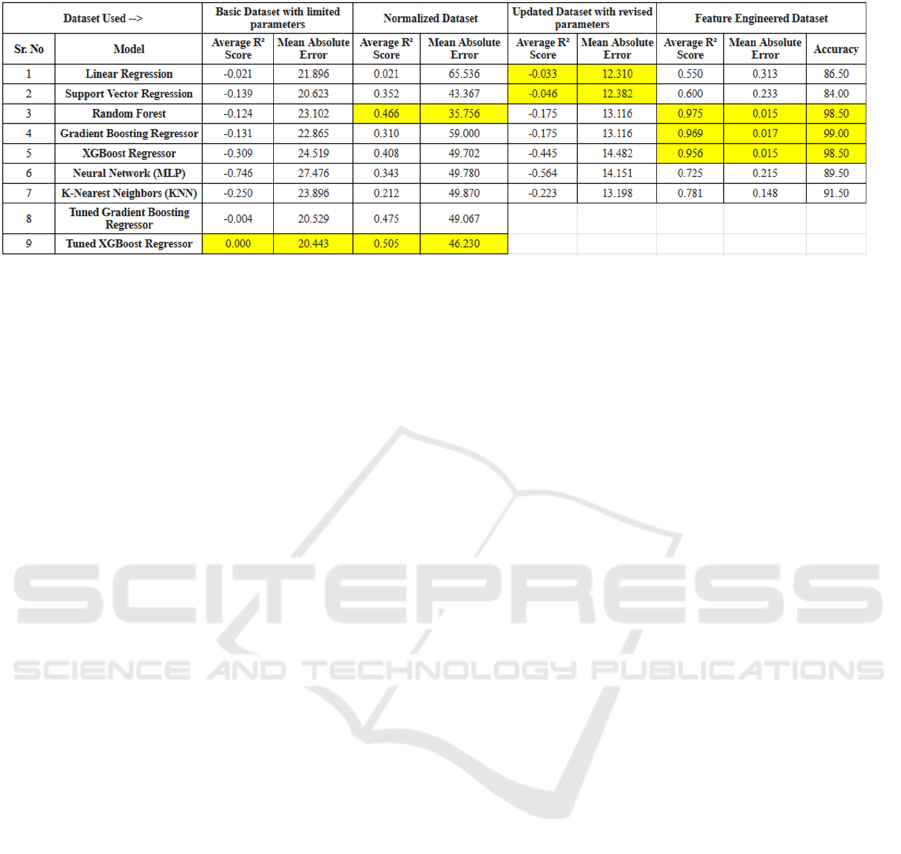
Table 6: Comparison of various ML algorithms on different datasets and their performances
REFERENCES
Nada J. Alsaleh (2020). "Teaching Critical Thinking Skills:
Literature Review". TOJET: The Turkish Online
Journal of Educational Technology, 19(1).
Afzal Sayed Munna & Md Abul Kalam (2021). "Teaching
and learning process to enhance teaching effectiveness:
a literature review". International Journal of
Humanities and Innovation, 4(1).Author, F.: Article
title. Journal 2(5), 99–110 (2016).
Glasserman-Morales LD, Carlos-Arroyo M, Ruiz-Ramirez
JA and Alcantar-Nieblas C (2023) Use of wearable
devices in the teaching-learning process: a systematic
review of the literature. Frontiers in Education,
8:1220688.
Uzir MUH, Al Halbusi H, Lim R, Jerin I, Abdul Hamid AB,
Ramayah T, Haque A. Applied Artificial Intelligence
and user satisfaction: Smartwatch usage for healthcare
in Bangladesh during COVID-19. Technol Soc. 2021
Nov;67:101780. doi: 10.1016/j.techsoc.2021.101780.
Epub 2021 Oct 14. PMID: 34697510; PMCID:
PMC8528563.
Masoumian Hosseini M, Masoumian Hosseini ST, Qayumi
K, Hosseinzadeh S, Sajadi Tabar SS. Smartwatches in
healthcare medicine: assistance and monitoring; a
scoping review. BMC Med Inform Decis Mak. 2023
Nov 3;23(1):248. Doi: 10.1186/s12911-023-02350-w.
PMID: 37924029; PMCID: PMC10625201.
Liu, Zhi & Ren, Yupei & Kong, Xi & Liu, Sannyuya.
(2022). Learning Analytics Based on Wearable
Devices: A Systematic Literature Review From 2011 to
2021. Journal of Educational Computing Research. 60.
073563312110647. 10.1177/07356331211064780.
R. Murugappan, J. J. Bosco, K. Eswaran, P. Vijay and V.
Vijayaraghavan, "User Independent Human Stress
Detection," 2020 IEEE 10th International Conference
on Intelligent Systems (IS), Varna, Bulgaria, 2020, pp.
490-497, doi: 10.1109/IS48319.2020.9199928.
V. Warankar, N. Jain, B. Patil, M. Faizaan, B. Jagdale and
S. Sugave, "Analysis of Attention Span of Students
using Deep Learning," 2024 MIT Art, Design and
Technology School of Computing International
Conference (MITADTSoCiCon), Pune, India, 2024,
pp. 1-7, doi:
10.1109/MITADTSoCiCon60330.2024.10575321
S. Sudharsan, S. Siddharth, M. Uma and R. Kaviyaraj,
"Learning Behavior Analysis for Personalized E-
Learning using EEG Signals," 2024 International
Conference on Advances in Computing,
Communication and Applied Informatics (ACCAI),
Chennai, India, 2024, pp. 1-9, doi:
10.1109/ACCAI61061.2024.10601997
V. Karthikraj, V. Patil, S. Thanneermalai and T. Yadav,
"Attention Span Detection for Online Lectures," 2021
International Conference on Advances in Computing
and Communications (ICACC), Kochi, Kakkanad,
India, 2021, pp. 1-6, doi: 10.1109/ICACC-
202152719.2021.9708082.
T. Singh, M. Mohadikar, S. Gite, S. Patil, B. Pradhan and
A. Alamri, "Attention Span Prediction Using Head-
Pose Estimation With Deep Neural Networks," in IEEE
Access, vol. 9, pp. 142632-142643, 2021, doi:
10.1109/ACCESS.2021.3120098.
K. Mallibhat, "Student Attention Detection Using
Multimodal Data Fusion," 2024 IEEE International
Conference on Advanced Learning Technologies
(ICALT), Nicosia, North Cyprus, Cyprus, 2024, pp.
295-297, doi: 10.1109/ICALT61570.2024.00092
Wenchi Ma, Yuanwei Wu, Feng Cen, and Guanghui Wang.
2020. MDFN: Multi-scale deep feature learning
network for object detection. Pattern Recogn. 100, C
(Apr 2020).
https://doi.org/10.1016/j.patcog.2019.107149
A. P. Kumar and N. S. Kumar, "Zoom Classroom
Engagement and Attention Detection System," 2024
International Conference on Intelligent Systems for
Cybersecurity (ISCS), pp. 1-10, 2024, doi:
10.1109/ISCS61804.2024.10581101.
Smartwatch-Enabled Data Analytics for AI-Based Evaluation of Teaching and Learning Processes
373
