
Predicting E-Commerce Revenue Trends: A Fusion of Big Data Analytics
and Time Series Analysis
Nayantara Varadharajan, Mukil L. D., Sangita Khare and Niharika Panda
Dept. of Computer Science Engineering, Amrita School of Computing, Bengaluru, Amrita Vishwa Vidyapeetham, India
Keywords:
Big Data Analytics, Time Series Analysis, E-Commerce, Revenue Trends, Catboost, XGboost, LightGBM,
AdaBoost.
Abstract:
This paper explores the synergistic potential of big data analytics and time series analysis in unraveling in-
tricate patterns within historical sales data to predict and understand e-commerce revenue trends. The amal-
gamation of these two methodologies provides a robust framework for businesses to gain actionable insights,
enabling strategic decision-making and fostering revenue growth. The utilization of big data analytics enables
the processing and analysis of vast datasets, encompassing customer behaviors, market trends, and transac-
tional details. Coupled with time series analysis, which focuses on temporal patterns and trends, this fusion
approach offers a comprehensive understanding of the dynamic nature of e-commerce revenue. Through the
application of predictive models such as Catboost, XGboost, LightGBM and AdaBoost, businesses can foresee
future revenue trends, identifying peak sales periods, seasonal fluctuations, and potential market disruptions.
This foresight empowers e-commerce platforms to optimize pricing strategies, capitalize on emerging opportu-
nities, and mitigate risks. Furthermore, the integration of big data analytics and time series analysis facilitates
the identification of hidden correlations and customer preferences. By discerning patterns in user interactions,
businesses can tailor personalized customer experiences, enhancing satisfaction and loyalty. The strategic
insights derived from this fusion approach go beyond mere trend identification. Businesses can implement tar-
geted marketing campaigns, inventory management improvements, and website optimization strategies. This
holistic understanding of the e-commerce landscape equips organizations to adapt swiftly to market dynamics
and gain a competitive edge.
1 INTRODUCTION
In the realm of e-commerce, the explosion of digital
transactions has resulted in an unprecedented influx
of data, spanning customer behaviors, market dynam-
ics, and transactional intricacies. This deluge of infor-
mation, commonly referred to as big data(Ravindran
and Gopalakrishnan, 2018), presents both a chal-
lenge and an opportunity for businesses. While the
potential to yield valuable insights and drive strate-
gic decision-making is held by big data, navigating
through the sheer volume and complexity of this data
poses significant challenges. Extraction of action-
able insights from big data necessitates sophisticated
analytics tools and techniques capable of efficiently
processing and analyzing large-scale datasets. More-
over, in the context of e-commerce, where sales data
evolves, another layer of complexity is added by the
temporal dimension. A crucial methodology for un-
derstanding the temporal patterns and trends inherent
in e-commerce data has emerged through time series
analysis(S. Aswin and Vinayakumar, 2018). How-
ever, its integration with big data analytics presents its
own set of challenges, including data preprocessing
complexities, model scalability issues, and the need
for interpretability in predictive outcomes.
These challenges are aimed to be addressed in
our work by leveraging advanced predictive modeling
techniques and innovative data preprocessing strate-
gies to unlock the predictive potential of big data and
time series analysis in the context of e-commerce rev-
enue trends. This paper endeavors to harness the fu-
sion of big data analytics and time series analysis
to overcome the challenges posed by the voluminous
and dynamic nature of e-commerce data. By integrat-
ing advanced predictive models(A.S. Nambiar and
Panda, 2023) such as CatBoost(Sreekumar and Lek-
shmi, 2023), XGBoost(R. Gayathri and Nair, 2022),
LightGBM(P. Amitasree and Devi, 2021), and Ad-
aBoost(Sidharth and Kavitha, 2021) with sophisti-
Varadharajan, N., L D, M., Khare, S. and Panda, N.
Predicting E-Commerce Revenue Trends: A Fusion of Big Data Analytics and Time Series Analysis.
DOI: 10.5220/0013592300004664
Paper published under CC license (CC BY-NC-ND 4.0)
In Proceedings of the 3rd International Conference on Futur istic Technology (INCOFT 2025) - Volume 2, pages 351-359
ISBN: 978-989-758-763-4
Proceedings Copyright © 2025 by SCITEPRESS – Science and Technology Publications, Lda.
351

cated data preprocessing techniques, the aim is to ex-
tract actionable insights from large-scale e-commerce
datasets.
Within this paradigm, the deployment of ad-
vanced predictive models, such as CatBoost, XG-
Boost, LightGBM and AdaBoost becomes instrumen-
tal. These models excel in handling complex datasets,
providing a robust foundation for predicting peak
sales periods, identifying seasonal fluctuations, and
anticipating potential market disruptions. The predic-
tive prowess of these models empowers e-commerce
platforms to optimize pricing strategies dynamically,
seize emerging opportunities, and proactively miti-
gate risks, thereby laying the groundwork for sus-
tained revenue growth.
Beyond the realm of predictions, the integration
of big data analytics and time series analysis of-
fers a holistic understanding of the e-commerce land-
scape. Uncovering hidden correlations and discern-
ing customer preferences from historical data allows
businesses to tailor personalized customer experi-
ences(S. Narendranath and Jyotishi, 2018). Armed
with these insights, businesses can go beyond mere
trend identification, implementing targeted marketing
campaigns, optimizing inventory management, and
refining website strategies to enhance customer sat-
isfaction and loyalty.
In Section 2, a comprehensive review of exist-
ing research in the fusion of big data analytics and
time series analysis was conducted, aiming to con-
textualize the approach and identify gaps for innova-
tion. Section 3 outlined the proposed methodology,
highlighting the utilization of predictive models such
as CatBoost, XGBoost, LightGBM, and AdaBoost,
along with innovative data preprocessing strategies,
to address the challenging nature of e-commerce data.
Emphasizing the efficacy of these models in handling
complex datasets, Section 4 presented an in-depth ex-
perimental analysis, simulating real-world scenarios
to evaluate their predictive capabilities. By employ-
ing metrics like RMSE, Median Absolute Error, and
Mean Absolute Error, the performance of each model
was assessed, offering valuable insights into their pre-
dictive accuracy and robustness. Finally, in Section
5, key findings were summarized, underscoring the
contributions to e-commerce revenue prediction, and
future research directions were suggested to further
advance predictive modeling for e-commerce.
2 RELATED WORKS
Dai Wei et al. contribute significantly to the field
of e-commerce forecasting, leveraging a structural
time series model integrated with Google Trends data
to predict sales.(D. Wei and Shuaipeng, 2014) The
use of a structural time series model acknowledges
the inherent complexities in e-commerce sales pat-
terns, offering a comprehensive approach. The in-
corporation of web search data as a predictor adds a
new dimension by reflecting users’ online behavior,
capturing evolving consumer interests and choices
in the dynamic e-commerce landscape. Ravi Ku-
mar explores e-commerce sales forecasting by em-
ploying a hybrid machine learning approach, empha-
sizing advanced techniques to address contemporary
challenges.(Kumar, 2023) The use of hybrid mod-
els, combining various algorithms, demonstrates a nu-
anced understanding of the intricate patterns within e-
commerce sales data. Focusing on product sales fore-
casting aligns with the practical needs of businesses
in the dynamic e-commerce landscape, crucial for ef-
fective inventory management and strategic planning.
K Anushka Xavier et al. investigate analytical
methodologies for sales analysis and prediction, par-
ticularly focusing on the application of machine learn-
ing.(K.A. Xavier and Balamurugan, 2023) The incor-
poration of machine learning models aligns with the
increasing demand for data-driven decision-making
in the e-commerce sector. Notably, the study adopts
a global perspective, recognizing the diverse mar-
ket dynamics and technological landscapes shaping
e-commerce practices worldwide. The emphasis on
analytical methods underscores the commitment to
deriving meaningful insights from extensive datasets,
crucial for informed decision-making, optimized mar-
keting strategies, and overall operational efficiency in
e-commerce. A Khanna et al. provide valuable in-
sights into the application of predictive analytics in
the realm of e-commerce annual sales.(Makkar and
Jaiswal, 2022) The inclusion of predictive analytics in
the context of e-commerce annual sales underscores
the growing importance of leveraging data-driven ap-
proaches for strategic decision-making. By utiliz-
ing advanced analytics techniques, the authors offer
a framework for forecasting and understanding the
complex patterns inherent in e-commerce sales data.
B Singh et al. delve into predicting Amazon
sales through the application of time series model-
ing techniques, presenting valuable insights published
in 2020.(B. Singh and Sharma, 2020) By focusing
on one of the world’s largest e-commerce platforms,
Amazon, the study addresses the critical task of sales
forecasting. The choice of time series modeling re-
flects an understanding of temporal dependencies and
patterns inherent in sales data, aligning with estab-
lished forecasting best practices. Analyzing Ama-
zon’s sales adds practical relevance, given the plat-
INCOFT 2025 - International Conference on Futuristic Technology
352

form’s scale and product diversity, contributing in-
sights that can impact both academic research and
industry practices in e-commerce sales forecasting.
This interdisciplinary approach recognizes the com-
plexity of contemporary e-commerce systems, requir-
ing expertise not only in data science but also in power
and control domains. E.K.H Jing et al. propose an ap-
proach using data analytics techniques for sales fore-
casting for a short-term period in the e-commerce
marketplace, utilizing Shopee Malaysia as a case
study.(C.C.F.C. Chee and Jing, 2022) Three forecast-
ing methods, which comprises of Simple Moving Av-
erage (SMA), Dynamic Linear Regression (DLR),
and Exponential Smoothing (ES) these are evalu-
ated using metrics such as Mean Absolute Deviation
(MAD), Mean Absolute Percentage Error (MAPE),
and Mean Squared Error (MSE). The results consis-
tently indicate that SMA outperforms the other mod-
els, demonstrating the least error across various eval-
uation metrics.
H Pan et al. introduce a novel approach to sales
forecasting in e-commerce, employing Convolutional
Neural Network (CNN) for automated feature ex-
traction from structured time series data.(Pan and
Zhou, 2020) The algorithm, complemented by tech-
niques such as sample weight attenuation and trans-
fer learning, significantly enhances prediction accu-
racy compared to traditional methods. Experimen-
tal results, conducted on a dataset provided by Al-
ibaba Group and spanning various regions, demon-
strate the superior performance of the proposed algo-
rithm over other approaches, including ARIMA and a
complex feature-based model. YS Shih et al. intro-
duce a novel model for forecasting short-term prod-
uct demand in the e-commerce domain by integrat-
ing a Long Short-Term Memory (LSTM) approach
with sentiment analysis of consumer comments.(Shih
and Lin, 2019) Utilizing sales figures and comments
from the website ”taobao.com,” the LSTM model is
trained to predict future sales based on the time-series
sequence of sales and sentiment ratings. Given the
challenges of short-term goods with limited histori-
cal data, the study emphasizes the need for prompt
reactions to market conditions. The research demon-
strates that adjusting the weight of sentiment rat-
ings can enhance forecasting accuracy. The proposed
model achieves high accuracy in predicting sales for
goods with short-term demands, supporting efficient
decision-making in the E-commerce sector.
K Bandara et al. present a novel sales de-
mand forecasting framework for E-commerce, uti-
lizing Long Short-Term Memory (LSTM) net-
works.(K. Bandara and Seaman, 2019) Address-
ing challenges like non-stationary data and sparse
sales patterns, the proposed methodology incorpo-
rates cross-series information within related prod-
ucts. The framework involves systematic preprocess-
ing, LSTM network architecture with various learn-
ing schemes, and the inclusion of static and dynamic
features. The results highlight the effectiveness of
LSTM networks in capturing non-linear relationships
within E-commerce product hierarchies. G Sharma et
al. emphasize the pivotal role of prediction in various
facets of business, underscoring its increased com-
plexity due to market competition, diverse produc-
tion, and globalized supply chains.(Sharma and Patil,
2023) Leveraging advanced digital technologies like
cloud computing, IoT, and social media, it advocates
for big data analysis to enhance sales predictions, cus-
tomer behavior understanding, and supply chain man-
agement effectiveness. Focusing on the e-commerce
sector, the paper highlights the challenges in predict-
ing customer demands and stresses the multifaceted
factors influencing sales predictions.
3 PROPOSED METHODOLOGY
3.1 Data Preprocessing
Initially, missing values are addressed by dropping
rows with undefined ”CustomerID” and filling in
”Description” gaps with a placeholder. Negative
quantities, representing returned items, are removed,
and rows with zero or negative unit prices are filtered
out. The timestamp information is parsed, converting
”InvoiceDate” into a datetime object, and additional
features like day, month, and year are extracted.
Feature engineering introduces new dimensions,
such as the length of ”StockCode” and the count of
numeric characters in it. Outliers in ”UnitPrice” and
”Quantity” are filtered, ensuring the removal of ex-
treme values. The data is then structured for model-
ing through the creation of a pivot table, aggregating
daily quantities and revenues for each product, with
missing values appropriately filled.
Overall, these preprocessing steps collectively
handle data integrity, feature engineering, and out-
lier management, setting the stage for effective
time-series analysis. The resultant dataset is well-
structured and ready for subsequent stages, such as
model training, and model evaluation. The prepro-
cessing choices align with the goals of time-series
analysis and are tailored to the specific characteristics
of the dataset.
Predicting E-Commerce Revenue Trends: A Fusion of Big Data Analytics and Time Series Analysis
353

Table 1: Timeline of the Data
Start Timepoint 2010-12-01 08:26:00
End Timepoint 2011-12-09 12:50:00
Number of Days 373 days
3.2 Exploratory Data Analysis
The exploratory data analysis begins with a com-
prehensive review of the dataset, encompassing both
numerical and categorical features. Initial data
summaries reveal key statistics, distributions, and
unique values, while univariate analyses, including
histograms and box plots, expose patterns and out-
liers. Subsequent bivariate and multivariate analyses
delve into feature interactions, scrutinizing relation-
ships through scatter plots. For example, Fig 1 is a
bar graph where the most common product descrip-
tions is plotted where the x-axis depicts the product
name and the y-axis represents the count.
Figure 1: Most common product descriptions
EDA also involves handling missing values, de-
tecting outliers, and assessing overall data quality. Vi-
sualizations, which include bar graphs, enhance the
understanding of the dataset, enabling the identifica-
tion of potential influencing factors on the target vari-
able. In the Fig 2, the countries with respect to their
transaction are being plotted.
Figure 2: Countries by transaction counts
The graphs in Fig 3 and Fig 4 illustrate the dis-
tribution of daily product sales quantities. In the
first subplot, the untransformed distribution reveals a
right-skewed pattern, indicative of a majority of prod-
ucts experiencing lower daily sales. Notably, the pres-
ence of multiple peaks at quantities 1, 12, and 24 sug-
gests a multimodal distribution. The additional obser-
vation that these quantities often follow divisibility by
2 or 3 adds a layer of complexity, hinting at purchas-
ing behaviors where products are acquired in pairs or
Figure 3: Daily product sales distribution- Untrans-
formed distribution
Figure 4: Daily product sales distribution- Trans-
formed distribution
triplets.
In the second subplot, the application of a loga-
rithmic transformation aims to mitigate skewness and
accentuate differences in the lower quantity range.
Despite the transformation, the essential features of
the distribution persist. The reduced right-skewness
and clearer visibility of patterns post-transformation
enhances the understanding of the dataset.
3.3 Evaluation Metrics
The evaluation metrics chosen for the project are root
mean square error (RMSE), Median Absolute Error,
and Mean Absolute Error.
3.3.1 Root Mean Square Error
Root Mean Square Error or RMSE measures the aver-
age magnitude of the errors between predicted values
and actual values, providing a way to quantify how
well the model is performing in terms of prediction
accuracy. The model training and validation strategy
also involves careful consideration of the temporal na-
ture of the data, including a sliding window time se-
ries validation approach to account for the significant
increase in sales during the pre-Christmas period. The
root mean square error (RMSE) formula is given by:
E =
s
1
N
N
∑
n=1
(t
n
− y
n
)
2
(1)
INCOFT 2025 - International Conference on Futuristic Technology
354

3.3.2 Median Absolute Error
Median Absolute Error is an evaluation metric used to
assess the performance of a regression model. It mea-
sures the median of the absolute errors between pre-
dicted and actual values. The MAE is robust to out-
liers because it takes the median instead of the mean.
It is expressed in the same units as the target variable,
which makes it easy to interpret. Mathematically, if y
i
represents the actual value and ˆy
i
represents the pre-
dicted value for the i-th observation, then median ab-
solute error is calculated as:
MAE = median(|y
1
− ˆy
1
|, |y
2
− ˆy
2
|, . . . , |y
n
− ˆy
n
|) (2)
where
• n is the number of data points.
3.3.3 Mean Absolute Error
Mean Absolute Error is an evaluation metric used to
assess the performance of a regression model. It mea-
sures the average of the absolute errors between pre-
dicted and actual values. Mathematically, if y
i
repre-
sents the actual value and ˆy
i
represents the predicted
value for the i-th observation, then mean absolute er-
ror is calculated as:
MAE =
1
n
n
∑
i=1
|y
i
− ˆy
i
| (3)
where
• n is the number of data points.
3.4 Model Building
3.4.1 CatBoost
CatBoost is a machine learning algorithm designed
for gradient boosting on decision trees. It is particu-
larly well-suited for categorical features and provides
efficient handling of such features without the need
for extensive preprocessing. The objective of gradi-
ent boosting is to minimize a loss function by adding
weak learners (usually decision trees) iteratively.
The general formula for the prediction of a gradi-
ent boosting model at each iteration is:
F
t
(x) = F
t−1
(x) + α
t
h
t
(x) (4)
where:
• The predicted value at each iteration t is repre-
sented by ˆy
t
(x).
• ˆy
t−1
(x) is the prediction from the previous itera-
tion.
• α
t
is the learning rate for iteration t.
• h
t
(x) is the weak learner at iteration t.
3.4.2 XGBoost
XGBoost which is short for eXtreme Gradient Boost-
ing, is a popular and powerful machine learning algo-
rithm for both regression and classification tasks. It
is based on the framework of gradient boosting and
incorporates several enhancements to improve per-
formance and efficiency. XGBoost is known for its
speed, accuracy, and ability to handle complex rela-
tionships within the data. The formula for XGBoost’s
prediction is based on the additive expansion of weak
learners (typically decision trees) like other gradient
boosting algorithms. The general formula for the pre-
diction at each iteration is:
ˆy
i
=
K
∑
k=1
f
k
(x
i
) (5)
where:
• ˆy
i
i-th value is the predicted value observation.
• K is the total number of weak learners (trees) in
the model.
• f
k
(x
i
) is the prediction of the k-th weak learner for
the i-th observation.
The contribution of each tree is computed as:
f
k
(x
i
) = w
q(x
i
)
(6)
where:
• w is the weight assigned to the leaf node q(x
i
) that
the observation x
i
falls into.
3.4.3 LightGBM
LightGBM (Light Gradient Boosting Machine) is an-
other popular gradient boosting framework designed
for efficient training of large datasets and high-
dimensional feature spaces. It is particularly known
for its speed and scalability. Like XGBoost, Light-
GBM builds an ensemble of decision trees in a boost-
ing fashion, where each tree corrects the errors of the
previous ones. The prediction from LightGBM is typ-
ically represented as:
ˆy
i
=
K
∑
k=1
f
k
(x
i
) (7)
where:
• ˆy
i
is the predicted value for the i-th observation.
• K is the total number of weak learners (trees) in
the model.
• f
k
(x
i
) is the prediction of the k-th weak learner
(tree) for the i-th observation.
Predicting E-Commerce Revenue Trends: A Fusion of Big Data Analytics and Time Series Analysis
355

3.4.4 AdaBoost
AdaBoost which is short for Adaptive Boosting, is an
ensemble learning method that builds a classifier by
combining multiple other weak classifiers. A weak
classifier is a model that performs slightly better than
random chance and is also often referred to as a ”weak
learner.” AdaBoost assigns the weights to training in-
stances and adjusts these weights at each iteration,
emphasizing the misclassified instances to improve
overall performance. The formula for AdaBoost’s
prediction is:
F(x) = sign
T
∑
t=1
α
t
h
t
(x)
!
(8)
where:
• The final prediction is given as ( F(x))
• (α
t
) is the weight assigned to the weak classifier
at iteration ( t ).
• The prediction of the weak classifi ( h t(x) ) at
iteration ( t ).
• ( T ) is the total number of iterations (rounds).
To streamline the experimentation and compari-
son of models, a series of classes have been devel-
oped, including the Hyperparameter class for manag-
ing hyperparameters, the Catmodel class for individ-
ual model training and analysis, and the Hypertuner
class for Bayesian hyperparameter search. The Time-
SeriesValidationfamily class orchestrates the model
training with sliding window validation, facilitating
a comprehensive evaluation of the model’s perfor-
mance across different time periods. The model
building process also incorporates feature engineer-
ing, including the creation of product types, explo-
ration of temporal patterns, and the generation of lag
features. These engineered features aim to capture un-
derlying patterns and improve each model’s predic-
tive capabilities. The models underwent fine-tuning
using GridSearchCV to identify optimal hyperparam-
eter configurations, enhancing their predictive capa-
bilities. The k-fold cross-validation technique was
applied to rigorously evaluate each model’s perfor-
mance across diverse subsets of the dataset, ensuring
robustness and reliability. After this, the temporal pat-
terns of product sales were thoroughly examined us-
ing advanced predictive modeling techniques, specifi-
cally AdaBoost, XGBoost, LightGBM, and CatBoost.
The approach involved meticulous data preparation,
including handling missing values through imputa-
tion, and the application of hyperparameter tuning to
optimize model performance.
By applying multiple ensemble learning algo-
rithms (AdaBoost, XGBoost, LightGBM, CatBoost),
the analysis aims to compare their performances and
identify which model(s) provide the best predictive
capabilities for the given time series data.
4 RESULTS AND DISCUSSION
For the training of each model, it involved a 10-fold
cross-validation, with the objective of identifying op-
timal hyperparameters. The hyperparameters under
consideration were the learning rate and the num-
ber of estimators (trees). GridSearchCV was utilized
for hyperparameter tuning, systematically exploring a
predefined hyperparameter space.
After fitting the model with various hyperparam-
eter combinations, the best hyperparameters were de-
termined to be learning rate and number of estimators
with their respective values. The values are shown in
Table 2.
Table 2: Models with their Best Hyperparameter Values
Model Learning Rate No. of Estimators
CatBoost 0.1 100
AdaBoost 0.2 50
XGBoost 0.1 200
LightGBM 0.1 200
These hyperparameters were selected based on
their ability to minimize the Root Mean Squared Error
(RMSE), Median Absolute Error and Mean Absolute
Error during cross-validation, indicating their effec-
tiveness in capturing underlying patterns in the data.
RMSE, a metric measuring the average magnitude
of errors between actual and predicted values, pro-
vided insights into the model’s performance. Lower
RMSE values suggested better performance, indicat-
ing that the model’s predictions were closely aligned
with the true values. Additionally, the median abso-
lute error (MedAE) and mean absolute error (MAE)
were considered to complement the assessment. The
MedAE, being robust to outliers, offered a more ro-
bust measure of the central tendency of the errors,
while the MAE provided a straightforward average
of the absolute errors. Together with RMSE, these
metrics provided a comprehensive evaluation of the
model’s predictive accuracy. The overall performance
of the model was evaluated by considering the mean
RMSE, MedAE, and MAE across all folds. This eval-
uation process helped assess how well each model
generalized to unseen data, providing insights into its
predictive capabilities for the given problem.
This whole process was crucial for developing a
INCOFT 2025 - International Conference on Futuristic Technology
356
robust predictive model capable of making accurate
forecasts on time series data.
Table 3: Model Performance Metrics.
Model RMSE
Median
Mean
Absolute
Error
Absolute
Error
CatBoost 0.4110 0.607 0.558
XGBoost 0.2297 0.448 0.562
LightGBM 0.7195 0.469 0.572
AdaBoost 0.9241 0.677 0.734
The model evaluation metrics in Table 3 provide
valuable insights into the performance of different al-
gorithms on the given dataset. XGBoost emerges as
the most effective model, boasting the lowest RMSE
of 0.2297, as well as the lowest median and mean ab-
solute errors, indicating its superior predictive accu-
racy and robustness. CatBoost follows closely with
a competitive RMSE of 0.4110 and relatively lower
median and mean absolute errors, making it a strong
performer as well. However, LightGBM exhibits
a higher RMSE of 0.7195, along with higher me-
dian and mean absolute errors, signaling compara-
tively less accurate predictions. AdaBoost, with the
highest RMSE of 0.9241 and consistently high me-
dian and mean absolute errors, trails behind the other
models in terms of predictive precision. These re-
sults underscore the significance of algorithm selec-
tion, with CatBoost and XGBoost demonstrating no-
table prowess in minimizing prediction errors across
multiple evaluation metrics.
Complementing the quantitative assessments, vi-
sual explorations were conducted to understand sales
patterns over time. These visualizations included de-
pictions of total sales trends, sales distribution across
weekdays, and sales variations throughout different
years and months. The interpretation of these visu-
alizations provides valuable insights into the nuanced
dynamics of product sales, offering a holistic under-
standing of the dataset.
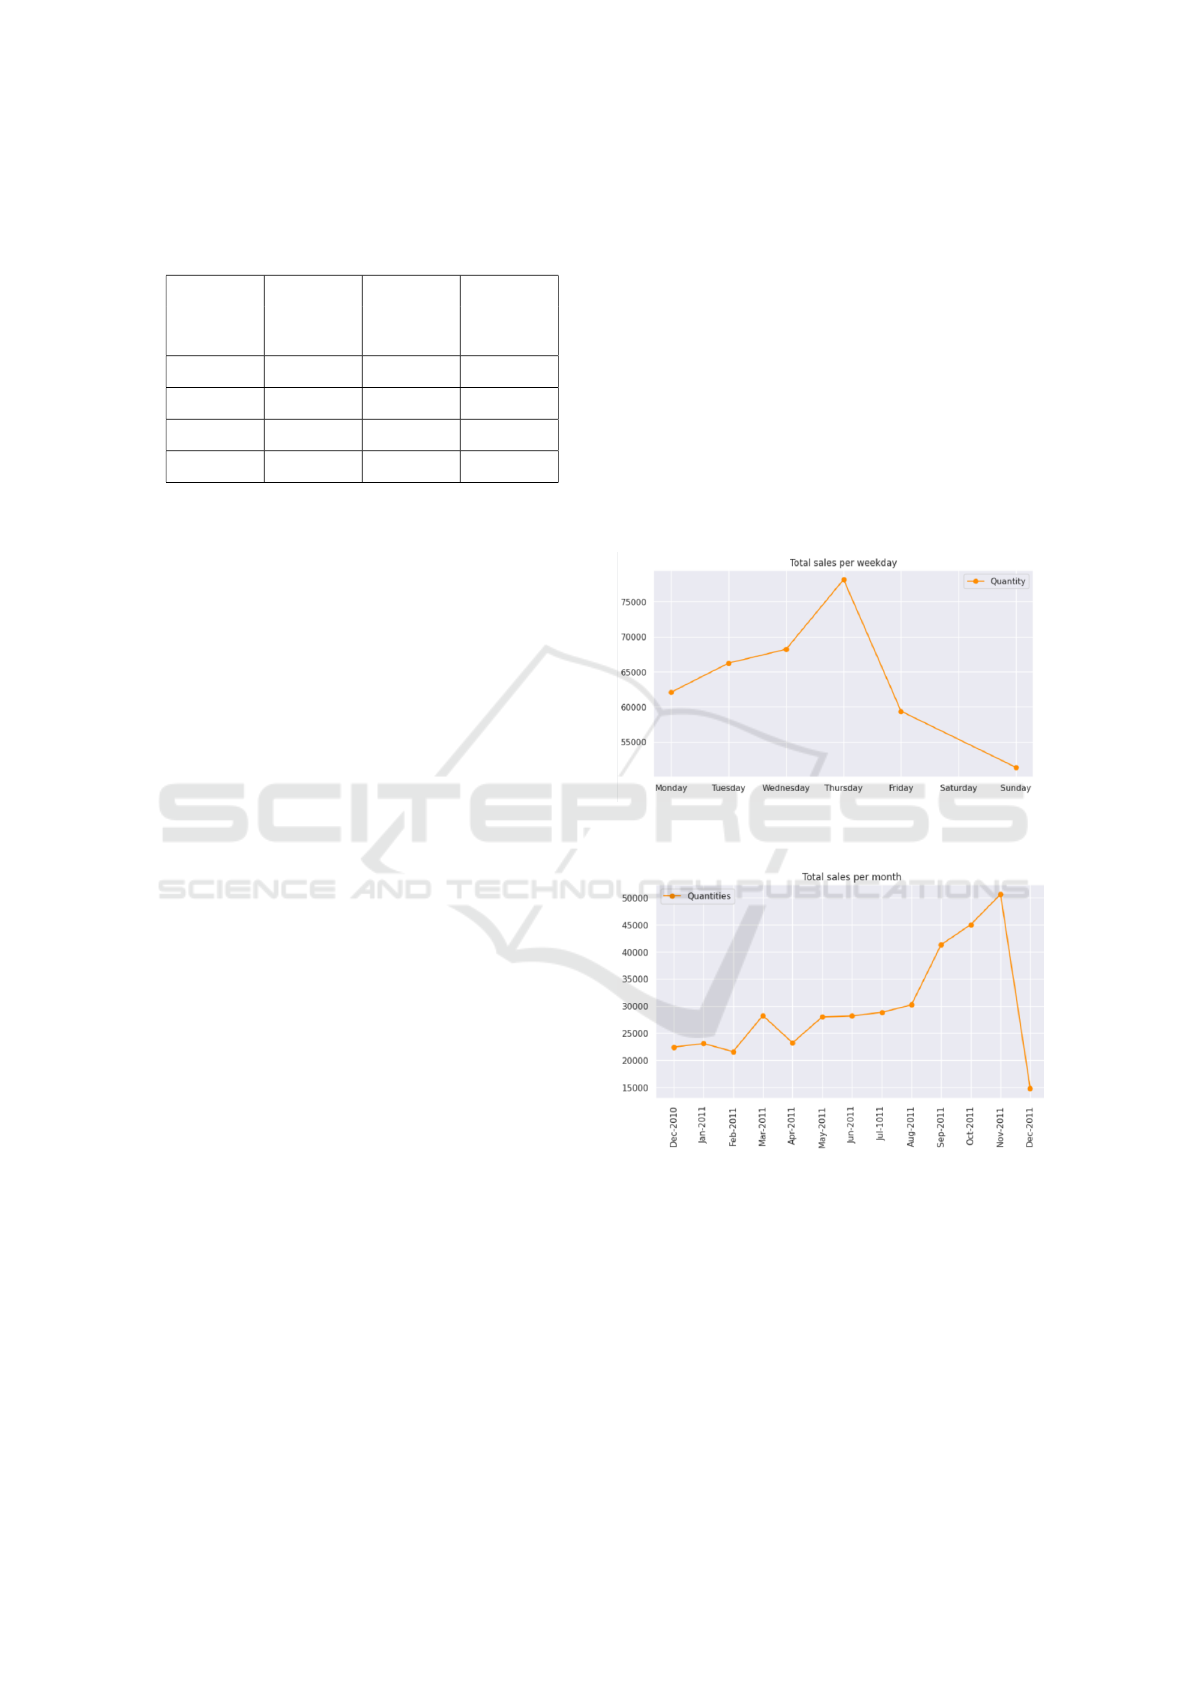
The temporal analysis shown in Fig 5 and Fig 6 of
daily quantities sold revealed interesting patterns. The
weekday emerged as a significant feature, aligning
with earlier explorations that indicated higher product
sales from Monday to Thursday. This correlation was
visually confirmed in the plot, where low weekday
values (Monday to Thursday) correlated with high
product sales, while higher values (Friday to Sunday)
corresponded to lower sales.
Thursday emerged as the day with the highest
product sales, while Friday and Sunday exhibited sig-
nificantly lower transactions. Saturdays showed no
transactions at all. Additionally, the pre-Christmas
season, starting in September and peaking in Novem-
ber, highlighted the importance of seasonality. Febru-
ary and April stood out as months with notably low
sales.
It is noteworthy that all four predictive models
demonstrated little to no divergence in their sales pat-
tern graphs. The plots generated by these models ex-
hibited remarkable similarity, underscoring their con-
sistency in capturing and reflecting the underlying
temporal sales patterns. This convergence suggests
that the models, despite their differences, yielded
comparable insights into the dataset’s temporal dy-
namics.
Figure 5: Temporal graph of total sales per weekday
Figure 6: Temporal graph of total sales per month
The generated insights, coupled with the visu-
alizations depicting sales trends over time, provide
businesses with potent tools to enhance their sales
forecasting strategies. It is essential to acknowledge
that the effectiveness of these analyses hinges on the
dataset’s unique characteristics. Tailoring predictive
models to capture intricate patterns and fluctuations
in daily product sales empowers businesses to make
informed decisions, optimize inventory management,
and drive revenue growth. This multifaceted approach
Predicting E-Commerce Revenue Trends: A Fusion of Big Data Analytics and Time Series Analysis
357

to time series analysis stands as a robust framework
for businesses seeking actionable intelligence from
their sales data.
5 CONCLUSION
This project presents a comprehensive approach to
predictive modeling. It seamlessly integrates data
exploration, advanced regression modeling with Cat-
Boost, XGBoost, LightGBM and AdaBoost, thought-
ful validation strategies, hyperparameter optimiza-
tion, and extensive feature engineering. Through this
iterative process, XGBoost emerged as the standout
performer, showcasing its efficacy in predicting sales
quantities and providing valuable insights into the un-
derlying dynamics of the dataset. In conclusion, big
data analytics and time series analysis are indispens-
able tools for e-commerce businesses seeking to un-
cover hidden insights, make informed decisions, and
drive revenue growth. The identification of XGBoost
as the most effective model adds a crucial layer to
the project’s significance, emphasizing its prowess in
handling the complexities of the given dataset.
ACKNOWLEDGEMENTS
The authors thank Amrita School of Computing, Ben-
galuru, for their support and resources in conducting
this study.
REFERENCES
A.S. Nambiar, K. Likhita, K. P. and Panda, N. (2023). Ex-
ploring the power of deep learning for seamless back-
ground audio generation in videos. In 2023 14th Inter-
national Conference on Computing Communication
and Networking Technologies (ICCCNT), pages 1–7.
IEEE.
B. Singh, P. Kumar, N. S. and Sharma, K. (2020).
Sales forecast for amazon sales with time series
modeling. In 2020 First International Confer-
ence on Power, Control and Computing Technologies
(ICPC2T), pages 38–43. IEEE.
C.C.F.C. Chee, K.L. Chiew, I. S. and Jing, E. (2022). Data
analytics approach for short-term sales forecasts using
limited information in e-commerce marketplace. Acta
Informatica Pragensia, 11(3):309–323.
D. Wei, P. Geng, L. Y. and Shuaipeng, S. (2014). A pre-
diction study on e-commerce sales based on structure
time series model and web search data. In The 26th
Chinese Control and Decision Conference (CCDC),
pages 5346–5351. IEEE.
K. Bandara, P. Shi, C. B. H. H. Q. T. and Seaman, B.
(2019). Sales demand forecast in e-commerce using a
long short-term memory neural network methodology.
In Neural Information Processing: 26th International
Conference, ICONIP 2019, Sydney, NSW, Australia,
December 12–15, 2019, Proceedings, Part III, pages
462–474. Springer International Publishing.
K.A. Xavier, C. Manjunath, M. M. V. G. N. J. and Bal-
amurugan, M. (2023). Analytical methods of ma-
chine learning model for e-commerce sales analysis
and prediction. In 2023 IEEE International Confer-
ence on Contemporary Computing and Communica-
tions (InC4), pages 1–6. IEEE.
Kumar, R. (2023). Hybrid machine learning method for
product sales forecasting in e-commerce. In 2023 4th
International Conference on Smart Electronics and
Communication (ICOSEC), pages 781–787. IEEE.
Makkar, S. and Jaiswal, S. (2022). Predictive analytics on
e-commerce annual sales. In Proceedings of Data An-
alytics and Management: ICDAM 2021, Volume 1,
pages 557–567. Springer Singapore.
P. Amitasree, G. V. and Devi, V. (2021). Electricity con-
sumption forecasting using machine learning. In 2021
2nd International Conference on Smart Electronics
and Communication (ICOSEC), pages 1–8. IEEE.
Pan, H. and Zhou, H. (2020). Study on convolutional neural
network and its application in data mining and sales
forecasting for e-commerce. Electronic Commerce
Research, 20(2):297–320.
R. Gayathri, P.B. Pati, T. S. and Nair, R. (2022). A frame-
work for the prediction of diabetes mellitus using
hyper-parameter tuned xgboost classifier. In 2022
13th International Conference on Computing Com-
munication and Networking Technologies (ICCCNT),
pages 1–5. IEEE.
Ravindran, N. and Gopalakrishnan, P. (2018). Predictive
analysis for healthcare sector using big data technol-
ogy. In 2018 Second International Conference On
Green Computing And Internet Of Things (ICGCIoT),
pages 326–331. IEEE.
S. Aswin, P. G. and Vinayakumar, R. (2018). Deep learn-
ing models for the prediction of rainfall. In 2018 In-
ternational Conference on Communication and Signal
Processing (ICCSP), pages 0657–0661. IEEE.
S. Narendranath, S. Khare, D. G. and Jyotishi, A. (2018).
Characteristics of ‘escaping’ and ‘falling into’ poverty
in india: An analysis of ihds panel data using machine
learning approach. In 2018 International Conference
on Advances in Computing, Communications and In-
formatics (ICACCI), pages 1391–1397. IEEE.
Sharma, G. and Patil, S. (2023). Big Data Analysis for Rev-
enue and Sales Prediction using Support Vector Re-
gression with Auto-regressive Integrated Moving Av-
erage, volume 15. SAMRIDDHI: A Journal of Phys-
ical Sciences, Engineering and Technology.
Shih, Y. and Lin, M. (2019). A lstm approach for sales
forecasting of goods with short-term demands in e-
commerce. In Intelligent Information and Database
Systems: 11th Asian Conference, ACIIDS 2019, Yo-
gyakarta, Indonesia, April 8–11, 2019, Proceedings,
INCOFT 2025 - International Conference on Futuristic Technology
358

Part I, pages 244–256. Springer International Publish-
ing.
Sidharth, V. and Kavitha, C. (2021). Network intrusion
detection system using stacking and boosting ensem-
ble methods. In 2021 Third International Confer-
ence on Inventive Research in Computing Applica-
tions (ICIRCA), pages 357–363. IEEE.
Sreekumar, A. and Lekshmi, R. (2023). Comparative study
of data driven methods for state of charge estimation
of li-ion battery. In 2023 2nd International Confer-
ence on Paradigm Shifts in Communications Embed-
ded Systems, Machine Learning and Signal Process-
ing (PCEMS), pages 1–6. IEEE.
Predicting E-Commerce Revenue Trends: A Fusion of Big Data Analytics and Time Series Analysis
359
