
Traffic Flow Detection and Prediction Using YOLO11: A
Threshold-Based Approach for Identifying Traffic Levels
Dheeraj Maladkar, E Aditya Sai Krishna, Satwik Nayak, Swaroop N Udasi and Channabasappa Muttal
School of Computer Science and Engineering,
KLE Technological University, Hubballi, India
Keywords:
YOLO11, Traffic Detection, Threshold, Traffic Management, C3K2, SPPF, C2PSA.
Abstract:
Traffic congestion is a major problem in cities, making it important to have better systems to detect and predict
traffic for better traffic management. This paper gives an insight about traffic flow detection and prediction
model utilizing YOLO11, an updated and advanced object detection model. The primary objective of this
research is to classify traffic levels based on the threshold set, serving a systematic approach for traffic moni-
toring. The system uses the number of vehicles detected on each image to classify it as a heavy traffic or light
traffic based on the pre-defined threshold. This approach signifies an efficient and automated model to assess
the traffic conditions, which can be applied in the developing cities and further help in traffic management and
intelligent transportation system. YOLO11 incorporates innovations like the C3K2 block, SPPF module, and
C2PSA block for increased accuracy and speed. The YOLO11 was compared with other YOLO models such
as YOLOv8,YOLOv9,YOLOv10 and the results showed that latest YOLO11 model performed best with its
accurate and faster results. The results highlight the effectiveness and efficiency of the YOLO11 in detecting
vehicles with 8 different classes with accurate results.
1 INTRODUCTION
Traffic flow detection is critical for efficient urban
planning(Wang et al., 2018) and traffic management,
helping authorities optimize the use of roads, reduce
congestion, and improve safety. Traffic flow detection
plays a crucial role in ensuring effective urban plan-
ning and traffic management. It enables authorities to
optimize road usage, reduce congestion, and enhance
safety. In India, traffic patterns vary significantly
across regions due to differences in urban infrastruc-
ture, population density, and road usage. Metropoli-
tan cities like Delhi, Mumbai, and Bengaluru are in-
famous for their heavy traffic congestion, especially
during peak hours. These cities experience high ve-
hicle density, leading to frequent traffic jams, long
commutes, and increased air pollution. The road in-
frastructure in such cities often struggles to keep up,
with narrow roads, limited public transportation op-
tions, and a high volume of private vehicles exacer-
bating the problem. Conversely, smaller towns and
rural areas tend to have lighter traffic but face unique
challenges, such as the prevalence of non-motorized
vehicles like bicycles, bullock carts, and pedestrians.
These factors add complexity to monitoring and man-
aging traffic flow in these regions.
Traditional traffic monitoring methods, such as
physical sensors embedded in the roadways or man-
ual observation, often have limitations such as scala-
bility, cost, and real-time data collection. Traditional
machine learning methods often relied on handcrafted
features, which were less adaptive to diverse traffic
conditions. Modern deep learning approaches, partic-
ularly Convolutional Neural Network (CNN)-based
architectures(Zhiqiang and Jun, 2017), have demon-
strated exceptional performance in object detection
tasks, including traffic monitoring. You Only Look
Once (YOLO) a CNN is a popular family of real-
time object detection models known for its speed and
accuracy. YOLO11(Jocher and Qiu, 2024), an im-
proved version of YOLOv10(Wang et al., 2024) from
the YOLO family, it’s employed in this project due to
it’s remarkable speed and accuracy in detecting ob-
jects within an image. YOLO11, unlike conventional
object detection models, analyzes the entire image in
a single pass, which drastically reduces processing
time, making it highly suitable for real-time traffic
monitoring. Its architecture is designed to detect and
classify various objects in traffic scenes, such as vehi-
cles, pedestrians, and other relevant entities, into pre-
Maladkar, D., Sai Krishna, E. A., Nayak, S., Udasi, S. N. and Muttal, C.
Traffic Flow Detection and Prediction Using YOLO11: A Threshold-Based Approach for Identifying Traffic Levels.
DOI: 10.5220/0013592000004664
Paper published under CC license (CC BY-NC-ND 4.0)
In Proceedings of the 3rd International Conference on Futuristic Technology (INCOFT 2025) - Volume 2, pages 335-343
ISBN: 978-989-758-763-4
Proceedings Copyright © 2025 by SCITEPRESS – Science and Technology Publications, Lda.
335

defined categories like cars, buses, motorcycles, and
trucks. By evaluating the number of detected objects
within a frame, the system effectively assesses and
predicts traffic levels. Based on predefined thresh-
olds of object counts, traffic can be classified as either
heavy or light, enabling traffic management systems
to make real-time decisions.The YOLO11(Khanam
and Hussain, 2024) model needs to be trained on a
well-curated dataset which contains wide range of
traffic scenarios. It is essential to capture images from
a wide range of environments to account for various
factors, including different weather conditions, light-
ing, and diverse perspectives. These factors can affect
how objects appear in images, so training the model
on varied data helps improve its robustness.
To increase dataset diversity and improve the
model’s adaptability to real-world scenarios, tech-
niques such as data augmentation—like flipping, ro-
tating, and altering brightness—are crucial. These
techniques enable models to manage variations, such
as differences between day and night traffic condi-
tions. Additionally, transfer learning, which involves
fine-tuning a pre-trained model on a smaller, domain-
specific dataset, helps speed up training and enhances
accuracy. This method utilizes the generalized knowl-
edge of pre-trained models, tailoring it to address spe-
cific challenges, such as India’s heterogeneous traffic
conditions. Customizing models for regional differ-
ences ensures precise vehicle detection and classifi-
cation in intricate environments. By integrating these
strategies, systems like YOLO11 can deliver real-time
insights, facilitating smarter traffic management, re-
ducing congestion, and improving road safety in ur-
ban settings(Chen, 2021)(Howard, 2018).
The paper is organized into five distinct sections,
each holding significance in explaining our work. The
first section focuses on the motivation behind select-
ing the problem statement and provides a detailed in-
troduction. The second section reviews the work pre-
viously carried out in this field. The third section
covers the methodology, beginning with the data col-
lection phase, followed by an in-depth discussion on
the model architecture, model development, and con-
cluding with the evaluation and performance analysis.
This section also provides a detailed explanation of
the YOLO11 model architecture. The fourth section
showcases the results obtained from the model, while
the fifth section concludes the paper by summarizing
the key features that contributed to the improved ac-
curacy of vehicle detection.
2 LITERATURE SURVEY
Intelligent Transportation Systems (ITS) have
adopted various methods to detect and predict traffic
flow, aiming to enhance traffic management, reduce
congestion, and improve mobility (Qureshi and
Abdullah, 2013). One widely used method involves
edge computing combined with YOLOv4 for vehicle
detection and DeepSORT for tracking multiple
objects (Bin Zuraimi and Kamaru Zaman, 2021).
This approach processes video feeds locally at edge
nodes, minimizing delays and reducing dependence
on cloud-based systems. While it improves real-time
accuracy in vehicle detection and tracking, it faces
challenges such as occlusions, poor lighting con-
ditions, and environmental variability, particularly
in high-density traffic scenarios. Additionally, this
method primarily focuses on detecting vehicles and
lacks the capability to effectively predict traffic flow,
limiting its utility for congestion forecasting.
A recent study combines deep learning models
like CNN-LSTM to predict traffic flow, utilizing cel-
lular automata-based simulations to generate train-
ing datasets. This approach addresses the issue of
insufficient real-world data for model training. The
CNN captures spatial patterns, while the LSTM de-
tects temporal trends, making it effective for short-
term traffic forecasting. However, this model is heav-
ily dependent on simulated data, which may not fully
reflect real-world conditions. Additionally, it does not
incorporate real-time vehicle detection, which is es-
sential for adaptive and dynamic traffic management
(Yang and Jerath, 2024).
Studies have also investigated the integration of
YOLOv4 with DeepSORT for vehicle detection and
tracking in traffic footage. This combination im-
proves the robustness of tracking, ensuring accurate
detection even when vehicles are partially obscured
or overlapping. Although it performs well for count-
ing and tracking vehicles, it lacks the functionality to
predict traffic density or trends, limiting its effective-
ness for proactive traffic management and congestion
forecasting (Ranjitha et al., 2023).
A study on one more machine learning algorithm
known as Single Shot MultiBox Detector (SSD) algo-
rithm(Su and Shu, 2024) provides an insights about
the traffic flow detection. The SSD algorithm has
gained popularity for its ability to perform object de-
tection in real-time. However, its traditional imple-
mentation struggles with feature extraction for small
or occluded vehicles, primarily due to the shallow
convolutional structure and lack of adaptability to di-
verse traffic scenarios. Combining the improved SSD
with the DeepSort tracking algorithm allows for ro-
INCOFT 2025 - International Conference on Futuristic Technology
336

bust vehicle tracking and direction determination.
Our project uses YOLO11 with a custom thresh-
old mechanism to predict traffic density as either
heavy or low. YOLO11’s advanced detection capa-
bilities allow it to classify vehicles more accurately,
even in challenging conditions. By setting a threshold
for traffic density, the system can immediately catego-
rize traffic flow, offering real-time insights for traffic
management. Additionally, deploying this system on
edge devices ensures it processes data quickly with
minimal delays, making it suitable for high-demand
scenarios.
This project not only improves on existing meth-
ods but also bridges the gap between vehicle detec-
tion and traffic density prediction. By combining
advanced features of YOLO11 with threshold-based
decision-making, the system is practical and scalable
for real-world use. It provides a cost-effective and ef-
ficient solution for monitoring traffic, predicting con-
gestion, and enabling smarter traffic management sys-
tems.
3 METHODOLOGY
This section provides a detailed overview of the mod-
els,methodologies, and their implementation strate-
gies employed for detecting the traffic flow with the
use of images.
3.1 Data Description
Data collection is a very basic and important step of
any project which is aimed at gathering accurate, rel-
evant, and comprehensive data to meet specific ob-
jectives of the project. Effective data collection in-
volves collection of data which is diverse, hence it
will help in training the model accurately. Our dataset
was taken from a website which consisted of a traffic
images dataset. The dataset used in our study consists
of a diverse set of traffic images, each containing vari-
ous vehicles such as cars, buses, and motorcycles with
corresponding labels. It consists of 5080 images and
each image consisting of a corresponding label. The
dataset was split into 3 parts namely train, valid and
test. The train data consists of 4476 images, the valid
data consists of 301 images and the test data consists
of 303 images. The data consists of various images
in various different conditions such as different light
conditions and also different angles. The images vary
from simple images consisting of just a single object
to images consisting of multiple different objects.
3.2 Model Architecture
This architecture lays the groundwork for YOLO11’s
design toward speed and accuracy in image process-
ing; it is based on preceding YOLO versions, like
YOLOv8(Sohan et al., 2024), YOLOv9(Wang et al.,
2025), and YOLOv10. The ideal YOLO11 innova-
tions are primarily from the C3K2 block, SPPF mod-
ule, and the C2PSA block. All these assist in pro-
cessing information with speed and accuracy by the
model. The Fig.1 shows the the YOLO11 architec-
ture.
3.2.1 Backbone
Convolutional Block: The convolutional block(Woo
et al., 2018) processes the input c, h, w through a 2D
convolutional layer, followed by a 2D Batch Normal-
ization layer, and finally with a SiLU activation func-
tion.
C3K2 block: YOLO11 features such blocks for
feature extraction at different backbone stages. Even
with the smallest of 3x3 kernels, this model is capa-
ble of capturing all the important elements from the
image, and yet this allows for more efficient comput-
ing. The C3K2 block(Jegham et al., 2024), an ad-
vancement of the CSP (Cross Stage Partial) bottle-
neck first presented in previous iterations, is the heart
of YOLO11. By dividing the feature map and apply-
ing a sequence of smaller kernel convolutions(3x3)
which are quicker and less expensive to compute than
larger kernel convolutions the C3K2 block optimizes
the information flow across the network.The C3K2
block enhances feature representation using fewer pa-
rameters by processing smaller, distinct feature maps
and combining them following several convolutions.
3.2.2 Neck
SPPF: The Space Pyramid Pooling Fast module
(Zhang and Gu, 2023) is a new development in pool-
ing within various regions of an image at different po-
sitional projections within the SPPF. It aids the capac-
ity of that network to hold objects, usually in small
size, which has always scaled concern in previous
YOLOS when it comes to object as small as apple bee
or lesser. The SPPF will collect multi-scale, aggre-
gated context to pool features with various max pool-
ing at various kernel sizes, thereby augmenting ele-
ment capture across different resolution sources in or-
der to train a model capable the identification of very
small subjects. The inclusion of SPPF also guaran-
tees YOLO11 to keep running at the same real-time
speed but with good multi-scale object detection ca-
pabilities.
Traffic Flow Detection and Prediction Using YOLO11: A Threshold-Based Approach for Identifying Traffic Levels
337
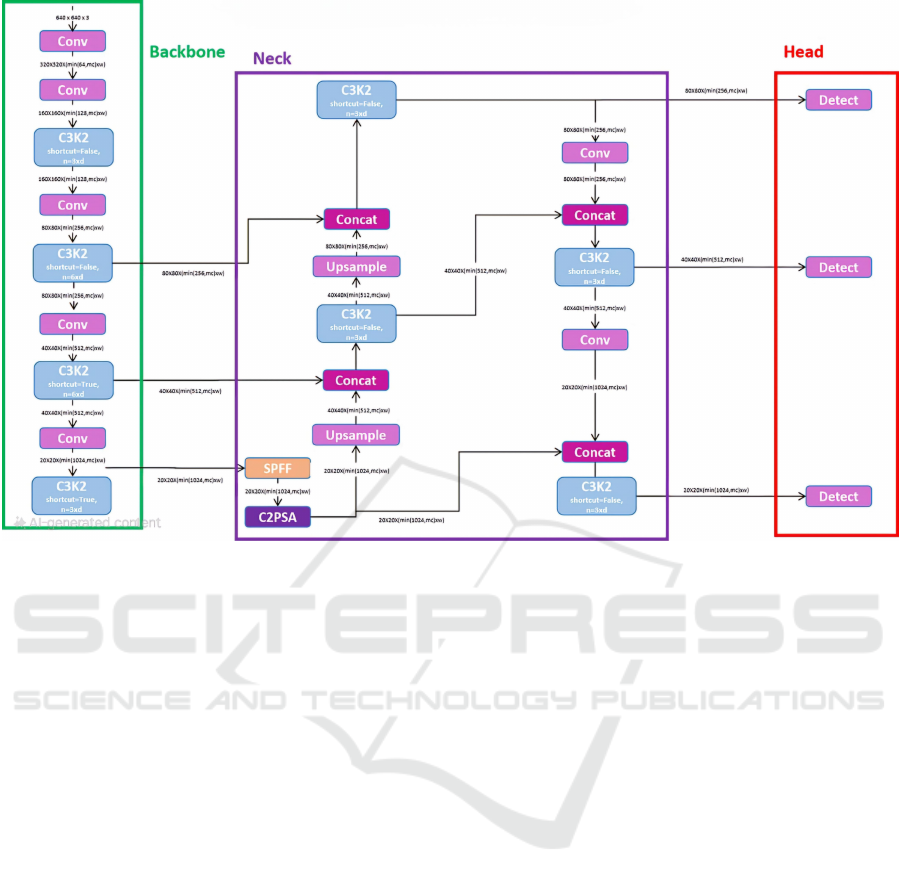
Figure 1: YOLO11 Architecture(Rao, 2023)
Attention Mechanism:
Position-Sensitive Attention: In order to improve
features extraction and processing using feed-forward
networks and position-sensitive attention (Zhu et al.,
2019), this class is capable of applying those with
the input tensors within themselves to process the at-
tention layer inputs at the input layer alone with the
outputs at the attention, concatenating both and send-
ing it through feed forward neural networks. This
then proceeds in completing the path through Conv
Block, Conv Block without activation, and finally
Conv Block output concatenated with that of the first
contact layer.
C2PSA: Inspired by the C2F (Watanabe, 1980)
block structure, the C2PSA block uses two PSA mod-
ules that operate on different branches of the feature
map concatenated together later on. This ensures that
the required balance is met between detection accu-
racy and cost while ensuring that the model has a con-
centration on spatial information. By manipulating
the features with spatial attention, the C2PSA block
puts the model into a more advantageous position to-
ward effectively focusing on those regions of interest.
This allows YOLO11 to perform better than its older
iterations like YOLOv8 when an object is required to
be detected with greater precision and detail.
3.2.3 Head
Like previous versions of YOLO, YOLO11 has a
multi-scale prediction head which is used to detect all
objects with varying sizes. The head will then take
features produced by the neck and backbone so that
detection boxes will be output at three different scales
that are low, medium, and high.
Typically, the detection head using three feature
maps, P3, P4, and P5, which are made by the dif-
ferent image granularities. This approach guarantees
that very large objects are captured using higher-level
features (P5), while smaller objects can be detected in
greater detail (P3).
3.3 Model Building
Model building includes training the model on the
dataset that we collected and split into training (4476
images) and testing (303 images) sets. The train-
ing set is used to train the YOLO11 model on vari-
ous kinds of images. The model will learn to detect
the vehicles accurately after the training process. A
threshold of 5 vehicles is set, if the number of vehi-
cles is more than the threshold, then it is classified
as heavy traffic, and if it is less than the threshold,
then it is considered light traffic, this is done using
the TrafficPred algorithm as shown in Algorithm 1.
INCOFT 2025 - International Conference on Futuristic Technology
338
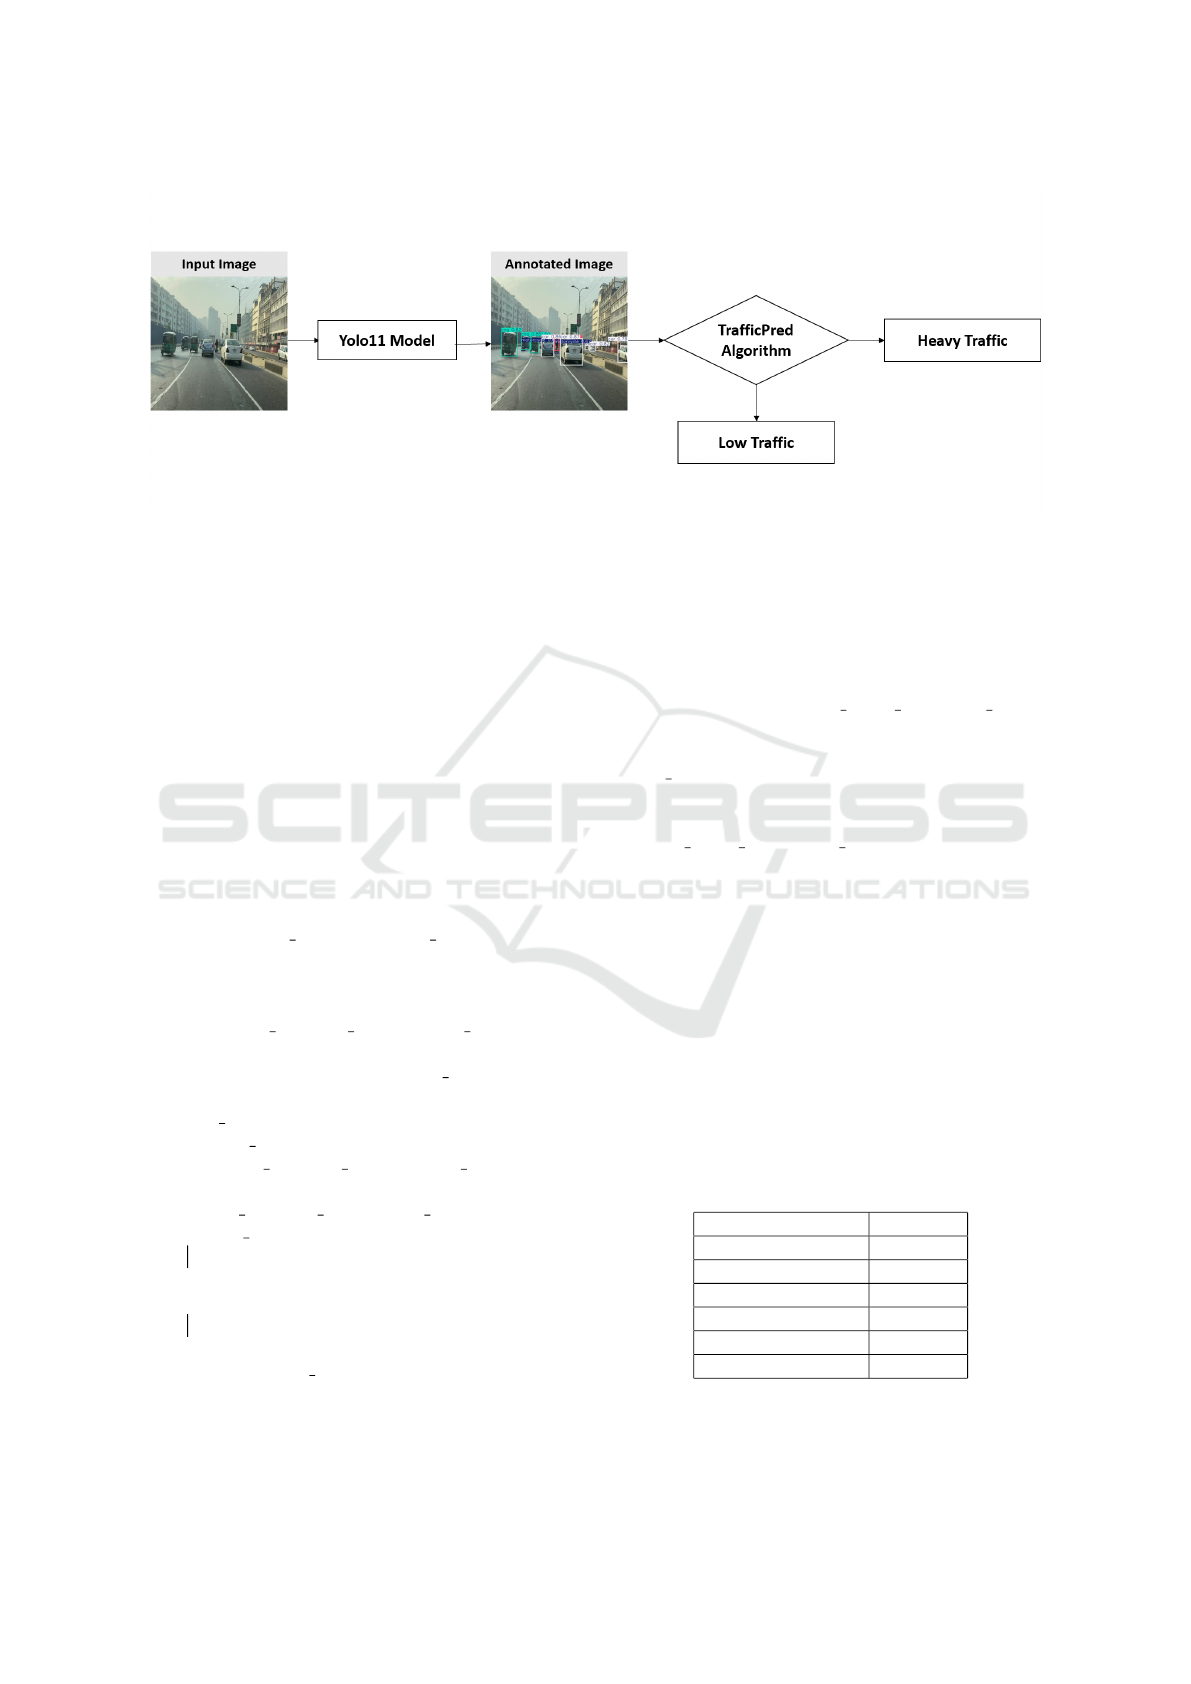
Figure 2: Proposed Pipeline Architecture
After the training process, the model can be tested on
unseen images to get the results based on the train-
ing achieved. The Fig.2 shows the Proposed Pipeline
Architecture for classifying a traffic level using the
TrafficPred Algorithm. The process begins with an
input image that is passed to the pre-trained object
recognition model, i.e., YOLO11 model. The image
is processed so that the model can produce an im-
age with annotations showing the objects that have
been detected surrounded by bounding boxes. This
image that has been annotated can then be fed to the
TrafficPred Algorithm, which basically works out the
number of bounding boxes detected in all the images
to identify the state of traffic.
Data: (image path) and (bbox threshold
= 5).
Result: "heavy" or "light"
Step 1:
evaluate traffic level(image path);
results ←
model.predict(source=image path,
show=True, save=True, conf=0.4) ;
bbox count ← len(results[0].boxes);
traffic level
← label traffic level (bbox count);
Step 2:
label traffic level(bbox count);
if bbox count > 5 then
return "heavy";
end
else
return "light";
end
return traffic level;
Algorithm 1: TrafficPred algorithm: Classifies traffic as
”heavy” or ”light” based on bounding box count.
Regarding the TrafficPred Algorithm as shown in
Algorithm 1, the crucial point of the code is to de-
termine whether the traffic is light or heavy based
upon the number of objects found in the image by
means of a pre-trained object detection model. Just
as a helper function label traffic level(bbox count)
is defined, the traffic level can be obtained by
comparing the number of detected bounding boxes
(bbox count) with a threshold over 5. If it ex-
ceeds 5, the traffic is classified as heavy other-
wise, it is classified as light. The major function,
evaluate traffic level(image path), evaluates the traf-
fic conditions by loading the input image and process-
ing the same on the object detection model to achieve
predictions. Hence, the results that include bounding
boxes among the factors will be analyzed to count the
detected objects, and the traffic level is determined af-
ter employing the helper function.
The training process uses several hyperparame-
ters, which have a direct influence on the speed, accu-
racy and convergence of the model. We set the num-
ber of epochs to 100 to help the model converge prop-
erly and get a high accuracy. The batch size was set
to 64 images, momentum was 0.9 and the weight de-
cay factor was 0.0005. All the hyperparameters are
summarized below in the Table 1.
Table 1: Hyperparameters for Model Training
Hyperparameters Values
Epochs 100
Batch Size 64
Image Size 640
Learning Rate 0.000833
Momentum 0.9
Weight Decay 0.0005
Traffic Flow Detection and Prediction Using YOLO11: A Threshold-Based Approach for Identifying Traffic Levels
339
3.4 Model Evaluation
Evaluating models must be done to validate the effec-
tiveness of the models. The following metrics were
considered in model evaluation-as indicated-below to
analyze speed, accuracy, and robustness: vehicle de-
tection by classes.
3.4.1 Mean Average Precision(mAP)
Mean Average Precision(mAP): The value of mean
average precision is derived from a mean of average
precisions over the different classes at multiple IoUs
from 0 to 1. Combined, this is a metric to evaluate all
object detection models.
mAP =
1
T
T
∑
t=1
Average Precision(AP) (1)
Where T is the total number of IoU thresholds and
AP is the value calculated at a specific IoU threshold
t.
3.4.2 Precision
Precision (Goutte and Gaussier, 2005) is numerically
defined as the quotient between the numbers of cor-
rectly detected objects and the total numbers of ob-
jects predicted. The higher the precision rate is, the
fewer objects it produces that are not itself correctly
detected-i.e. fewer false positives.
Precision =
TP
TP + FP
(2)
Where TP is True Positives which corresponds to
objects that are detected properly and FP is False Pos-
itives which corresponds to objects that are not de-
tected properly.
3.4.3 Recall
In this case, Recall (Yntema and Trask, 1963) is the
ratio of those detected objects over the total number
of objects contained by the dataset. The greater the
recall, the fewer objects are left overload.
Recall =
TP
TP + FN
(3)
Where TP is True Positives which corresponds
to objects that are detected properly and FN is
False Negatives which corresponds to objects that are
missed out.
3.4.4 F1 Score
The F1 score is a measure of precision and the recall
combined together in the harmonic mean. It is appro-
priate for situations where both precision and recall
must be factored into evaluation of the data, because
it produces one value reflective of those two factors.
F1 = 2 ·
Precision · Recall
Precision + Recall
(4)
3.5 Performance
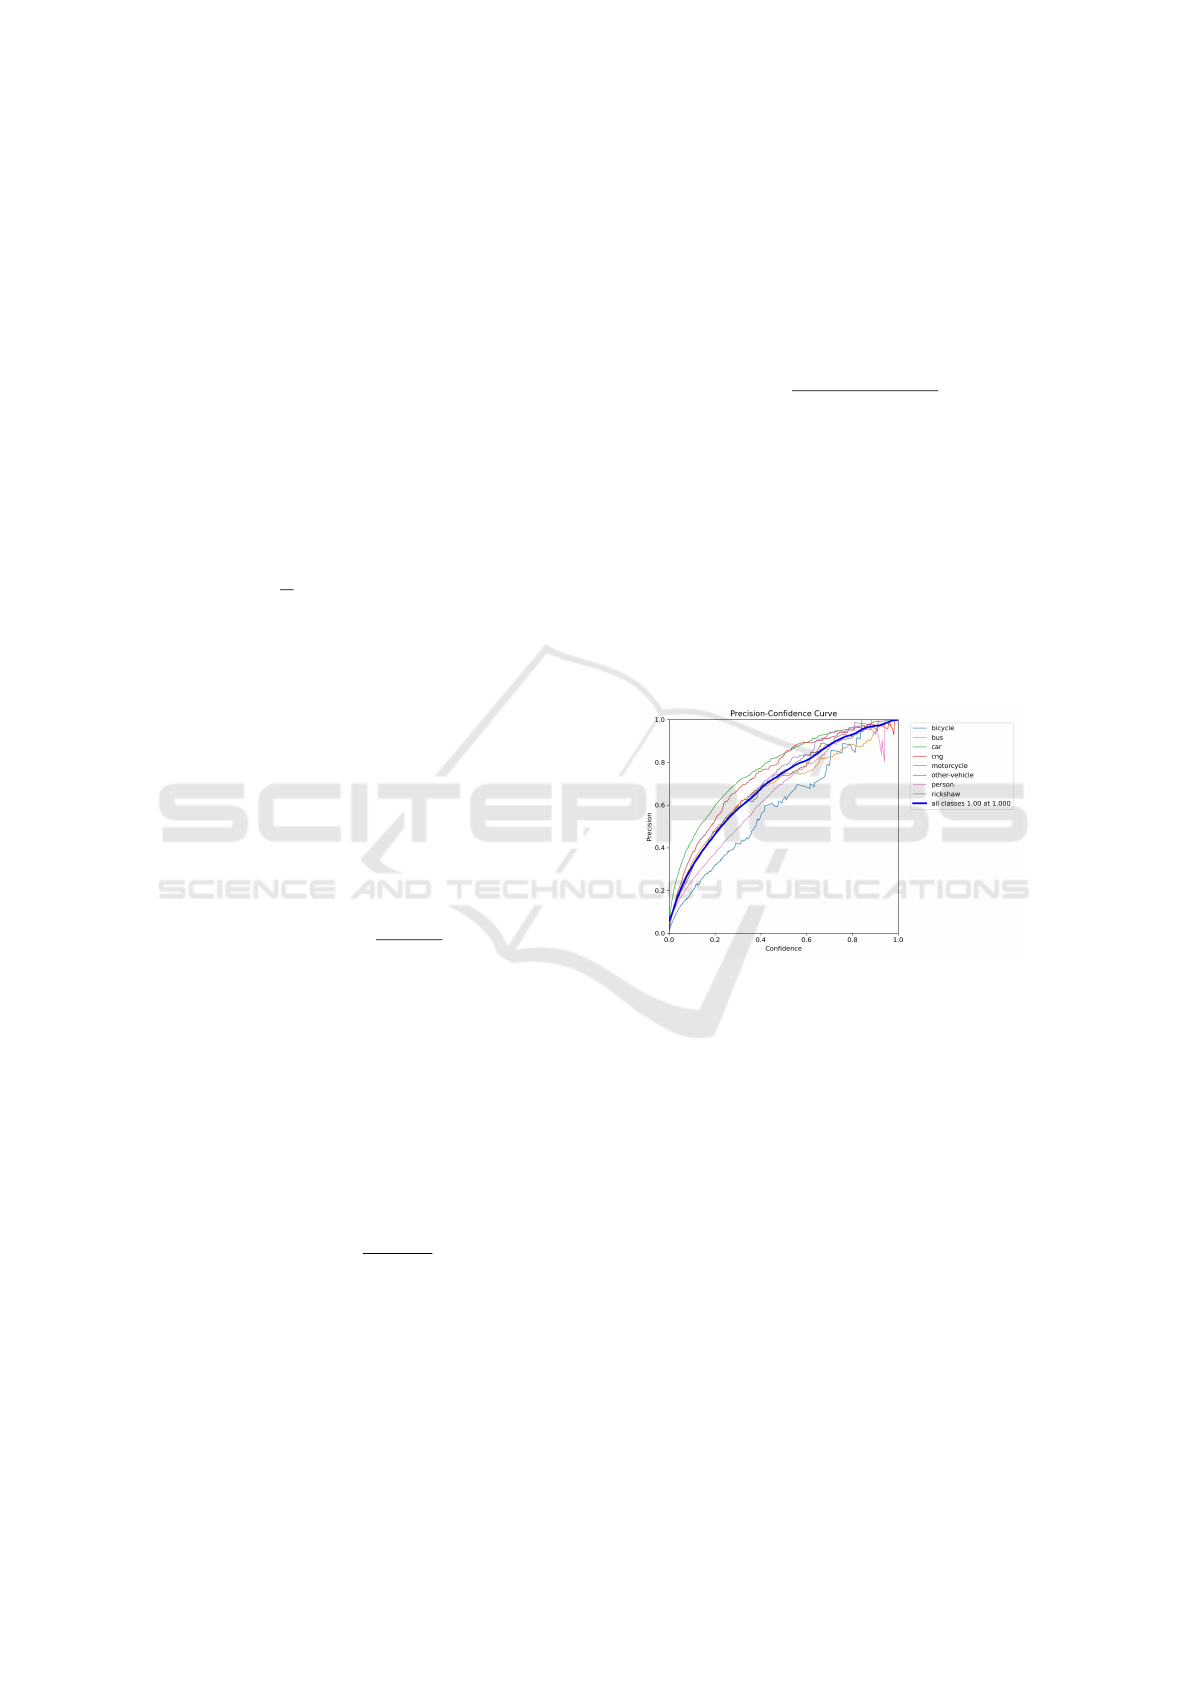
3.5.1 Precision-Confidence Curve
The precision-confidence curve is a graph which in-
dicates the performance for precision with respect to
confidence thresholds. The precision curve shows
how many of the positive predictions predicted to be
true actually are true. For most classes, as confidence
increases, precision increases; that is, a higher thresh-
old would yield fewer false positives at the threshold.
Figure 3: Precision-Confidence Curve which shows the
graphical relation between precision and confidence.
The graph highlights that the model has high pre-
cision on certain classes such as car and bus achieving
high precision as compared to others classes such as
bicycle.
3.5.2 Recall-Confidence Curve
A recall-confidence curve is defined as a graphical
representation of recall and confidence. It is useful
in maintaining the trend made in increasing the con-
fidence level in terms of effect on the recall of the
model. It indicates low recall at high confidence lev-
els, whereas it indicates contrary conditions at low
confidence levels.
The graph highlights that the classes like car and
bus have higher recall values at higher confidence lev-
els compared to bicycle, which dips more quickly.
INCOFT 2025 - International Conference on Futuristic Technology
340
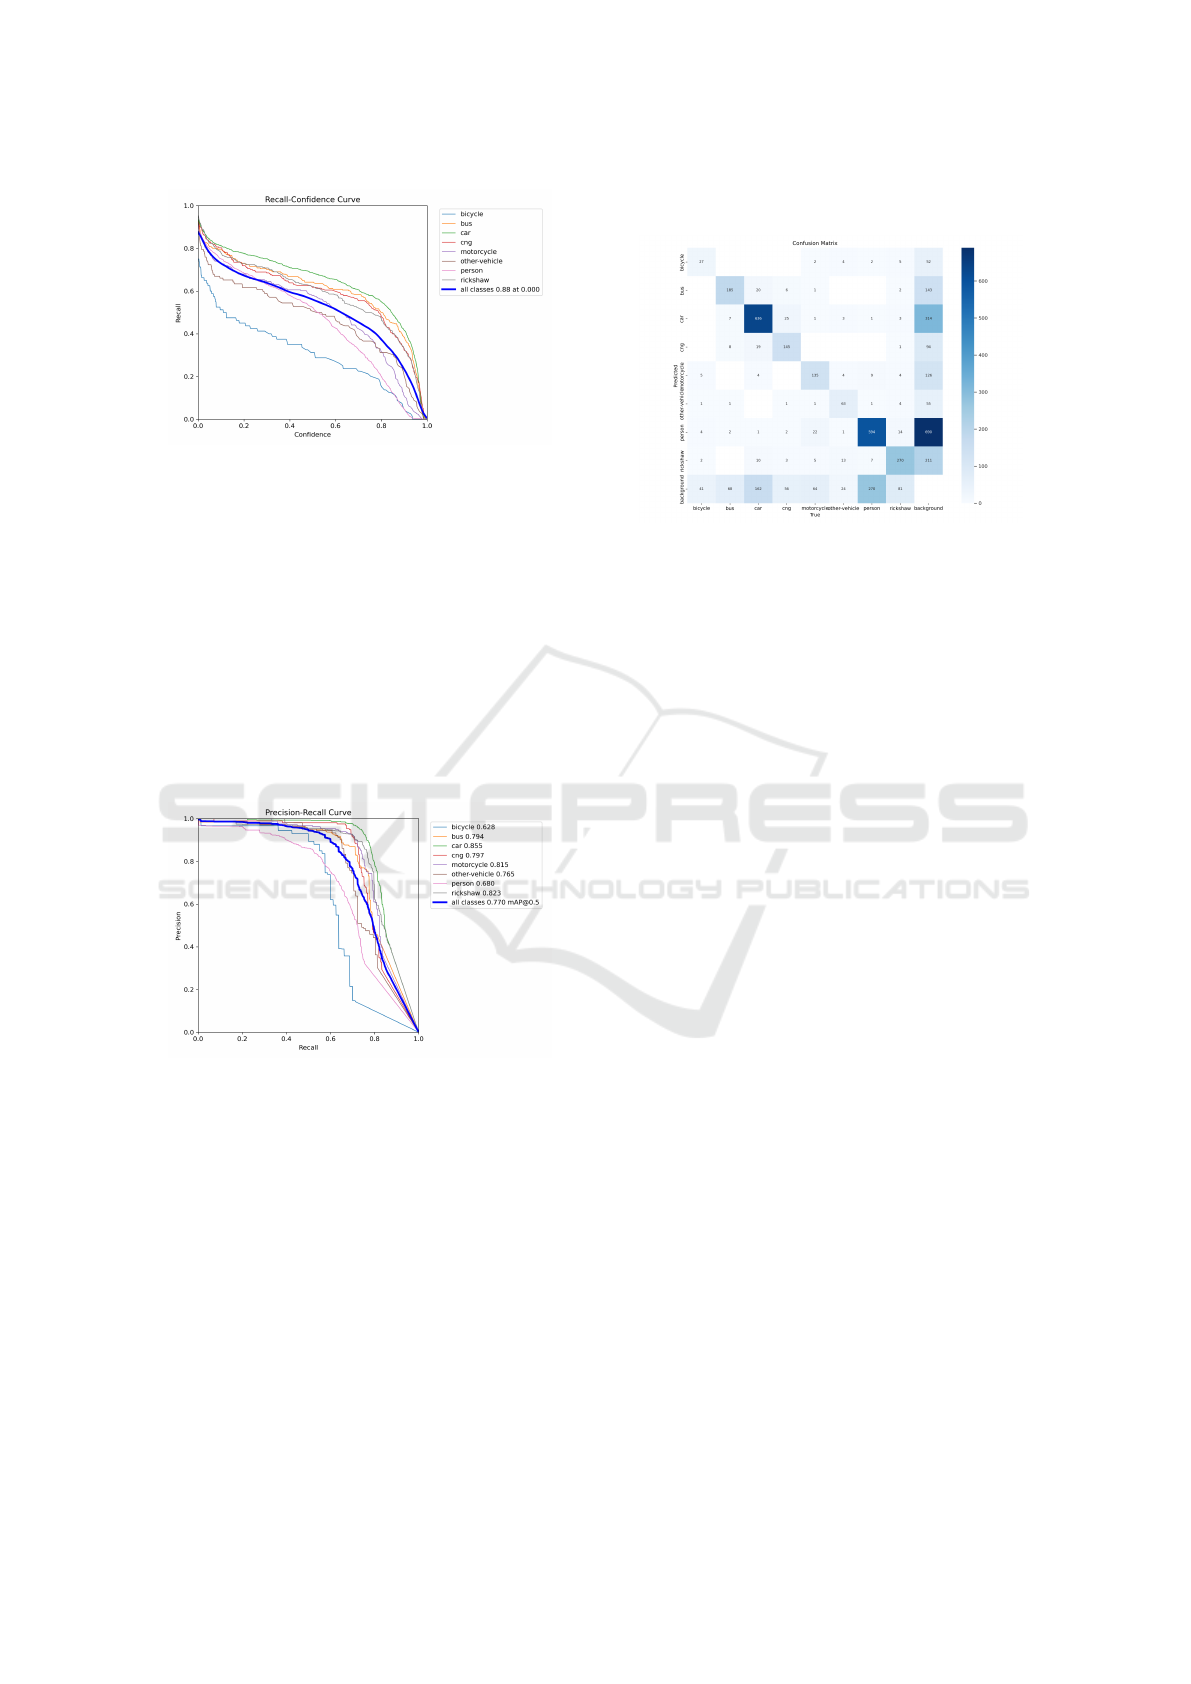
Figure 4: Recall-Confidence Curve which shows the graph-
ical relation between recall and confidence.
3.5.3 Precision-Recall Curve
Precision-recall curve graphically represents the re-
lation between precision and recall as a function of
different thresholds. A higher precision standing in
front of a lower recall means that less number of
false positives but still more number of false nega-
tives are counted against the model. On the other
hand, increased recall with lower precision will be
stated as there is a lesser number of false negatives
counted with a huge number of false positives (Davis
and Goadrich, 2006).
Figure 5: A precision recall curve is that it forms a graph
with the entire relationship between precision and recall
The graph highlights that the model performs well
on certain classes such as car and cng achieving high
AP scores while some others classes such as bicycle
have low AP.
3.5.4 Confusion Matrix
Confusion matrix is a tool for the evaluation of the
performance of a model, which gives detailed predic-
tion data of the model such as how well the model
performs in differentiating different classes (Salmon
et al., 2015). Rows are the predicted classes as
the columns are the original classes (true labels).ted
classes, and the columns correspond to the actual
classes (true labels).
Figure 6: Confusion matrix shows how well the classes are
predicted.
The diagonal cells represent correctly predicted
cases, where the predicted class and the ac-
tual class match. Off-diagonal cells represent
misclassifications-or cases where the predicted class
does not match the actual class. This confusion matrix
holds a precious insight of performance of the model
for each class, marking important strong points where
cars and persons are predicted with higher accuracy
and relatively weak areas measured with lower accu-
racy as for bicycles and rickshaws.
4 RESULTS
The study conducted an detailed comparison of
YOLOv8, YOLOv9, YOLOv10, and YOLO11 to
evaluate their performance in detecting and predicting
traffic flow across eight vehicle classes: Car, CNG,
Motorcycle, Bus, Rickshaw, Bicycle, Other-Vehicles,
and Person. YOLO11 demonstrated significant ad-
vancements over its predecessors in key metrics, in-
cluding precision, recall, (mAP) at an IoU threshold
of 0.5 (mAP@0.5), speed, and robustness. It achieved
the highest precision of 0.88, indicating fewer false
positives, and the highest recall of 0.85, reflecting
its ability to detect a greater proportion of objects
in the dataset. These improvements are crucial for
real-world traffic management systems, which require
high accuracy and reliability under diverse condi-
tions. YOLO11 also achieved a superior mAP@0.5 of
0.773, significantly outperforming YOLOv8 (0.632),
YOLOv9 (0.650), and YOLOv10 (0.714). This met-
ric highlights YOLO11’s ability to balance precision
and recall, ensuring consistent and dependable per-
formance across all vehicle classes. Its detection ca-
pabilities for smaller or less frequent objects like Bi-
cycles and Rickshaws were particularly notable, ad-
Traffic Flow Detection and Prediction Using YOLO11: A Threshold-Based Approach for Identifying Traffic Levels
341
dressing limitations seen in earlier versions. Visu-
alization tools like precision-recall curves and con-
fusion matrices further validated YOLO11’s perfor-
mance, confirming its reliability for practical deploy-
ments.
Table 2: Performance Comparison of YOLO Models for
Traffic Detection and Prediction
Model Precision Recall mAP@0.5
YOLOv8 0.78 0.75 0.632
YOLOv9 0.80 0.77 0.650
YOLOv10 0.84 0.81 0.714
YOLO11 0.88 0.85 0.773
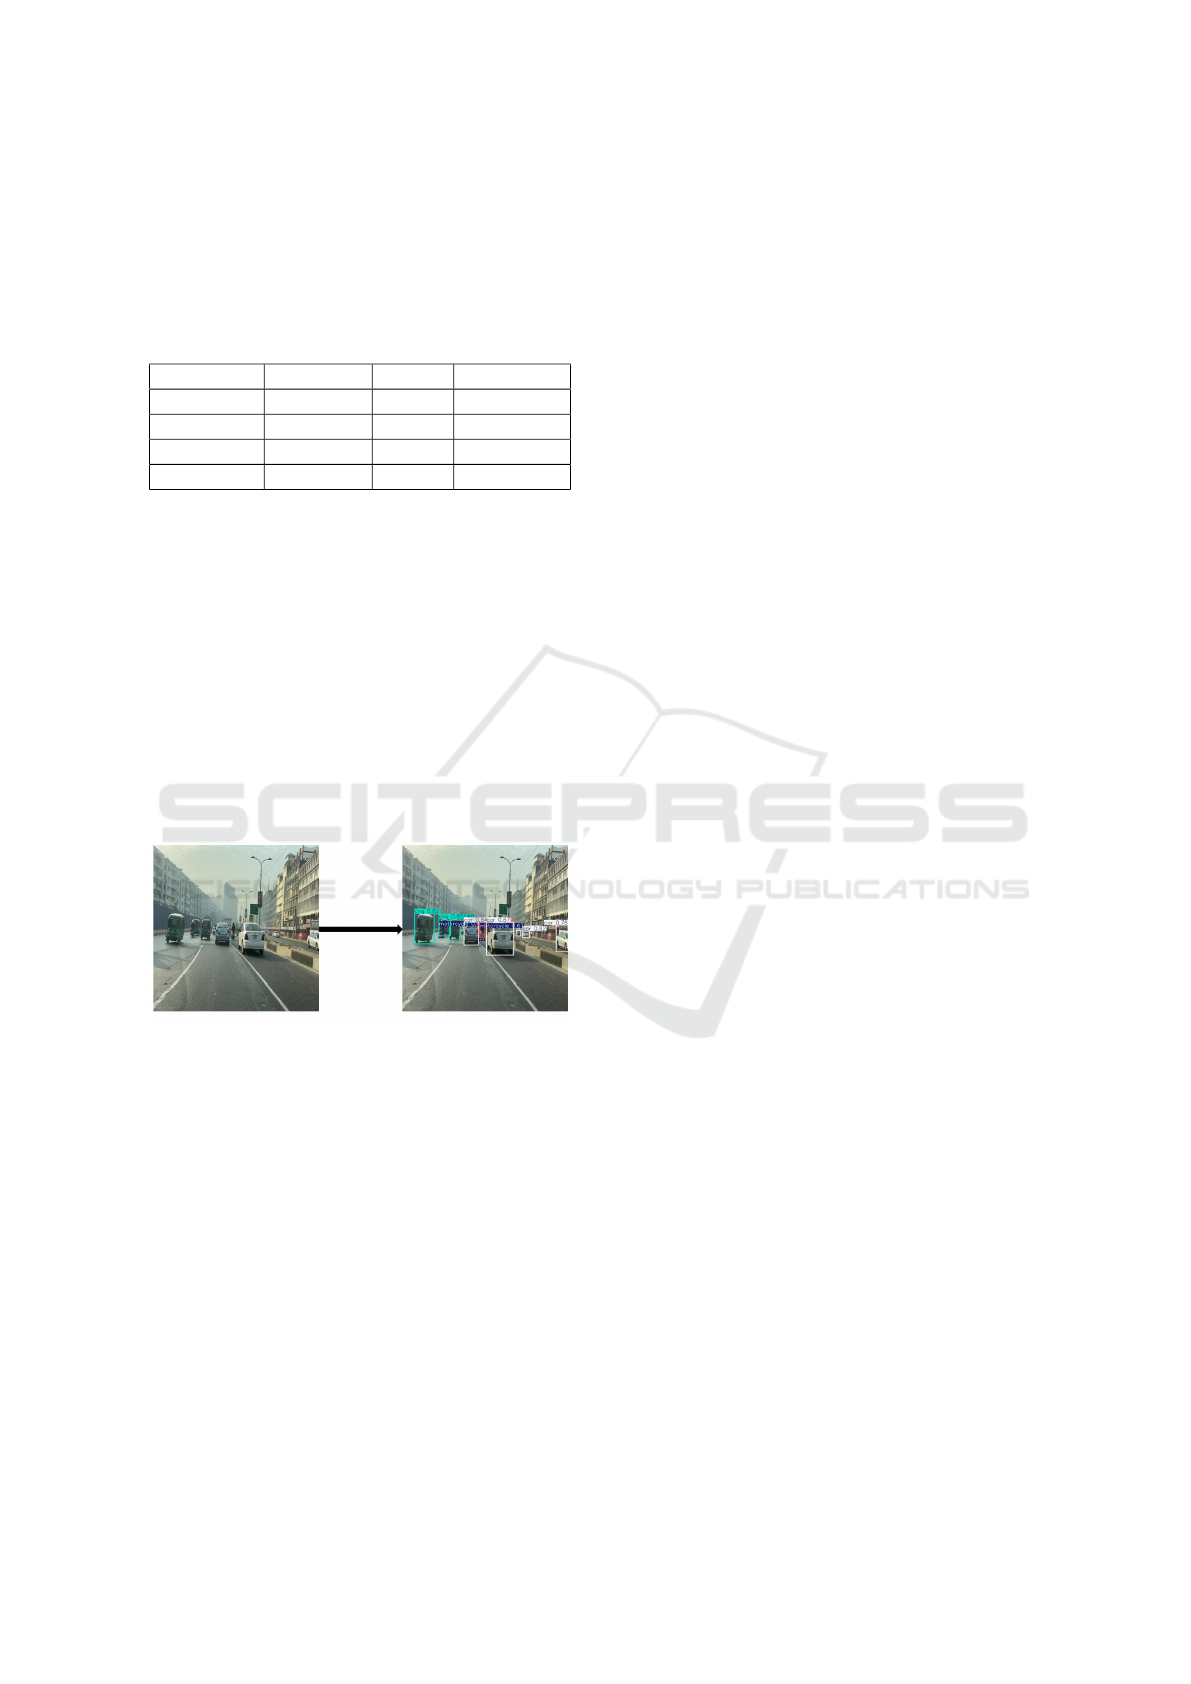
The performance of YOLO11 model on the traffic
dataset was evaluated to detect and classify objects
such as cars, motorcycles, and CNG vehicles. Fig.7
shows a sequence of two images in which the first im-
age is an example input image from the dataset, and
the second image shows the model’s output with de-
tected objects bounded by boxes. Each bounding box
is labeled with the predicted class and the correspond-
ing confidence score. The model successfully iden-
tified and differentiated between various traffic enti-
ties with high confidence, demonstrating its ability to
process urban traffic scenes effectively better then the
previous models.
Figure 7: The first image shows a image from our dataset
and the image following it shows the different vehicles de-
tected and also bounded.
5 CONCLUSION
This research developed a traffic flow detection and
prediction system using YOLO11, achieving high ac-
curacy and efficiency for real-time traffic monitoring.
The system uses a threshold-based method to classify
traffic as heavy or light. YOLO11’s advanced de-
sign, including features like the C3K2 block, SPPF
module, and attention mechanisms, played a key role
in improving YOLO11’s accuracy and adaptability in
complex scenarios, such as overlapping vehicles and
varying lighting conditions. These features helped
the system handle challenges such as crowded traffic,
poor lighting, and different environmental conditions
effectively. The model was thoroughly evaluated on
a dataset containing eight vehicle classes: Car, CNG,
Motorcycle, Bus, Rickshaw, Bicycle, Other-Vehicles,
and Person. YOLO11 achieved a precision of 0.88,
recall of 0.85, and an mAP@0.5 of 0.773, outper-
forming earlier YOLO versions such as YOLOv8,
YOLOv9, and YOLOv10. The system demonstrated
high precision and recall for frequently encountered
classes such as cars and buses, while effectively de-
tecting smaller or less frequent objects like bicycles.
Visualization tools, such as precision-recall curves
and confusion matrices, highlighted the model’s ro-
bust performance and ability to generalize across dif-
ferent scenarios.
This system also reduces the need for expensive
infrastructure, as it can be deployed on existing edge
devices such as traffic cameras. The ability to pro-
cess data locally allows for quicker decision-making
and reduces reliability on cloud services. By offering
accurate and immediate traffic predictions, this model
can improve traffic flow, reduce congestion, and en-
hance safety in urban areas. By combining vehicle
detection with traffic density prediction, this research
shows how powerful advanced models like YOLO11
can be for improving transportation systems. The re-
sults highlight its potential as a key technology for
creating smarter and more efficient smart cities.
6 FUTURE WORK
The use of YOLO11 in traffic flow detection and fore-
casting, together with potential future applications to-
wards more generalized ways of traffic management
for intelligent transportation systems, comprise the
majority of this work. Future advancements could in-
clude real-time analysis of continuous video streams,
the integration of other information sources like GPS
and weather, and more precise classification of traffic
types like moderate or severe congestion. A global
traffic database and accident detection will also be
useful additions to the model, which will optimize
performance on low-power edge devices. Lastly, the
development of an intuitive interface for real-time
data display would allow for more widespread practi-
cal use.
REFERENCES
Bin Zuraimi, M. A. and Kamaru Zaman, F. H. (2021). Vehi-
cle detection and tracking using yolo and deepsort. In
INCOFT 2025 - International Conference on Futuristic Technology
342

2021 IEEE 11th IEEE Symposium on Computer Ap-
plications & Industrial Electronics (ISCAIE), pages
23–29.
Chen, A. (2021). Data augmentation techniques. Journal of
Machine Learning, 12:123–130.
Davis, J. and Goadrich, M. (2006). The relationship be-
tween precision-recall and roc curves. In Proceed-
ings of the 23rd international conference on Machine
learning, pages 233–240.
Goutte, C. and Gaussier, E. (2005). A probabilistic interpre-
tation of precision, recall and f-score, with implication
for evaluation. In European conference on informa-
tion retrieval, pages 345–359. Springer.
Howard, A. (2018). Transfer learning for deep networks.
Deep Learning Journal, 9:89–95.
Jegham, N., Koh, C. Y., Abdelatti, M., and Hendawi,
A. (2024). Evaluating the evolution of yolo (you
only look once) models: A comprehensive benchmark
study of yolo11 and its predecessors.
Jocher, G. and Qiu, J. (2024). Ultralytics yolo11.
Khanam, R. and Hussain, M. (2024). Yolov11: An
overview of the key architectural enhancements.
Qureshi, K. N. and Abdullah, A. H. (2013). A survey on in-
telligent transportation systems. Middle-East Journal
of Scientific Research, 15(5):629–642.
Ranjitha, R., Ahuja, P., Shreeshayana, R., and Anil, D.
(2023). Edge intelligence for traffic flow detection: A
deep learning approach. In 2023 International Con-
ference on Quantum Technologies, Communications,
Computing, Hardware and Embedded Systems Secu-
rity (iQ-CCHESS), pages 1–6. IEEE.
Rao, N. (2023). Yolov11 explained: Next-level object de-
tection with enhanced speed and accuracy.
Salmon, B. P., Kleynhans, W., Schwegmann, C. P., and
Olivier, J. C. (2015). Proper comparison among meth-
ods using a confusion matrix. In 2015 IEEE Inter-
national geoscience and remote sensing symposium
(IGARSS), pages 3057–3060. IEEE.
Sohan, M., Sai Ram, T., Reddy, R., and Venkata, C. (2024).
A review on yolov8 and its advancements. In Interna-
tional Conference on Data Intelligence and Cognitive
Informatics, pages 529–545. Springer.
Su, G. and Shu, H. (2024). Traffic flow detection method
based on improved ssd algorithm for intelligent trans-
portation system. PLOS ONE, 19(3):e0300214.
Wang, A., Chen, H., Liu, L., Chen, K., Lin, Z., Han, J.,
and Ding, G. (2024). Yolov10: Real-time end-to-end
object detection. arXiv preprint arXiv:2405.14458.
Wang, C.-Y., Yeh, I.-H., and Mark Liao, H.-Y. (2025).
Yolov9: Learning what you want to learn using pro-
grammable gradient information. In European Con-
ference on Computer Vision, pages 1–21. Springer.
Wang, S., Yu, D., Ma, X., and Xing, X. (2018). Analyzing
urban traffic demand distribution and the correlation
between traffic flow and the built environment based
on detector data and pois. European Transport Re-
search Review, 10:1–17.
Watanabe, N. (1980). Two types of graphite fluorides,(cf)
n and (c2f) n, and discharge characteristics and mech-
anisms of electrodes of (cf) n and (c2f) n in lithium
batteries. Solid State Ionics, 1(1-2):87–110.
Woo, S., Park, J., Lee, J.-Y., and Kweon, I. S. (2018). Cbam:
Convolutional block attention module. In Proceed-
ings of the European conference on computer vision
(ECCV), pages 3–19.
Yang, Z. and Jerath, K. (2024). Energy-guided data sam-
pling for traffic prediction with mini training datasets.
Yntema, D. B. and Trask, F. P. (1963). Recall as a search
process. Journal of Verbal Learning and Verbal Be-
havior, 2(1):65–74.
Zhang, C. and Gu, S. (2023). Fish object detection
based on spatial bias pyramid pooling: Improved bias-
yolo. In 2023 8th International Conference on Intelli-
gent Computing and Signal Processing (ICSP), pages
1976–1979. IEEE.
Zhiqiang, W. and Jun, L. (2017). A review of object de-
tection based on convolutional neural network. In
2017 36th Chinese control conference (CCC), pages
11104–11109. IEEE.
Zhu, X., Cheng, D., Zhang, Z., Lin, S., and Dai, J. (2019).
An empirical study of spatial attention mechanisms in
deep networks. In Proceedings of the IEEE/CVF inter-
national conference on computer vision, pages 6688–
6697.
Traffic Flow Detection and Prediction Using YOLO11: A Threshold-Based Approach for Identifying Traffic Levels
343
