
Explainable AI Framework for Precise and Trustworthy Skin Cancer
Diagnosis
Vandana Kate
a
, Arohi Kate, Chanchal Bansal, Charu Pancholi and Ashvini Patidar
Department of CSIT, Acropolis Institute of Technology and Research, MP, India
Keywords:
Skin Cancer, Explainable AI (XAI), Deep Learning, Inception-ResNet V2, Grad-CAM, Clinical Decision
Support, Skin Lesion Classification, Non-Invasive Diagnosis.
Abstract:
Skin cancer, most especially melanoma, is a recognized health issue across the world and its management
depends on early and correct diagnosis.Conventional methods like biopsies are relatively precise and reliable
but they are time consuming and invasive and may cause either an infection or an outbreak. Non-invasive
procedures such as dermoscopy depend on the knowledge of the physician, which can cause variability and
randomness. To address these challenges, we propose an explainable AI (XAI) framework for precise and
trustworthy skin cancer diagnosis. Our model integrates VGG16, InceptionV3, Inception-ResNet V2 and
DenseNet-201 deep learning architectures fine-tuned on the HAM10000 benchmark dataset to distinguish skin
lesions as benign or malignant. To ensure transparency and trust in the model’s predictions, we incorporate
cutting-edge explainability techniques, including LIME (Local Interpretable Model-agnostic Explanations),
SHAP (SHapley Additive exPlanations) and gradient-based methods like Grad-CAM. These tools highlight
key image features and regions that influence model decisions. This proposed work deepens the knowledge in
the field of using AI in the diagnosis of skin cancer and paves the way for integrating explainability into AI
healthcare systems, improving accuracy and user trust.
1 INTRODUCTION
Skin Carcinoma is one of the most commonly diag-
nosed and eventually fatal types of cancer that con-
tinuously on the rise all over the world. Although
deep learning models for more complex layers are, in
fact, highly accurate for diagnosing skin cancer, clin-
icians often struggle to understand how models draw
their conclusions, which is a major drawback of popu-
lar AI systems and existing approaches to skin cancer
diagnosis (P. Linardatos and Kotsiantis, 2020),(Wang
et al., 2021). To address this challenge, Explainable
AI (XAI) approaches have been developed, which can
be categorized as follows:
1.1 Function Based Approach
This approach focuses on understanding the inner
workings of the model, such as its number of lay-
ers, parameters, and hyperparameters. Both saliency
maps and feature importance are simple procedures
a
https://orcid.org/0000-0002-2281-2187
that explain how features affect the output of a model.
An example is Grad-CAM (Gradient-weighted Class
Activation Mapping), which helps in visualizing
which of the areas in an image contributes to a
model’s decision.
1.2 Result Based Approach
This approach gives explanations for specific predic-
tions based on approximations of the complex model
with models that are easier to understand. Techniques
like LIME (Local Interpretable Model-agnostic Ex-
planations) and SHAP (SHapley Additive exPlana-
tions) are popular for breaking down individual pre-
dictions, offering insights into which features con-
tributed to the outcome. For instance, LIME can be
used to explain predictions in text classification tasks
by generating interpretable models around a specific
instance (K. Aas and Løland, 2021).
260
Kate, V., Kate, A., Bansal, C., Pancholi, C. and Patidar, A.
Explainable AI Framework for Precise and Trustworthy Skin Cancer Diagnosis.
DOI: 10.5220/0013590500004664
Paper published under CC license (CC BY-NC-ND 4.0)
In Proceedings of the 3rd International Conference on Futuristic Technology (INCOFT 2025) - Volume 2, pages 260-267
ISBN: 978-989-758-763-4
Proceedings Copyright © 2025 by SCITEPRESS – Science and Technology Publications, Lda.
1.3 Conceptual Based Approach
This approach looks forward to providing human in-
terpretable representation based on high-level fea-
tures or domain knowledge. For instance, the con-
ceptual explanation in medical imaging can be best
illustrated by the ability to depict images that contain
”tumor-like” structures or ”abnormal patterns”. This
type of explanation is the most helpful in fields where
domain knowledge is highly important.
1.4 Mixed Approach
The mixed approach combines elements from the
above approaches to provide a comprehensive expla-
nation. Using function-based, result-based, and con-
ceptual explanations, this approach provides a better
understanding of the choice of model decisions. For
example, in complex tasks such as medical diagnosis,
a mixed approach might combine Grad-CAM visual-
izations with LIME-based feature importance scores,
making the behavior of the model more comprehensi-
ble and understandable to the human audience (Lund-
berg, 2017). Such approaches assist in explaining and
verifying mainly used AI solutions in such critical ar-
eas such as medicine and self autonomous systems.
The proposed work aims to expand the horizons of
health care, utilizing current standard methodologies
such as SHAP, LIME, and Grad-CAM while perform-
ing layer-wise analysis to assess and interpret CNN
model decisions for skin cancer diagnosis. The goal
is to make the decision process clearer to understand
and easier to control since it provides quantitative and
qualitative data of how each pixel or region impacts
the decision making of the developed model.
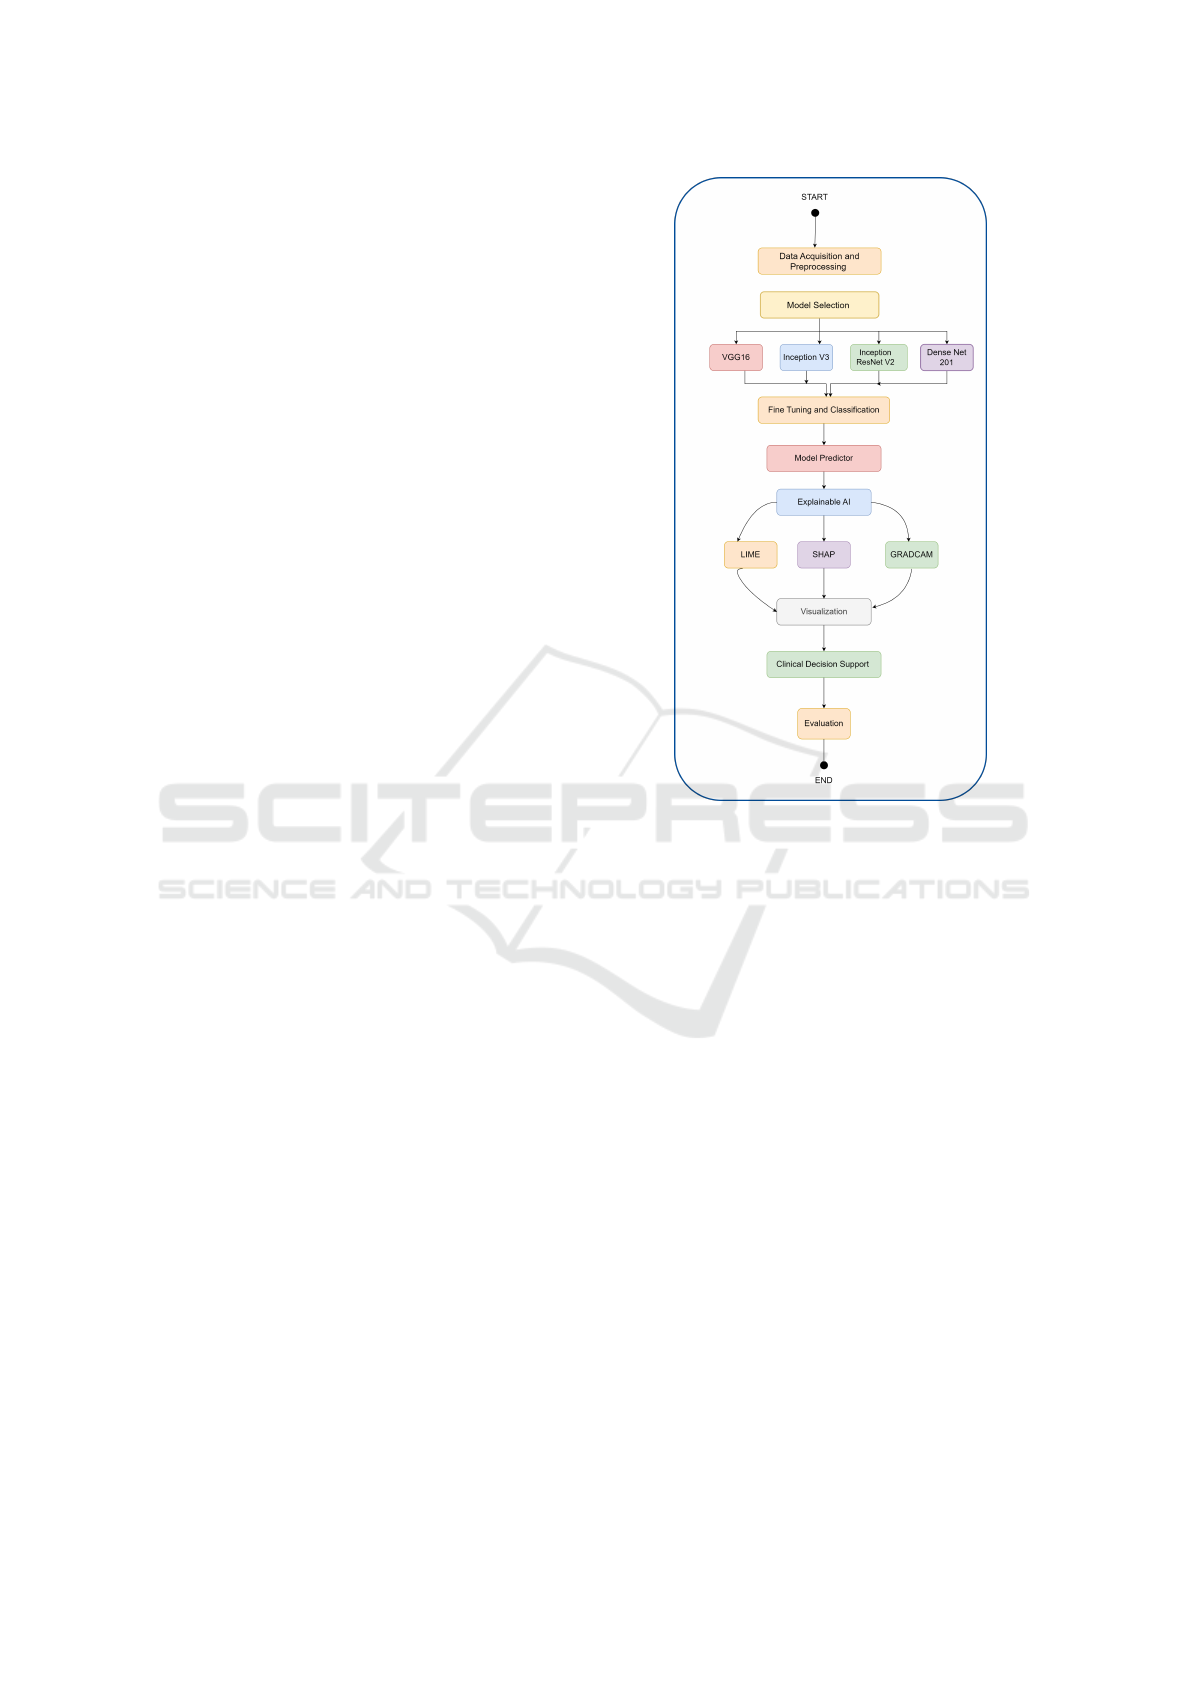
1.5 Objectives
The schematic diagram of the proposed approach is
shown in figure 1 with various objectives as follows.
i. Perform an exploration of diverse interpretabil-
ity techniques and compare and contrast them ac-
cording to their suitability to explain CNN deci-
sions.
ii. Incorporate layer-wise analysis in the propagation
of information through the network in an effort to
isolate the level of participation of every layer in
the final result of the model.
iii. Promote the interpretation of mammography di-
agnostic results in order to improve the level of
trust of physicians and patients.
Figure 1: Schematic Diagram of the Proposed Model
2 RELATED WORKS OF XAI ON
DIFFERENT APPLICATION
DOMAINS
Partial Dependence (PD) plots are criticized for
failing when it comes to interpreting black-box mod-
els with correlated predictors, which is why (Apley
and Zhu, 2020) presented the Accumulated Local Ef-
fects (ALE) plots as more robust and less time- con-
suming. ALE plots do not exhibit extrapolation prob-
lems and are suggested as a standard tool for inter-
pretability in supervised learning.
Machine learning models including SVM, DNN, and
Random Forest were used by (P. Jain and Jain, 2024)
to predict PCOS with 97% accuracy and used the two
XAI strategies, namely LIME and SHAP to analyze
key determinants of the disorder.
A recent study conducted by (K. Wei and Chen,
2022) implemented XAI in agricultural classifica-
tion through the deep learning models of VGG,
GoogLeNet, ResNet, in the fruit leaves dataset.
During training the ResNet model, an accuracy of
(99.11%, 99.4%, 99.89%) was achieved, and the at-
tention module improved feature extraction from the
input images and provided information about what as-
Explainable AI Framework for Precise and Trustworthy Skin Cancer Diagnosis
261

pect of the image the model is focusing on while clas-
sifying.
(H. Naeem and Ullah, 2022) proposed an AI-based
explainable approach for malware detection using IoT
devices using a fine-tuned Inception-v3 CNN model
with transfer learning. By using color image malware
display of Android Dalvik Executable File (DEX),
the model achieved 98.5% accuracy in binary classi-
fication and 91% in multiclass prediction, surpassing
other methods in various evaluation metrics.
(Molle et al., 2018) represented the dermatology case,
where they observed that CNNs inspect features that
are similar to those examined by dermatologists for
skin lesions; however, more analysis is required for
the interpretation of convolutional neural networks.
(J. M. Rozanec and Mladenic, 2022) proposed a
Knowledge Graph-based XAI architecture that is used
for demand forecasting with confidential high-level
explanations and actions based on domain knowledge
while preserving sensitive model details.
Four attribution methods were evaluated by (F. Ei-
tel and the Alzheimer’s Disease Neuroimaging Initia-
tive (ADNI), 2019) for CNN-based Alzheimer’s clas-
sification based on MRI data. It also clearly indicated
that there are large fluctuations, while guided back-
propagation and LRP yielded the most consistent val-
ues; so, it is necessary to use domain-specific criteria
instead of a visual assessment of the maps.
(S. Pereira and Silva, 2018) introduced the idea of em-
ploying CNNs to detect the grade of glioma solely
based on MRI data, thus avoiding the need for a
biopsy. They assessed prognosis using whole brain
and automatic tumor areas and used interpretability
methods to guide the models to concentrate on the re-
gions that are indicative of tumor grade.
(Mehta and Passi, 2022) used XAI for hate speech
detection including pre-processing and exploratory
analysis of datasets. LSTM achieved an accu-
racy of 97.6% on the Google Jigsaw dataset, while
BERT variants (BERT + ANN: 93.55%, BERT +
MLP: 93.67%) were evaluated for explainability us-
ing LIME and the ERASER (Evaluating Rationales
and Saliency for Explanations in Reasoning) meth-
ods.
(S. Y. Lim and Lee, 2022) extended the XAI tech-
niques of image classification to deepfake audio de-
tection, providing an understanding of interpretability
and explanation of model decisions involving varia-
tions of pitch and rhythm. The findings emphasized
that the interpretability was consistent across environ-
ments and noted its divergence between human and
model perceptions provided information to respond to
the emerging problem of generative fake media.
(Kim and Joe, 2022) proposed an XAI approach for
deep learning self-driving car models that maps image
regions that have significant impacts on CNN deci-
sion making using sensitivity analysis. This increases
reliability in conjunction with the application of the
devices.
LSTM, Bi-LSTM, and Bi-GRU-LSTM-CNN mod-
els were employed by (A. Adak and Alamri, 2022)
for sentiment analysis of FDS reviews with accuracy
rates equal to 96.07%, 95.85%, and 96.33%, corre-
spondingly. LSTM was chosen for false negatives as
they are lower compared to the other. The two XAI
methods that we used were SHAP and LIME; which
provided explanations by isolating the words most in-
fluential to the sentiment of the models.
3 DATASET- SKIN CANCER
MNIST (HAM10000)
The HAM10000 dataset (HAM, ) contains more
than 10,000 dermatoscopic images of skin lesions,
mainly melamonous to diagnose and categorize skin
cancer. The dataset has seven different classes,
namely: Melanocytic nevi, Melanoma, Benign ker-
atosis similar lesions, Basal cell carcinoma, Actinic
keratoses, Vascular lesions, and Dermatofibroma.
This data set is relatively difficult in the development
of models due to its applicability, especially due to
the high imbalance of classes. In this regard, it plays
a vital reference for a more accurate diagnosis of less
common but potentially serious skin diseases.
4 DEEP CONVOLUTIONAL
NEURAL NETWORKS (CNN)
FOR IMAGE CLASSIFICATION
Deep CNNs are a well established deep learning
architecture most applicable to image classification
problems. Due to their capacity to learn about hier-
archical features of items, Convolution Neural Net-
works are particularly useful in the skin cancer image
classification task. In the initial layers model works
with simple features or basic or low-level features
such as edges or shapes, and as one passes through
the network, the high-level or more abstract features
are extracted in the latter layers and then the network
is able to differentiate between the different types of
skin cancer lesions.
INCOFT 2025 - International Conference on Futuristic Technology
262
4.1 Experimental Setup: Baseline and
Pre-trained Models
The work proposed here incorporates both the base-
line CNN and fine-tuned pre-trained deep models as
described below:
1. Baseline CNN: This model acts as a benchmark
for comparison. It uses only three convolution and
pooling layers and has a basic structure in order to
create a base for future models.
2. Fine-tuned Pretrained Models: Four pre-trained
models – VGG16, Inception V3, Inception
ResNet V2 and DenseNet 201, were applied to
the HAM10000 skin cancer data set. These
models were initially trained on a huge dataset
like ImageNet, allowing them to extract/learn
generic image features. The higher layers of
these modnd.els were fine-tuned to the special-
ized task of skin lesion segmentation based on the
HAM10000 dataset. This approach takes advan-
tage of the existing knowledge of the pre-trained
models but modifies them according to the classi-
fication problem at hand. Various models used are
briefly described below-
• VGG16: A well-known pre-trained deep
model with a hierarchical convolutional pool-
ing architecture. It is composed of five con-
volutional blocks, where third, fourth, and fifth
blocks have four convolutional layers. This ar-
chitecture enables the model to capture increas-
ingly complicated features, making it highly ef-
fective for image classification tasks.
• Inception V3: This top ImageNet model uti-
lizes ”Inception modules” to efficiently extract
features. Specifically, it is a computationally
efficient and effective framework for feature ex-
traction.
• Inception ResNet V2: The model is based on
Inception V3 and combines residual connec-
tions to enable deeper networks training. In-
ception ResNet V2 also minimizes some possi-
ble issues of Batch Normalization.
• DenseNet 201: This model comprises four
”dense blocks”, where each block generates
feature maps through a series of operations
(batch normalization, ReLU, and a 3x3 con-
volution). The layers between dense block are
called transition layers which consist of convo-
lution and pooling layers.
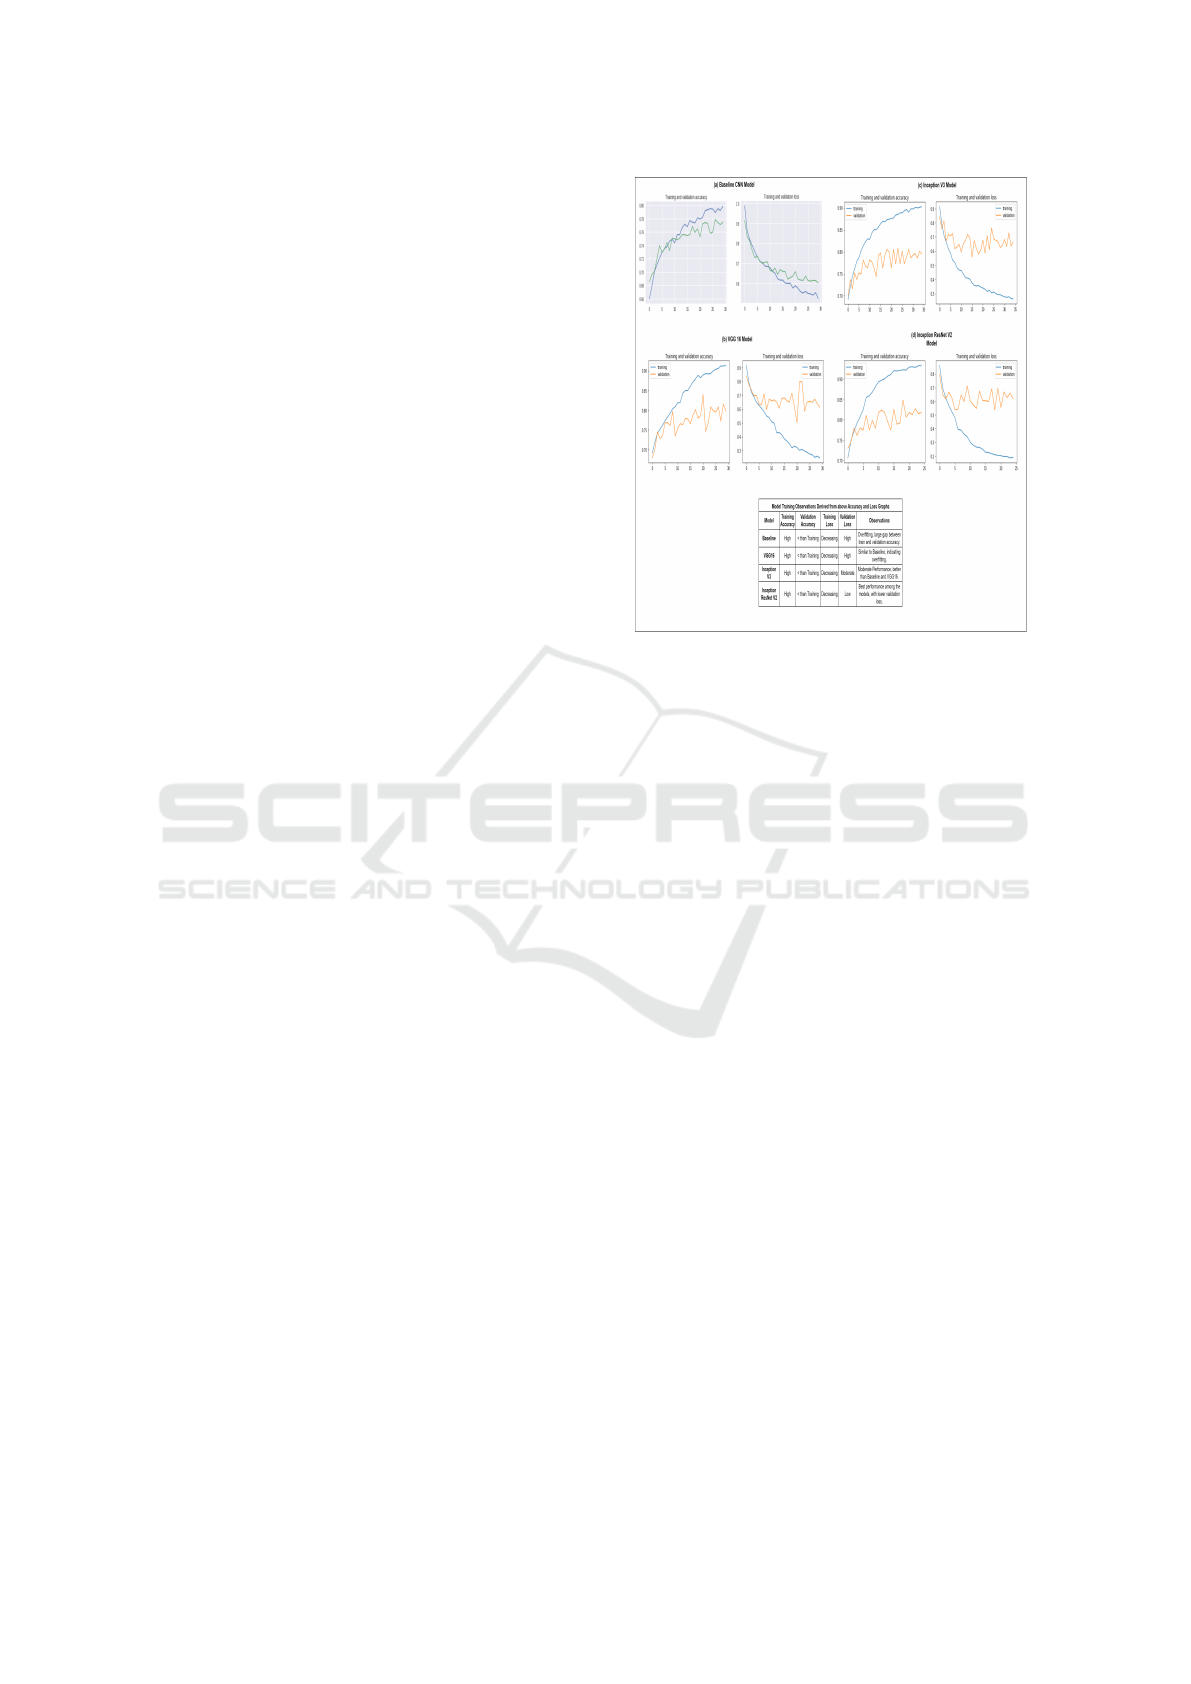
The figure 2 illustrates the training and validation ac-
curacy and loss graphs for the above four models, pro-
viding a tabular summarization of various model per-
formance during training.
Figure 2: Model Training Performance
5 EXPLAINABLE MACHINE
LEARNING
Healthcare AI is still struggling mainly because
it is hard to integrate something you cannot fully
explain with AI-made decisions that require pa-
tient trust, model interpretability, and feedback for
accurate and reliable results. In response to these
challenges, most of the proposed works make use
of CAM (Class Activation Mapping) methods that
identify the areas in an image that a model uses to
classify a given class, hence improving interactivity.
Some CAM techniques (Zhou et al., 2015) also
employ Global Average Pooling (GAP) or Global
Max Pooling (GMP) to preserve spatial structures and
detect discriminative areas, which improves decision-
making and reliability in the healthcare domain.
Although GMP analyzes the most significant section
of an object, GAP can learn about and pinpoint the
presence of a complete object. GAP helps better
understand by including all discriminative factors
in consideration. GAP considers all discriminative
parts, ensuring a more comprehensive understanding.
Therefore, GAP has higher accuracy than GMP
in localization problems and is recommended for
precise spatial localization in AI-based healthcare
decision support systems.
Subsequent sections of this paper demonstrate the
experiments performed with the help of explanatory
methods such as LIME, SHAP, and Grad-CAM to
analyze the outcomes provided by deep learning
regarding the classification of skin cancer. These
methods help to explain the model to justify the
Explainable AI Framework for Precise and Trustworthy Skin Cancer Diagnosis
263

kind of decision it made by pointing out features or
regions in the input images that contribute mostly
to the prediction and thus adds to reliability of the
model.
6 LIME (LOCAL
INTERPRETABLE
MODEL-AGNOSTIC
EXPLANATIONS) FOR
EXPLAINING SKIN CANCER
IMAGE INTERPRETATION
As experimented with skin cancer images, the
LIME algorithm 1 offers a way to recognize which
areas of an image are important for model decision. It
does so by applying some transformations/perturba-
tions to the input image (for example, deleting some
superpixels) and comparing the changes to the out-
put. LIME then fits a simple linear model – or Deci-
sion Tree – to mimic the behavior of the complicated
deep model in the surroundings of the original image.
Since this linear model involves learning coefficients,
the super-pixels that have big contributions towards a
prediction can be pinpointed, and how the model is
making decisions can be revealed by overlaying the
heat-map on the original image. Heatmap is a graphi-
cal data analysis tool in which data values are encoded
as colors. It is popular for displaying the density of
values on a matrix or a grid, where each cell will rep-
resent the value of the data point it contains.
Algorithm 1 LIME Algorithm for Skin Cancer Image
Predictions
Complex model M, skin lesion image I, predicted output
class y = argmax M(I). Feature importance and heatmap
visualization.
Step 1: Segment Image
Divide I into k superpixels {S
1
, S
2
, . . . , S
k
}.
Step 2: Generate Perturbed Images
Create perturbed images by masking superpixels.
Step 3: Get Predictions
Pass each perturbed image through M to obtain predictions.
Step 4: Compute Weights
Compute similarity between I and perturbed images. As-
sign weights based on the similarity.
Step 5: Train Model
Fit a weighted linear regression model on the perturbed im-
ages.
Step 6: Create Heatmap
Assign model coefficients to superpixels. Visualize the
heatmap highlighting regions influencing the prediction.
Figure 3: Visualizing Heatmaps for LIME
The image in figure 3 illustrates how different
segments (superpixels) of an image contribute to the
whole through the use of color. A positive coefficient
value means that it has a direct proportional relation-
ship with the prediction of the model, and regions that
include brighter colors (like yellow) have a high pos-
itive coefficient. However, the negative coefficients
are associated with the darker color, particularly the
purple color to represent areas where it has a reduc-
ing impact on the confidence of the model. The right
side of the figure presents a color bar that might help
us to understand the values of the coefficients. Based
on the intensity of the color depicted on the heatmap,
the areas are delineated, which are most important for
decision making in the chosen model with reference
to the image.
7 SHAP ALGORITHM FOR SKIN
CANCER IMAGE
INTERPRETATION
SHAP (SHapley Additive exPlanations) values act
as unified/global measure in that they provide a mea-
sure of how each feature contributes progressively to
the model prediction across the given dataset. This
theory comes from game theory, where there is an
analysis of how each individual contributes differ-
ently to the team’s outcome. Likewise, SHAP values
explain how much each feature plays in the predic-
tion of the model, giving an equal chance for each
feature to contribute positively or negatively to the
model across all permutations of features in a dataset
as illustrated in algorithm 2. The color map on the
right-hand side of figure 4 indicates the SHAP val-
ues. The blue regions correspond to negative SHAP
values, while the red regions indicate positive SHAP
values. The SHAP values are overlaid on the origi-
nal image, highlighting the most important regions to
make the prediction.
Label: 1.0 corresponds to a malignant lesion with
a probability of 56% malignancy. The SHAP visu-
alization data reveal the fact that the model concen-
INCOFT 2025 - International Conference on Futuristic Technology
264
Algorithm 2 SHAP Algorithm for Skin Cancer Image
Predictions
Complex model M, skin lesion image I, background dataset
D. SHAP values for each pixel of I and visualization.
Step 1: Background Data
Choose representative background images D =
{I
1
, I
2
, . . . , I
m
}.
Step 2: Perturb Features
Divide I into k superpixels {S
1
, S
2
, . . . , S
k
}.
Apply random binary masks to perturb the image.
Step 3: Compute Predictions
Generate samples by masking the background images and
passing them through M.
Step 4: Compute SHAP Values
Calculate SHAP values for each superpixel. The formula
calculates the average contribution of some feature j by
considering permutations of other features and measuring
how adding j changes the model’s prediction
Step 5: Aggregate SHAP Values
Assign SHAP values to corresponding pixels in each super-
pixel.
Step 6: Visualize SHAP
Create a heatmap using SHAP values, with positive contri-
butions in red and negative in blue.
trated on some peripheral regions illustrated by the
red points to predict malignancy.
Label: 0.0 corresponds to a benign lesion with
49% probability of malignancy. The SHAP visualiza-
tion shows that the model considered multiple areas
marked in blue (negative) and red (positive) across the
lesion when making the prediction.
Figure 4: Visualizing Heatmaps for SHAP
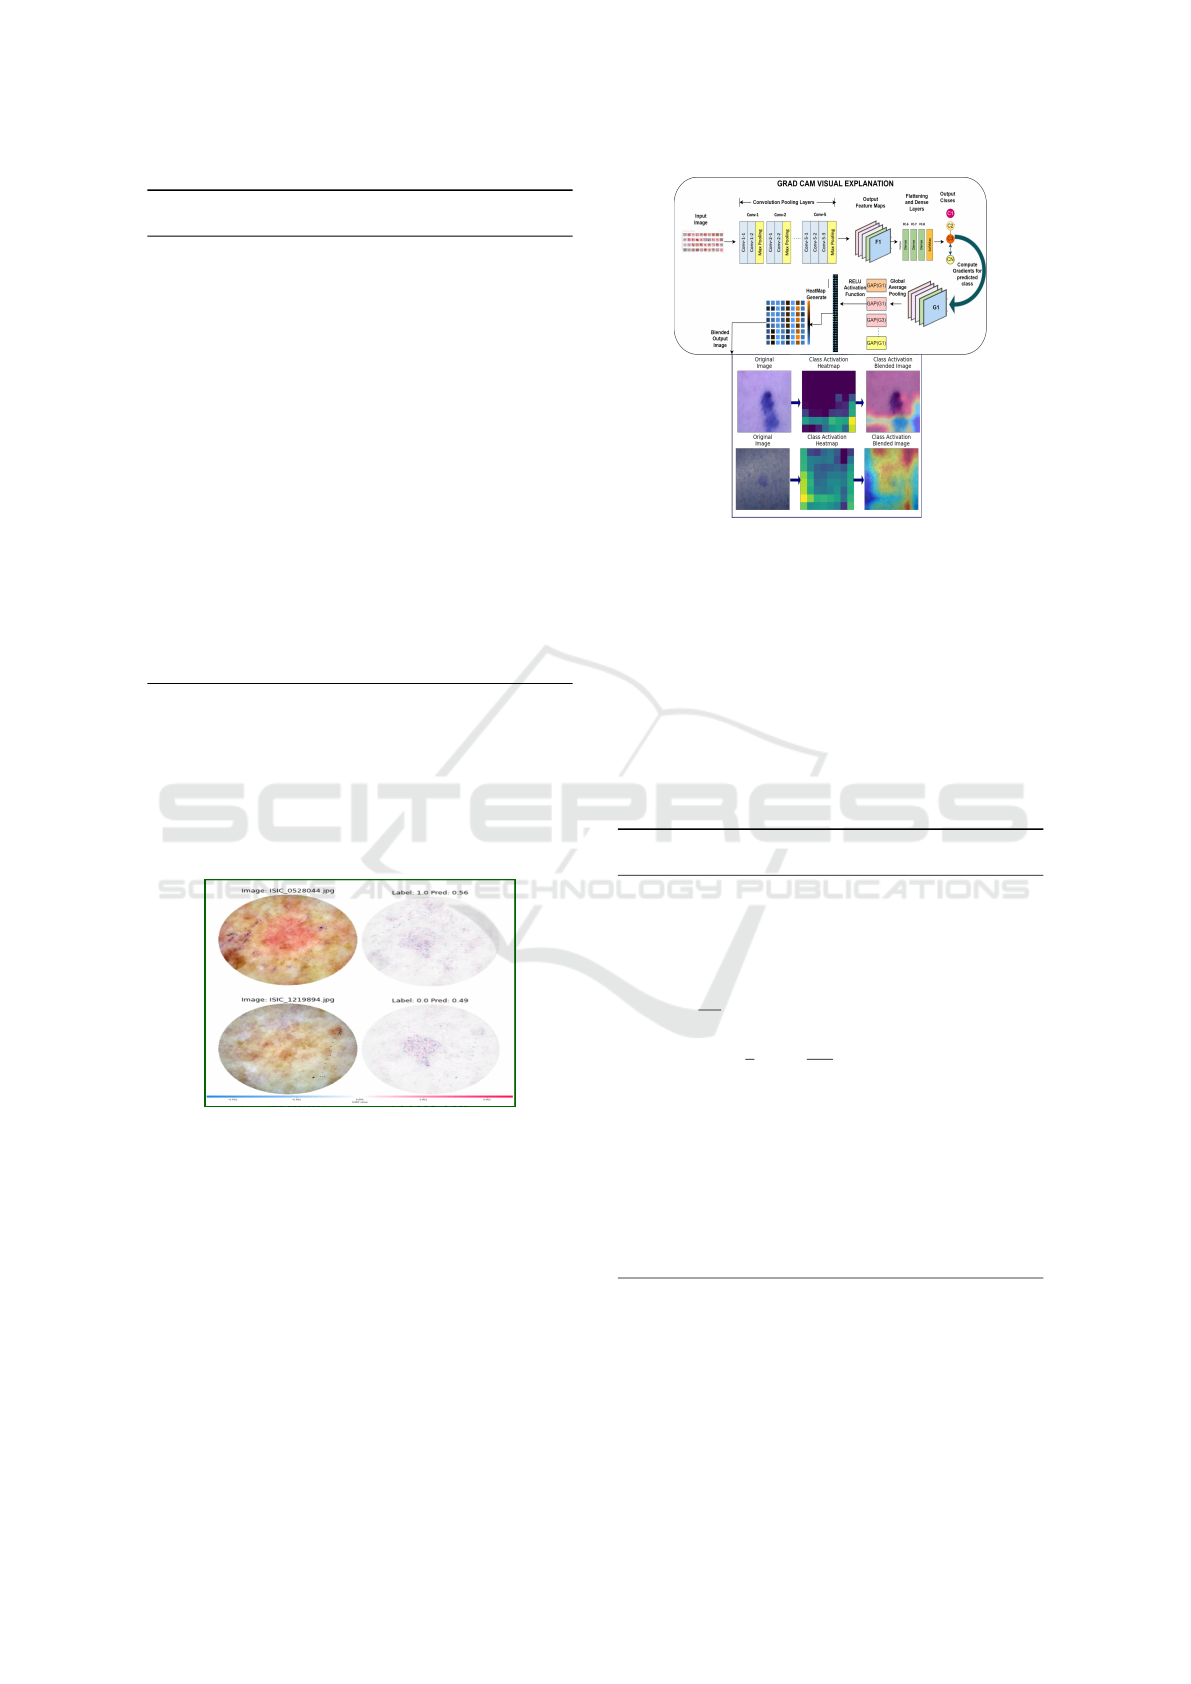
8 GRAD-CAM ALGORITHM FOR
SKIN CANCER IMAGE
INTERPRETATION
Grad-CAM supports deep learning solutions in
terms of interpretability, especially, in image classi-
fication problems that show tumor malignancy, as il-
lustrated in the algorithm 3. It allows practitioners,
such as radiologists or researchers, to:
• Ensure that the model targets areas that are of
Figure 5: Visualizing Heatmaps for GRAD CAM
medical importance.
• Find any shortcut such that the model might pay a
lot of attention to some part of the image which is
of no importance.
• Understand the decision-making process, espe-
cially suitable in industries such as healthcare,
where interpretability is essential.
The figure 5 provides a step by step explanation of
Grad-CAM applied to a skin cancer image as input,
with overlaid heatmaps.
Algorithm 3 Grad-CAM for Skin Cancer Image Pre-
dictions
Trained model M, image I, target class c, layer L.
Grad-CAM heatmap.
Step 1: Prediction
Pass I through M to get the prediction y
c
= M(I)[c].
Step 2: Gradients
Compute
∂y
c
∂A
k
for layer L.
Step 3: Weight Feature Maps
Calculate α
k
=
1
Z
∑
i
∑
j
∂y
c
∂A
k
i j
.
Step 4: Generate Heatmap
Compute H
i j
= ReLU
∑
k
α
k
A
k
i j
.
Step 5: Rescale Heatmap
Upsample H
i j
using bilinear interpolation to match
the size of the input image I . Scale H
i j
to the range
[0, 1] for visualization.
Step 6: Superimpose Heatmap Overlay H onto I to
visualize important regions.
9 RESULT
The graph in figure 6 represents the performance
of the model on the Interpretation over Union (IoU)
Explainable AI Framework for Precise and Trustworthy Skin Cancer Diagnosis
265
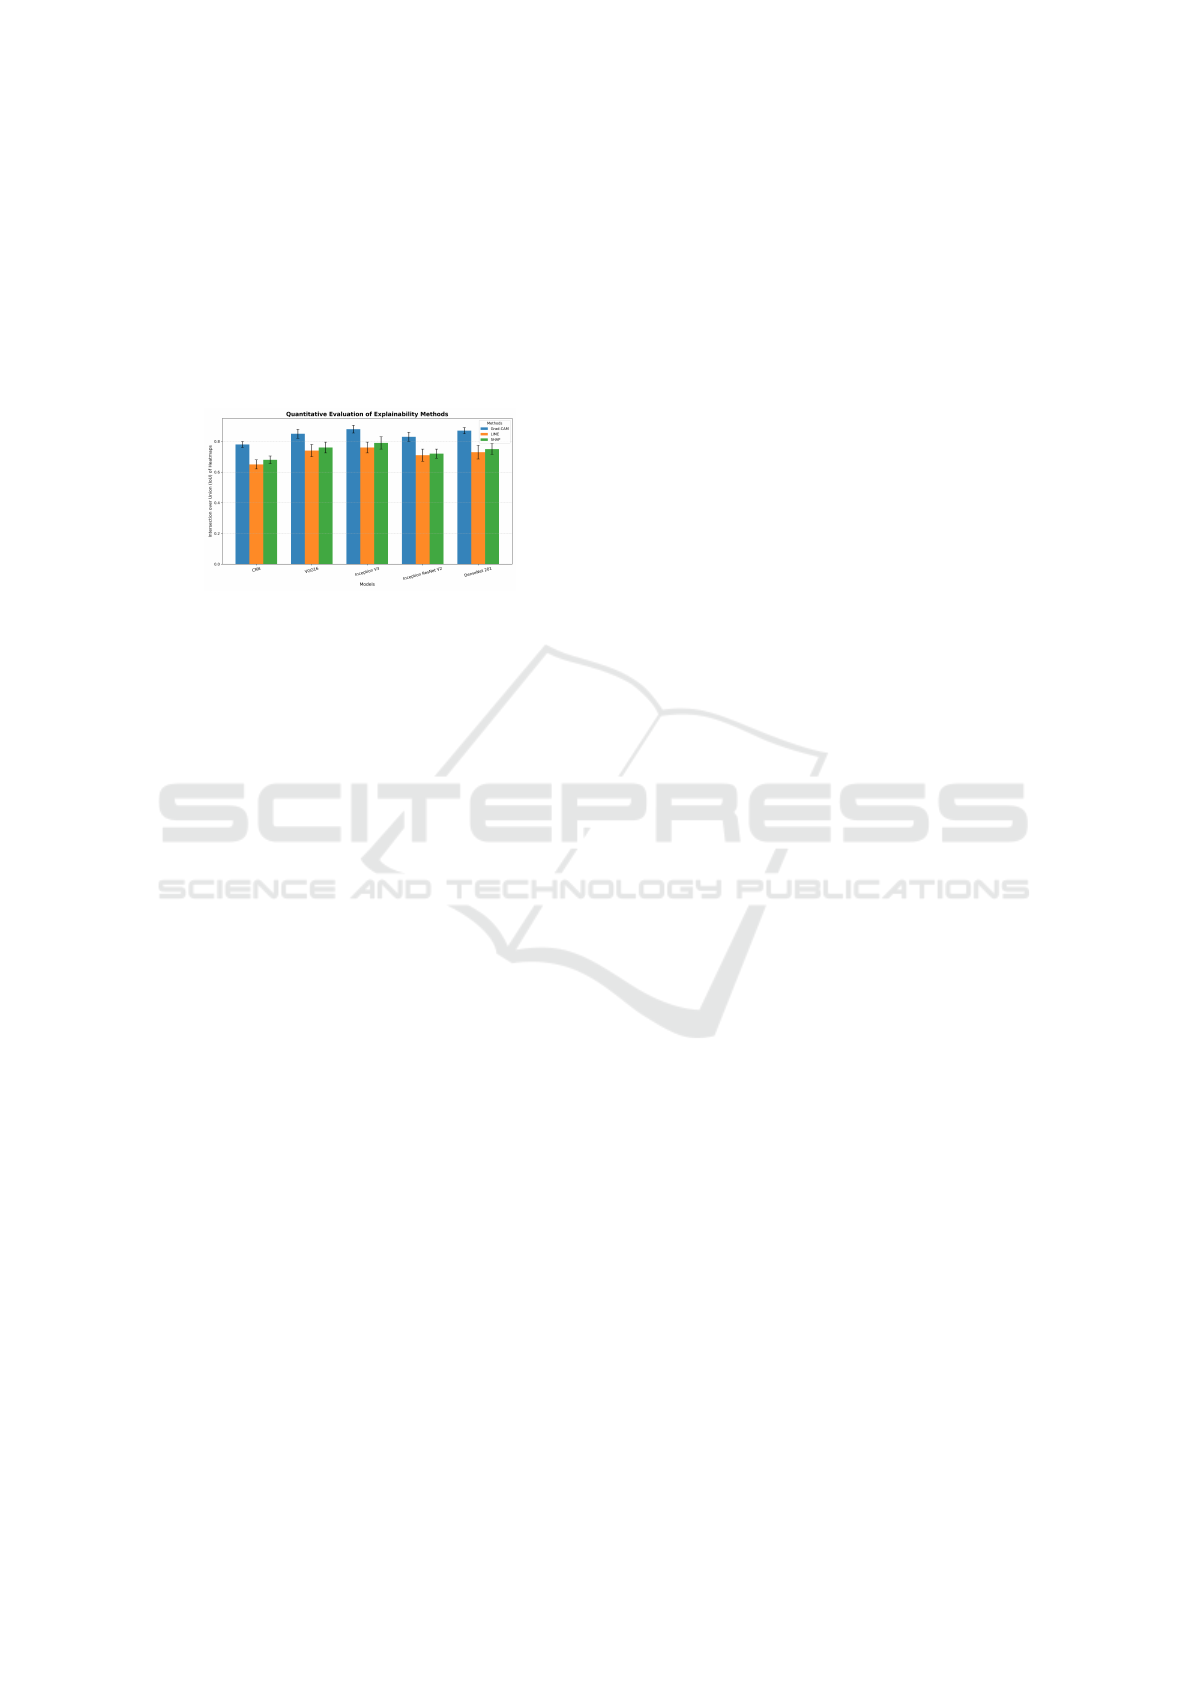
scale, which measures the overlap of the regions of
importance highlighted by explainability methods and
the actual areas of interest. X-axis shows the evalu-
ated models and the Y-axis shows the IoU which re-
flects the accuracy to which the regions defined by the
heatmaps correspond to the regions of interest. Val-
ues range from 0 to 1, where: 0: there is no over-
lap between predicted and true regions. 1: Perfect
overlap. Grad-CAM, when compared to both LIME
Figure 6: Comparison of IoU Scores for Explainable Meth-
ods: Grad-CAM, LIME, and SHAP
and SHAP, provides better results most of the time
because of its capability to visualize model decisions.
Some reasons for obtaining better results are:
1. Grad-CAM takes advantage of the overall
channel-wise architecture of the CNN, which is
designed to uncover spatial patterns at multiple
levels of abstraction. Grad-CAM focuses partic-
ularly on the last layers of the convolutional neu-
ral network and explains what components of the
input image are important for the model’s predic-
tion.
2. Grad-CAM emphasizes discriminative areas, such
as lesions or patterns that are medicinally impor-
tant.
3. Grad-CAM output consists of visual heatmaps
that are easily understandable, as they indicate
which areas influenced the model’s decisions.
These heatmaps provide excellent localization in
certain parts of the image.
4. Unlike other models, Grad-CAM uses gradients
of global feature maps, making it resistant to noise
within the input image and resulting in accurate
explanations.
5. LIME suffers from the limitation that it is effec-
tive at the local level but could be problematic
when addressing the global context in image data.
6. SHAP is limited in that it can elicit the impor-
tance of features but does not provide spatial in-
terpretations subsumed in the importance scores.
Grad-CAM, however, demonstrates high accuracy
in detecting spatial relevance.
10 SUMMARY OF USE CASES
By combining Grad-CAM, LIME, and SHAP, we
achieve a comprehensive explainability framework:
• Grad-CAMare useful for achieving a more visual
confirmation of the areas of .focus
• LIMEcould be used to explain generic decision-
making behaviors.
• SHAP could be used to provide high-level pixel-
level information and summarize important char-
acteristics.
Such a combined strategy allows for the necessary
balance between high-level interpretability and de-
tailed analysis, which may be crucial in such fields as
medical diagnostics, for example, skin cancer recog-
nition.
11 CONCLUSION
The comparison of Grad-CAM with LIME and
SHAP across models such as CNN, VGG16, Incep-
tion V3, Inception ResNet V2, and DenseNet 201
shows that Grad-CAM has better results in terms of
IoU, demonstrating its ability to detect medically im-
portant zones. LIME and SHAP do not focus on
regions similar to ground truths, while Grad-CAM
concentrates on the class-discriminative areas and are
useful for healthcare-related applications with high
visual interpretability performance. Emerging archi-
tectures such as Vision Transformers (ViTs) and its
evaluation on a more heterogeneous sample of med-
ical imaging data could validate these findings. Ap-
plying domain knowledge and feedback from users
also holds the prospect for enhancing usefulness of
explainability methods in more important and signifi-
cant applications.
REFERENCES
Ham10000 dataset, kaggle. [Online]. Available:
https://www.kaggle.com/datasets/kmader/skin-
cancer-mnist-ham10000.
A. Adak, B. Pradhan, N. S. and Alamri, A. (2022). Un-
boxing deep learning model of food delivery service
reviews using explainable artificial intelligence (xai)
technique. Foods, 11(14):2019.
Apley, D. W. and Zhu, J. (2020). Visualizing the effects
of predictor variables in black box supervised learning
models. Journal of the Royal Statistical Society Series
B: Statistical Methodology, 82(4):1059–1086.
INCOFT 2025 - International Conference on Futuristic Technology
266

F. Eitel, K. R. and the Alzheimer’s Disease Neuroimaging
Initiative (ADNI) (2019). Testing the robustness of
attribution methods for convolutional neural networks
in mri-based alzheimer’s disease classification. In In-
terpretability of Machine Intelligence in Medical Im-
age Computing and Multimodal Learning for Clinical
Decision Support, page 3–11. Springer.
H. Naeem, B. M. A. and Ullah, F. (2022). Explainable arti-
ficial intelligence-based iot device malware detection
mechanism using image visualization and fine-tuned
cnn-based transfer learning model. Computational In-
telligence and Neuroscience, 2022:7671967.
J. M. Rozanec, B. F. and Mladenic, D. (2022). Knowl-
edge graph-based rich and confidentiality preserving
explainable artificial intelligence (xai). volume 81,
page 91–102.
K. Aas, M. J. and Løland, A. (2021). Explaining individual
predictions when features are dependent: More accu-
rate approximations to shapley values. Artificial Intel-
ligence, 298:103502.
K. Wei, B. Chen, J. Z. S. F. K. W. G. L. and Chen, D. (2022).
Explainable deep learning study for leaf disease clas-
sification. Agronomy, 12(5):1035.
Kim, H. S. and Joe, I. (2022). An xai method for convolu-
tional neural networks in self-driving cars. PLOS One,
17(8):e0267282.
Lundberg, S. (2017). A unified approach to interpreting
model predictions. arXiv preprint, arXiv:1705.07874.
Mehta, H. and Passi, K. (2022). Social media hate
speech detection using explainable artificial intelli-
gence (xai). Algorithms, 15(8):291.
Molle, P. V. et al. (2018). Visualizing convolutional neural
networks to improve decision support for skin lesion
classification. In Understanding and Interpreting Ma-
chine Learning in Medical Image Computing Applica-
tions, pages 115–123. Springer.
P. Jain, R. K. Mishra, A. D. and Jain, N. K. (2024). Xplain-
able ai for deep learning model on pcod analysis. In
XAI Based Intelligent Systems for Society 5.0, page
131–152. Elsevier.
P. Linardatos, V. P. and Kotsiantis, S. (2020). Explain-
able ai: A review of machine learning interpretability
methods. Entropy, 23(1):18.
S. Pereira, R. Meier, V. A. M. R. and Silva, C. (2018). Adap-
tive explainable ai for brain tumor segmentation. In
Medical Image Computing and Computer-Assisted In-
tervention – MICCAI 2018, page 92–100. Springer.
S. Y. Lim, D. K. C. and Lee, S. C. (2022). Detecting deep-
fake voice using explainable deep learning techniques.
Applied Sciences, 12(8):3926.
Wang, X. et al. (2021). Explainable deep learning for effi-
cient and robust pattern recognition: A survey of re-
cent developments. Pattern Recognition, 120:108102.
Explainable AI Framework for Precise and Trustworthy Skin Cancer Diagnosis
267
