
Breath of the Future: Predicting Air Quality Index with ML and IoT
Sneha Varur
1
, Uma M Hiremath
1
, Devaraj Hireraddi
2
, Nitin Nagaral
2
, Kushalagouda Patil
2
and Gouri Vernekar
2
1
KLE Technological University, Hubballi, India
2
Computer Science and Engineering, KLE Technological University, Hubballi, India
Keywords:
Air Quality Indicators, Machine Learning, Internet of Things, Predictive Solutions, Artificial Neural Net-
works, Environmental Monitoring, Root Mean Square Error, Sensor Integration, IoT Infrastructure, Public
Health Protection.
Abstract:
Air pollution continues to pose substantial threats to both public health and environmental stability, emphasiz-
ing the critical need for sophisticated monitoring and predictive solutions. The study offers a visionary strategy
for forecasting the Air Quality Index (AQI) by integrating Machine Learning (ML) with the Internet of Things
(IoT). The proposed system utilizes an array of environmental sensors to gather real-time data, which is sub-
sequently processed by advanced machine learning algorithms, with a specific emphasis on artificial neural
networks (ANN), to generate accurate AQI predictions. The IoT architecture facilitates seamless, real-time
data acquisition, enhancing both the accuracy and responsiveness of the system. This paper delves into the
technical aspects of the system, including the detailed methodology, hardware configuration, and software
integration, to illustrate the synergistic potential of ML and IoT in air quality forecasting. The results indicate
strong model efficacy, with a root mean square error (RMSE) of 82.84% and a classification accurateness
of 94.54%, underscoring the system’s capability in effectively monitoring and predicting air pollution levels.
The research offers significant advancements in the field of environmental monitoring, demonstrating how the
convergence of ML and IoT can play a pivotal role in the future of air quality management and public health
protection.
1 INTRODUCTION
Atmospheric corrosion remains a major global con-
cern, with substantial risks to ecosystems, human
health, and climate stability. With the swift pace of in-
dustrialization and urbanization in contemporary so-
ciety, the concentration of harmful pollutants in the
atmosphere has reached unprecedented levels. Pollu-
tants such as nitrogen dioxide (NO2), sulfur dioxide
(SO2), carbon monoxide (CO), ozone (O3), ammonia
(NH3), and particulate matter (PM 2.5 and PM 10)
(Rakib, Haq, et al. 2022) have been directly linked to
respiratory and cardiovascular diseases, cancer, and
various neurological disorders. The urgency to mon-
itor and manage air quality is more critical than ever,
especially in densely populated urban areas where the
adverse effects of pollution are most pronounced (Mi-
hirani, Yasakethu, et al. 2022). However, the com-
plexities involved in accurately measuring and pre-
dicting AQI make it a challenging task. One of the
primary challenges in air quality monitoring is the dy-
namic nature of pollutants, which vary significantly
over time and space. Traditional methods rely on sta-
tionary monitoring stations, which, although accurate,
are often limited in their coverage and cannot provide
real-time data for every location of interest. This lim-
itation hampers the ability to respond swiftly to haz-
ardous pollution levels. Moreover, the vast amount
of data generated from multiple sources, including
weather conditions and traffic patterns, complicates
the task of accurately predicting future pollution lev-
els. Effective monitoring systems must therefore be
capable of both real-time data acquisition and sophis-
ticated analysis to provide timely and accurate air
quality forecasts.
The smart device ecosystem has come to promi-
nence as a game-changing innovation with the po-
tential to change environmental surveillance. By en-
abling a network of interconnected sensors and de-
vices, IoT facilitates the continuous collection of real-
722
Var ur, S., Hiremath, U. M., Hireraddi, D., Nagaral, N., Patil, K. and Vernekar, G.
Breath of the Future: Predicting Air Quality Index with ML and IoT.
DOI: 10.5220/0013584300004664
Paper published under CC license (CC BY-NC-ND 4.0)
In Proceedings of the 3rd International Conference on Futuristic Technology (INCOFT 2025) - Volume 1, pages 722-728
ISBN: 978-989-758-763-4
Proceedings Copyright © 2025 by SCITEPRESS – Science and Technology Publications, Lda.

time data across large areas. In the context of air
quality monitoring, IoT devices can be strategically
deployed to gather data on various environmental pa-
rameters, including pollutant concentrations, temper-
ature, and humidity (Gupta, Mohta, et al. 2023).
This infrastructure significantly enhances the ability
to monitor air quality at a granular level, providing the
necessary data to understand pollution patterns and
dynamics in real-time. However, the sheer volume of
data collected by IoT devices presents its own set of
challenges, notably on the subject of data processing,
storage, and analysis.
To address the challenge of analyzing large
datasets generated by IoT sensors, Machine Learn-
ing (ML) (M
´
endez, Merayo, et al. 2023) offers pow-
erful tools for making sense of complex and high-
dimensional data. ML algorithms excel at identify-
ing patterns and correlations that may not be imme-
diately apparent through traditional statistical meth-
ods. In the domain of air quality projection, ML mod-
els can be trained on historical data to forecast future
pollutant levels (Krishna and Nabi, 2022), bearing
into account various contributing aspects such as me-
teorological circumstances and traffic data (Kumari,
Vasuki, et al. 2020). Among these models, Artifi-
cial Neural Networks (ANNs) have shown particular
promise due to their ability to model non-linear rela-
tionships and learn from continuous streams of data
(Shaban, Kadri, et al. 2022). The integration of ML
with IoT not only enhances the accuracy of air quality
predictions but also enables adaptive learning, where
the model continuously improves as more data be-
comes available.
This study explores the convergence of IoT and
ML technologies to create an advanced air quality
monitoring and prediction system. By leveraging
real-time data collected from a network of environ-
mental sensors and applying ANN models, we have
developed a system capable of predicting AQI with
high accuracy. The system was tested using data
collected from sensors monitoring various pollutants
and environmental conditions. The experimental re-
sults demonstrated an RMSE of 82.84% and a pre-
cision of classification outcomes of 94.54%, indicat-
ing the system’s effectiveness in predicting air quality.
These findings underscore the potential of combin-
ing IoT and ML technologies to address the pressing
challenge of air pollution and pave the way for more
responsive and informed environmental management
practices.
2 LITERATURE SURVEY
The study by the authors in (Gupta, Mohta, et al.
2023) attempts to predict the AQI in Indian cities
using Support vector regression, Random Forest Re-
gression (RFR), and CatBoost Regression (CR). They
incorporate the (SMOTE) Synthetic Minority Over-
sampling Technique for managing skewed datasets.
While their results indicate that RFR and CR perform
reasonably well, the improvements with SMOTE are
limited to specific cities. The overall approach lacks
a comprehensive evaluation across diverse environ-
ments, which limits its generalizability.
In (Bhattacharya and Shahnawaz, 2022), the au-
thors use Support Vector Regression (SVR) to fore-
cast air quality in New Delhi, achieving an accuracy
of 93.4%. The study highlights the significance of
data pre-processing and demonstrates that operating
the full spectrum of variables yields more promising
results than feature selection via PCA. However, the
study is confined to New Delhi and relies heavily on
archived data, which may not adequately represent
real-time prediction scenarios.
The research in (Gogineni and Murukonda, 2022)
compares multiple machine learning methods for
AQI prediction, including LASSO, SVR, and Ran-
dom Forest. While some methods, like Extra Trees
and Ridge Regression, showed promising results, the
overall performance was inconsistent across different
datasets. The study’s reliance on conventional regres-
sion models also limits its ability to handle complex,
real-world air quality dynamics effectively.
In (Murugan and Palanichamy, 2022), the authors
focus on predicting PM2.5 levels in Malaysian smart
cities using Random Forest and MLP (Multi-Layer
Perceptron). Though Random Forest achieved 97%
accuracy, the study’s scope is narrow, with findings
that may not translate well to other regions or pol-
lutants. The research lacks a detailed exploration of
how these models would perform under different en-
vironmental conditions or with varying data quality.
3 PROPOSED METHODOLOGY
The envisioned task entails designing and implement-
ing an air quality monitoring system, integrating mul-
tiple sensors with a microcontroller, and utilizing ma-
chine learning for predictive modeling. This section
outlines the experimental setup, sensor integration,
data processing techniques, and the selection and val-
idation of the prediction model. Additionally, a com-
parative analysis is furnished to demonstrate the con-
vincingness of the suggested guideline.
Breath of the Future: Predicting Air Quality Index with ML and IoT
723
3.1 System Overview
The system includes an Arduino Uno microcontroller,
an ESP8266 Wi-Fi module, and four sensors: a MQ-
135 for detecting ammonia (NH
3
), a MQ-7 for moni-
toring carbon monoxide (CO), a MQ-2 for further gas
detection, and a DHT11 for measuring temperature
and humidity. The detectors collect data in real-time,
which is then sent to the ThingSpeak cloud platform
for storage, analysis, and modeling. Figures 1 illus-
trate the hardware setup and 2 the system architecture.
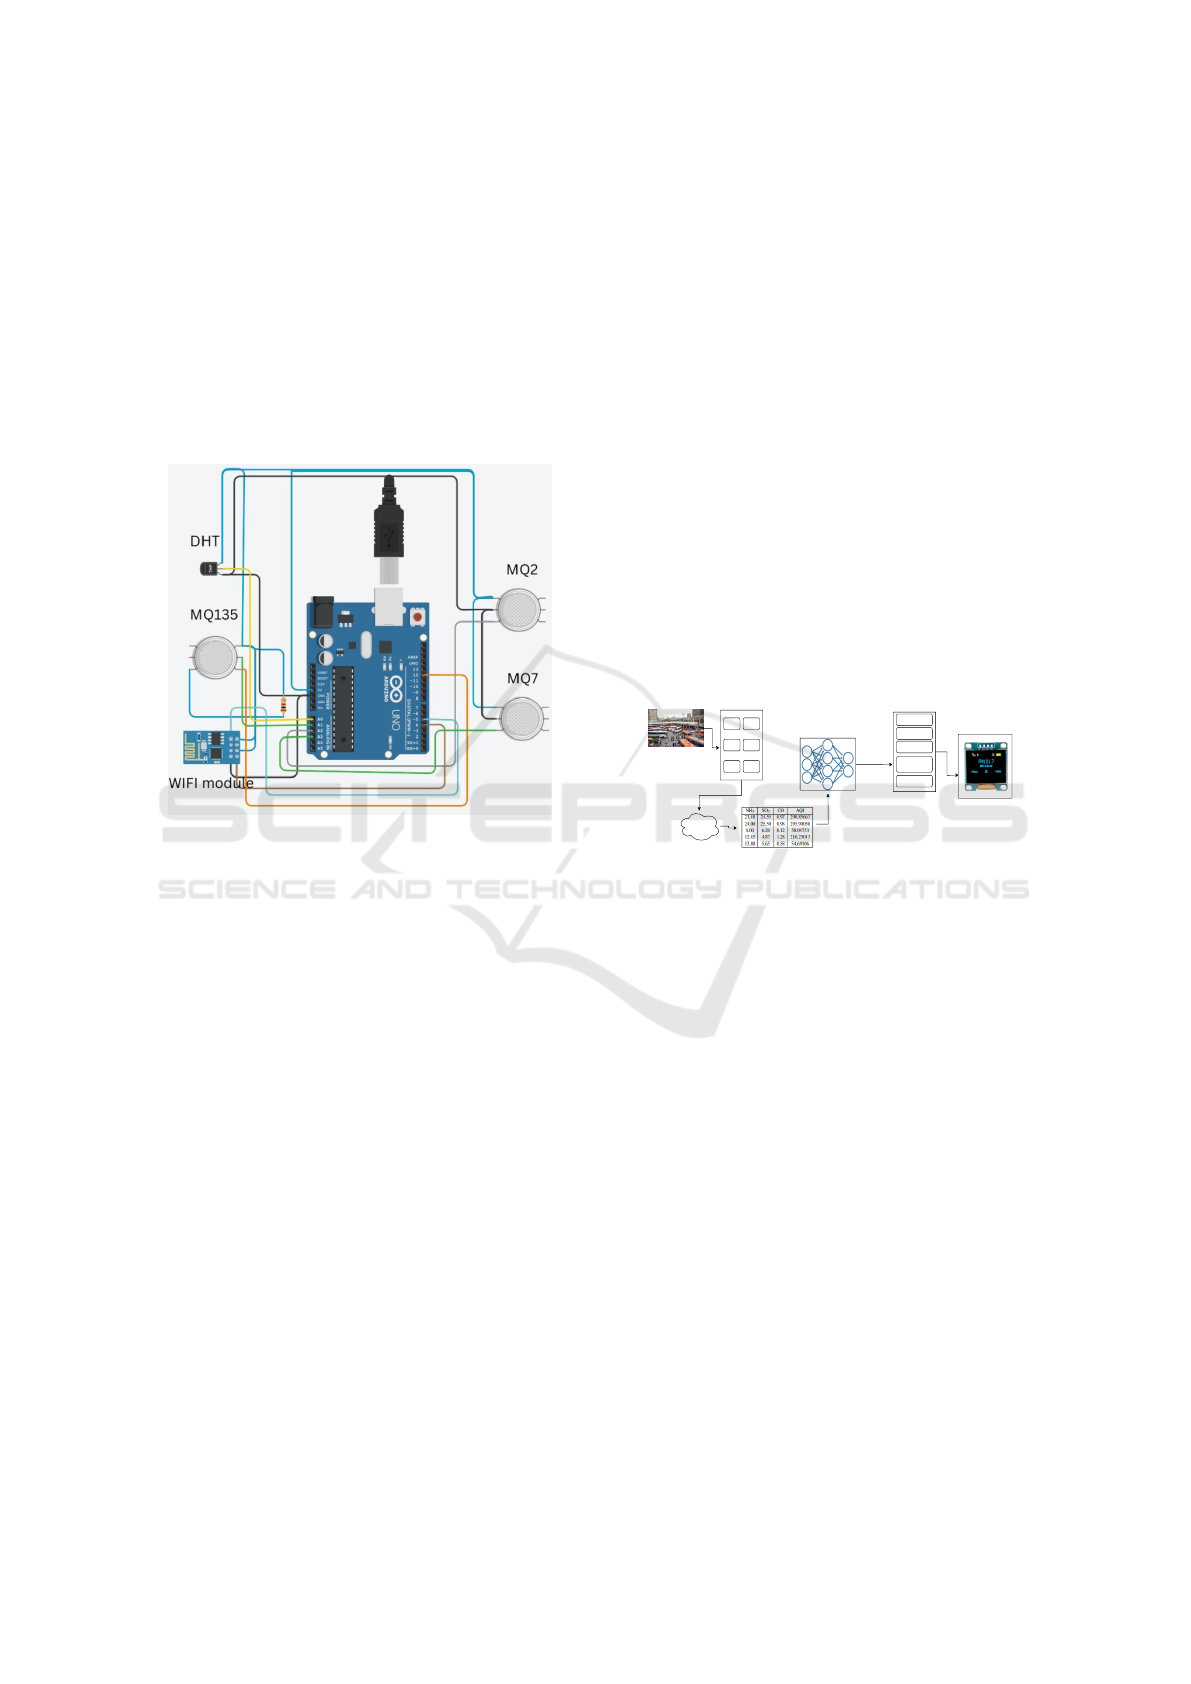
Figure 1: Hardware Setup
The figure 1 illustrates a circuit diagram involving
an Arduino Uno microcontroller connected to multi-
ple sensors and a Wi-Fi module. Below is a detailed
breakdown of the components and their connections:
3.2 Components:
• Arduino Uno: The central microcontroller board
that controls and processes the data from the
probes.
• DHT Sensor: A digital humidity and temperature
sensor.
• MQ135 Sensor: A gas sensor used to measure air
quality (e.g., CO2, NH3, Benzene).
• MQ2 Sensor: A gas sensor that detects
flammable gases like LPG, Propane, and Hydro-
gen.
• MQ7 Sensor: A gas sensor specifically designed
to detect carbon monoxide (CO).
• Wi-Fi Module (likely ESP8266): A module that
enables the Arduino to connect to a Wi-Fi network
for data transmission.
3.3 Wiring:
• DHT Sensor: Connected to a digital pin on the
Arduino (likely D4 or similar) for data input.
VCC (Power) - is linked 5Volt pin, and the GND
pin is concatenated to the ground connection of
the Arduino.
• MQ135, MQ2, and MQ7 Sensors: Each sensor
has 3 connections VCC is connected - 5V pin.
GND is connected - ground pin. The analog out-
puts are connected to different analog input pins
on the Arduino (e.g., A0, A1, A2).
• Wi-Fi Module: Attached to the Arduino’s TX
and RX pins for serial communication. VCC is
connected to the 3.3V pin (if it’s ESP8266) or 5V
pin (if it’s a different model). GND is connected
to the ground.
3.4 System Architecture
CO2 NO
CO2 NO2
NH3 SO2
Thing Speak
Cloud
ML Model
BUS Stand IoT System
Values of Gases
Data
Good
Moderate
Unhealthy
Unhealthy for
Strong people
Hazardous
AQI Bucket
OLED Display
Classification
Figure 2: System Architecture
The figure 2 represents a system designed to mon-
itor and assess air quality at a bus stand operating a
blend of IoT technology, cloud computing, and ma-
chine learning. The system begins by using sensors
to detect various gases like CO2, NO, NO2, NH3,
and SO2 in the environment. These gas concentra-
tion values are then transmitted to the ThingSpeak
cloud platform, where they are stored and processed.
The unprocessed data gathered from the sensors is fed
into a machine learning model, which analyzes the
data and classifies the air quality into different vari-
eties, such as ”Good,” ”Moderate,” ”Unhealthy,” and
”Hazardous.” This classification is based on the AQI.
Finally, the resulting air marker classification is dis-
played on an OLED screen, providing real-time in-
formation about the air quality at the bus stand. The
system’s goal is to offer accurate, real-time air qual-
ity assessments, enabling people at the bus stand to
be aware of the pollution levels and make informed
decisions about their exposure.
INCOFT 2025 - International Conference on Futuristic Technology
724

3.5 Hardware and Software Integration
3.5.1 Sensor Integration
Each sensor is interfaced with the Arduino Uno mi-
crocontroller. The analog signals from the gas sensors
are converted to digital values using the Arduino’s
ADC. The DHT11 sensor provides digital readings
for temperature and humidity directly. The sensors
are connected as follows:
V
out
= R
L
×
V
s
− V
sensor
V
sensor
(1)
where V
out
is the output voltage, R
L
is the load re-
sistance, and V
sensor
is the sensor voltage.
3.5.2 Data Broadcasting
The ESP8266 wireless networking module is config-
ured to transmit sensor data to the ThingSpeak cloud.
Data is sent using HTTP POST requests, formatted as
JSON objects. The module operates in station mode,
connected to a local Wi-Fi network.
3.5.3 Data Preprocessing
The raw sensor data is preprocessed to handle incom-
plete data, outliers, and noise. Unrecorded entries are
filled in or estimated utilizing linear interpolation, and
outliers are detected and removed based on a z-score
threshold of 3. The data is then averaged on an hourly
basis to reduce temporal variability.
z-score =
x
i
− µ
σ
(2)
where x
i
denotes the data values, µ represents the
mean, and σ signifies the standard deviation.
3.6 Model Choosing and Training
3.6.1 Model Selection
The project explored diverse machine learning mod-
els for predictive analysis, including Linear Regres-
sion, polynomial regression, and LSTM webs. How-
ever, these models were either insufficient or over-
complicated for the dataset. Based on the complex-
ity of the data and the need for capturing non-linear
patterns, Artificial Neural Networks (ANNs) were se-
lected as the most suitable model.
ˆy = f
n
∑
i=1
w
i
· x
i
+ b
!
(3)
where ˆy is the predicted output, w
i
are the weights,
x
i
are the inlets, and b is the bias-term.
3.6.2 Model Training and Validation
ANN model was trained on the processed dataset,
consisting of features such as CO, NH
3
, SO
2
, H
2
con-
centrations, temperature, and humidity. The model
was configured with a single hidden layer comprising
64 neurons and ReLU activation functions. The out-
come section employs the linear activation function
for regression.
Loss Function: MSE =
1
n
n
∑
i=1
(y
i
− ˆy
i
)
2
(4)
y
i
is the true value, ˆy
i
is the anticipated outcome,
and n is the count of samples
3.6.3 Performance appraisal
The framework interpretation was reckoned using
RMSE (Root Mean Squared Erro and MAPE (Mean
Absolute Percentage Error). The effects were com-
pared against traditional models to demonstrate the
superior accuracy of the ANN model.
RMSE =
s
1
n
n
∑
i=1
(y
i
− ˆy
i
)
2
(5)
MAPE =
1
n
n
∑
i=1
y
i
− ˆy
i
y
i
× 100 (6)
3.7 Comparative Analysis
To validate the suggested model, its performance was
likened to additional strategies such as Linear Regres-
sion, Polynomial Regression, and LSTM. The ANN
model demonstrated superior performance, with a
lower RMSE and MAPE, and higher prediction ac-
curacy.
4 RESULTS
The results presented here are derived from the im-
plementation and testing of the proposed air quality
monitoring and prediction system. Our approach, as
outlined in the Proposed Work section, integrates IoT
sensors, cloud-based data storage, and machine learn-
ing for effective air quality monitoring.
4.1 Sensor Data and AQI Analysis
The study performed a sequel of tests to validate the
sensor data and its integration with the ThingSpeak
Breath of the Future: Predicting Air Quality Index with ML and IoT
725
cloud. The data collected from the proposed mi-
crocontroller setup using the ThingSpeak API is dis-
played in real-time through the ThingSpeak control
panel. This includes continuous monitoring of key
pollutants: NH3, SO2, and CO.
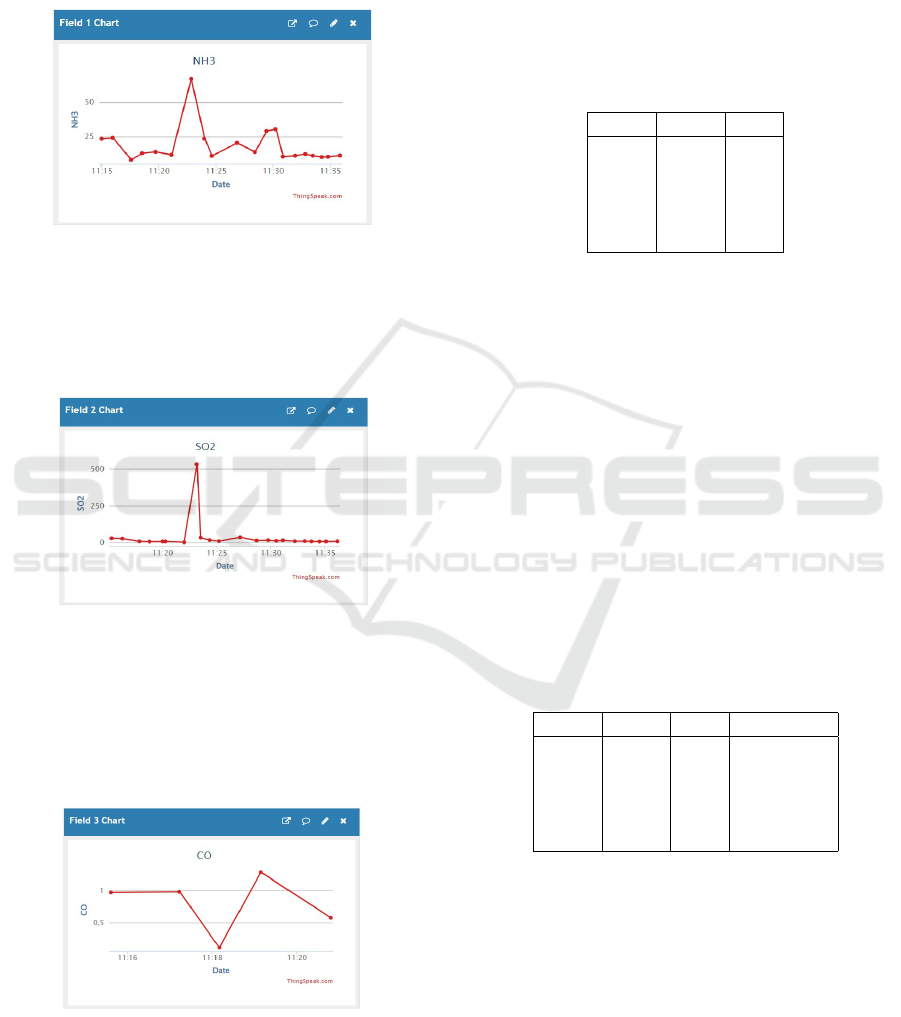
Figure 3: Time-Series Analysis of NH3 Levels
The chart 3 shows NH3 levels over time, with a
sharp peak around 11:25, followed by a gradual de-
cline.
Figure 4: Trends in SO2 Concentrations Over Time
The diagram 4 depicts a sharp spike in sulfur diox-
ide (SO2) levels around 11:25 AM, followed by a
rapid decline. SO2 concentration remained relatively
low before and after this peak.
Figure 5: Temporal Variation of CO Levels
The graph 5 shows CO levels over time. The lev-
els remain relatively stable until 11:18, where they
drop sharply, then rise again to a peak at 11:20 before
falling back down.
The sensor data is then used to calculate AQI val-
ues, which provide a snapshot of air quality over a
given period. Table 1 shows the calibrated values of
all parameters, including temperature and humidity,
after proper calibration of the sensors. The calcu-
lated AQI values categorize air quality from ”Good”
to ”Hazardous” for the entire day.
Table 1: Data for NH
3
, SO
2
, and CO
NH
3
SO
2
CO
23.48 24.55 0.97
24.00 25.50 0.98
8.00 6.20 0.12
12.85 4.87 1.28
13.80 5.65 0.58
4.2 Prediction Model Performance
To predict future pollutant levels, we employed Artifi-
cial Neural Networks (ANNs), chosen for their capa-
bility to model complex data patterns. The prediction
model was trained and validated using the collected
dataset, leading to a significant Root Mean Squared
Error (RMSE) of 82.84 and a high classification suc-
cess rate of 94.54%. These metrics demonstrate the
model’s robustness and effectiveness in forecasting
air quality based on sensor data.
Table 2 shows the predicted AQI values gener-
ated by the ANN model. The results indicate that
the model accurately predicts AQI levels, aligning
closely with the actual sensor data, thereby validating
the model’s reliability.
Table 2: Predicted AQI Values
NH
3
SO
2
CO AQI
23.48 24.55 0.97 290.85663
24.00 25.50 0.98 295.90050
8.00 6.20 0.12 58.04753
12.85 4.87 1.28 210.23013
13.80 5.65 0.58 54.69106
The model’s architecture, developed using Ten-
sorFlow, incorporates layers with specific activation
functions and regularization techniques to optimize
performance. The accuracy graph (Fig. 6) illustrates
the model’s learning progression, confirming its abil-
ity to classify AQI levels effectively.
These results not only substantiate the proposed
methodology but also emphasize the model’s capac-
ity to contribute significantly to air pollution moni-
toring and forecasting. The high accuracy and low
INCOFT 2025 - International Conference on Futuristic Technology
726
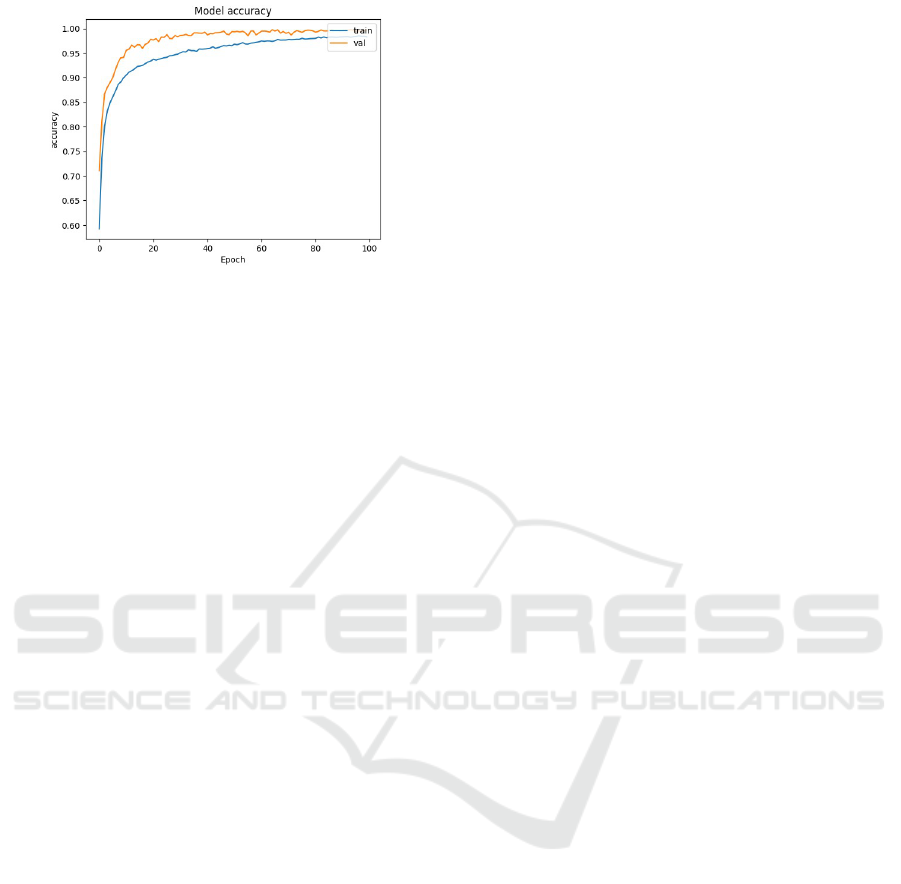
Figure 6: Model Accuracy Over Training Epochs
error rates highlight the potential for deploying this
system in real-world applications, enhancing both en-
vironmental monitoring and public health awareness.
5 CONCLUSIONS
The study has made significant progress in advancing
AQ Oversight and anticipation by leveraging the har-
monious combination of Machine Learning and the
Internet of Things. The consequences demonstrate
the potency of the designed system, particularly in uti-
lizing Artificial Neural Networks (ANNs) for predict-
ing Air Quality Index (AQI) with high accuracy. The
prototype achieved an RMSE of 82.84 and a classifi-
cation precision of 94.54%, underscoring its capabil-
ity to capture complex patterns in air quality data.
The comprehensive system, which combines so-
phisticated hardware configurations with advanced
software algorithms, presents a dynamic and efficient
approach to environmental monitoring. This inno-
vation enhances our comprehension of air pollution
dynamics and even enables preventive environmental
management strategies. The real-time data acquisi-
tion facilitated by IoT devices, coupled with the pre-
dictive analytics provided by ML, shows immense po-
tential in addressing the critical challenges of air pol-
lution.
As global industrialization and urbanization con-
tinue to intensify, the insights and methodologies de-
veloped in this study contribute meaningfully to the
ongoing global discourse on sustainable environmen-
tal practices. By harnessing the power of advanced
technologies, the points the path toward a destiny
where predictive modeling and real-time monitoring
work in concert to safeguard human health and pro-
tect flimsy ecosystems. The findings highlight the
importance of continued innovation and shared com-
mitment to creating a healthier and cleaner planet for
future generations
REFERENCES
Rakib, M., Haq, S., Hossain, M. I., and Rahman,
T., 2022. IoT Based Air Pollution Monitoring
& Prediction System. In Proceedings of the 3rd
International Conference on Innovations in Sci-
ence, Engineering and Technology (ICISET),
Chittagong, Bangladesh, pp. XX-XX.
Mihirani, M., Yasakethu, L., and Balasooriya,
S., 2022. Machine Learning-based Air Pollu-
tion Prediction Model. Sri Lanka Technological
Campus, School of Engineering and Technology.
Gupta, N. S., Mohta, Y., Heda, K., Armaan, R., Valar-
mathi, B., and Arulkumaran, G., 2023. Predic-
tion of Air Quality Index Using Machine Learn-
ing Techniques: A Comparative Analysis. Jour-
nal of Environmental and Public Health, Volume
2023, Article ID 4916267, pp. XX-XX.
M
´
endez, M., Merayo, M. G., and N
´
u
˜
nez, M., 2023.
Machine Learning Algorithms to Forecast Air
Quality: A Survey. Published online: 16 Febru-
ary 2023.
Bhattacharya, S., and Shahnawaz, S., 2022. Using
Machine Learning to Predict Air Quality Index
in New Delhi. Jadavpur University, Department
of Computer Science and Engineering.
Gogineni, A. C., and Murukonda, V. S. N. M., 2022.
Prediction of Air Quality Index Using Super-
vised Machine Learning.
Kulkarni, M., Rajule, N., Raut, A., and Pawar, S.,
2022. Air Quality Monitoring and Prediction us-
ing SVM. Dr. D. Y. Patil Institute of Technol-
ogy, Department of Electronics & Telecommuni-
cation Engineering, Pimpri, Pune, India.
Sonawane, P., Dhanawade, S., Barangule, V., Kulka-
rni, A., and Mahalle, P., 2022. Air Quality
Analysis & Prediction Using Machine Learning:
Pune Smart City Case Study. Vishwakarma In-
stitute of Information Technology, Dept. of Me-
chanical Engineering, Pune, India.
Murugan, R., and Palanichamy, N., 2021. Smart City
Air Quality Prediction using Machine Learning.
In Proceedings of the 5th International Confer-
ence on Intelligent Computing and Control Sys-
tems (ICICCS 2021), IEEE Xplore, ISBN: 978-
0-7381-1327-2.
Kasetty, S. B., and Nagini, S., 2022. A Survey Pa-
per on an IoT-based Machine Learning Model
to Predict Air Pollution Levels. In Proceedings
of the 4th International Conference on Advances
in Computing, Communication Control and Net-
working (ICAC3N 2022).
Breath of the Future: Predicting Air Quality Index with ML and IoT
727

Krishna, Y. S., and Nabi, M. A., 2022. Prediction of
Air Pollutants Using Supervised Machine Learn-
ing. Bachelor’s Thesis, Department of Computer
Science and Engineering.
Zhang, D., and Woo, S. S., 2020. Real-Time Lo-
calized Air Quality Monitoring and Predic-
tion Through Mobile and Fixed IoT Sens-
ing Network. IEEE Access, DOI: 10.1109/AC-
CESS.2020.2993547.
Kumari, A., Vasuki, H. R., Kumar, K. S. A., Nikesh,
M. P., and Raju, H. V., 2020. Prediction of Air
Quality in Industrial Area. In Proceedings of the
5th International Conference on Recent Trends
on Electronics, Information, Communication &
Technology (RTEICT-2020), Bangalore, India,
November 12-13.
Gore, R. W., and Deshpande, D. S., 2022. An Ap-
proach for Classification of Health Risks Based
on Air Quality Levels. Marathwada Institute of
Technology, Department of Computer Science
and Engineering, Aurangabad, Maharashtra.
Shaban, K. B., Kadri, A., and Rezk, E., 2022. Urban
Air Pollution Monitoring System With Forecast-
ing Models.
INCOFT 2025 - International Conference on Futuristic Technology
728
