Predictive Monitoring and Anomaly Detection in Industrial Systems
Archana Burujwale, Anuj Tadkase, Tejas Hirve, Yash Kolekar and Sumedh Bambal
Department of Computer Science and Engineering(Artificial Intelligence) Vishwakarma Institute of Technology, Pune,
411037, Maharashtra, India
Keywords: Anomaly Detection, Ensemble Learning, Isolation Forest, Local Outlier Factor, One-Class SVM, Robust
Covariance, Industrial Sensors, Real-Time Monitoring, Operational Efficiency, Machine Learning, Time-
Series Analysis, Oil and Gas Industry, Artificial Intelligence, Cloud Computing.
Abstract: In today’s industrial activities, the detection of anomalies in real-time is important for safety and efficiency
primarily in the oil and gas sector. This paper introduces a strange finding detection system which processes
time-series data from different pumps, ball-bearings and chemical sensors like CH4 , CO2 , O2 , temperature,
humidity and pressure. The system employs various machine learning models such as Isolation Forest, Local
Outlier Factor, Robust Covariance and a One- Class SVM. The individual models detect anomalous sensor
behavior, and the ensemble model combines their predictions through majority voting. The solution suggested
will resolve data quality issues, provide businesses with actionable insights for better decision- making,
lowered operational costs and better safety by addressing critical anomalies on time.
1 INTRODUCTION
In today’s industrial world, oil and gas sectors need
to operate efficiently and safely. Many damages and
designs used in the chemicals and oil and gas
industries are highly volatile and hazardous in nature.
As such, they are highly susceptible to leaks and gas
releases, equipment malfunctions, and external
events such as changes in temperature and humidity.
Pipelines carry gases including methane (CH4),
carbon dioxide (CO2), and oxygen (O2) at high
pressure with temperature controls and integrity
checks in storage vessels. If these parameters stray
too far from the ideal, the consequences can be dire—
poor safety for workers and even damage to our
environment. For instance, uncontrolled growth in a
pipeline’s pressure can trigger an explosion while a
rise or drop in temperature can cause the gas flow to
be inefficient, or even condense, causing long- term
damage.
The major objective of this research is to design
an automated monitoring system which detects the
anomalies in the multiple datasets such gas pressure,
temperature, humidity, etc. Our system uses some
machine learning models so that it is easier to monitor
and detect them namely Isolation Forest, Local
Outlier Factor, Robust Covariance (Elliptic
Envelope), and One-Class SVM to identify and
monitor outlier and anomalous behaviour in sensor
data. With the ability to pick up on anomalies in real-
time, companies can quickly solve issues and prevent
unexpected downtime.
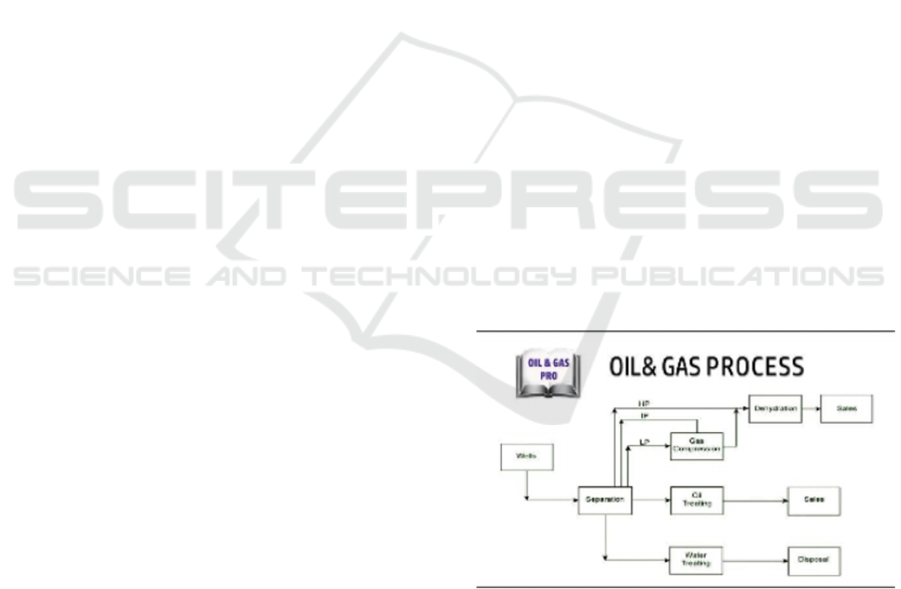
Figure 1: Process flow of Oil and Gas production
Once an anomaly occurs such as an increase in
pressure or temperature drop, alert can be raised
enabling the operator to take instant action. This
activity to shut down certain processes is activated
automatically for safety for workers and the
environment from escalation. Our system helps you
comply with regulations, operate efficiently, and
Burujwale, A., Tadkase, A., Hirve, T., Kolekar, Y. and Bambal, S.
Predictive Monitoring and Anomaly Detection in Industrial Systems.
DOI: 10.5220/0013583700004664
Paper published under CC license (CC BY-NC-ND 4.0)
In Proceedings of the 3rd International Conference on Futuristic Technology (INCOFT 2025) - Volume 1, pages 683-691
ISBN: 978-989-758-763-4
Proceedings Copyright © 2025 by SCITEPRESS – Science and Technology Publications, Lda.
683

improve safety for workers and the environment by
addressing your issues as they arise.
2 LITERATURE SURVEY
Ahmed, M., Mahmood, A. N., & Hu, J.
(2016).Reviews various techniques used to detect
network anomalies which including statistical
methods and machine learning approaches.
Hodge, V. J., & Austin, J. (2004). Author
discusses different outlier detection techniques for
machine learning methods.
Zong, B., et al. (2018). The authors disuses tha
combination of deep autoencoders with Gaussian
mixture models for anomaly detection.
Wang, F. Y., et al. (2018). The author develops
real-time anomaly detection system using machine
learning models used for IoT applications in
industries.
Yu, L., et al. (2018). Investigates various machine
learning models for detecting anomalies and
providing insights.
Munir, A., & Saeed, M. (2020). The authors
review predictive maintenance techniques which
includes machine learning methods for anomaly
detection.
Alhassan, S. A. T., et al. (2021).Author discussed
challenges faced in using machine learning for
anomaly detection.
Choudhary, S., & Patel, P. (2021).Authors used
ARIMA models for time series forecasting in
chemical processing.
Liu, Y., et al. (2021). Focuses on anomaly
detection in industrial control system using different
machine learning model to compare their
performance metrics.
Iglewski, J. & P. B. (2019). The authors presented
a framework for real-time anomaly detection in
manufacturing systems using machine learning
techniques.
Ghafoor, K. et al. (2020). This paper investigates
the effectiveness of deep learning methods for
detecting anomalies in industrial time series data.
Zhang, Y., & Jiang, H. (2019). The authors review
various methods for anomaly detection in industrial
applications detected by integration of machine
learning and domain knowledge.
Li, Y., et al. (2021). This study develops an
anomaly detection model for predictive maintenance
in industrial settings by utilizing different sensors
data and machine learning models.
Marjanovic, O., et al. (2020). This paper uses a
hybrid approach for anomaly detection in smart
manufacturing environments combining rule-based
and machine learning techniques.
Roy, S., & Chowdhury, P. (2019). The authors
propose a real-time anomaly detection system for
industrial IoT applications.
3 TOOLS USED
3.1 Apache Kafka
Kafka is utilized for data streaming with efficient
collection, processing and dissemination of large
volumes of operational data from various sources.
3.2 Amazon S3
S3 is used to store all factory data, including sensor
readings, anomaly detection results, and historical
data.
3.3 Python
Python is the primary programming language used in
this research because of its extensive libraries and
frameworks supporting data analysis, machine
learning, and data visualization.
3.4 Scikit-learn
Scikit-learn is used to implement various machine
learning models which includes Isolation Forest and
Autoencoder which detects anomaly through
supervised and unsupervised learning techniques.
3.5 TensorFlow/Keras
TensorFlow, along with its high-level API Keras, is
utilized for developing and training deep learning
models, especially for Autoencoder architectures.
3.6 Tableau
Tableau is used for visualizing the results of anomaly
detection, providing insights into operational trends,
anomalies, and key performance indicators, thereby
enabling better decision-making based on data.
3.7 Colab Notebook
It is used in this research for developing and
documenting overall data analysis and machine
learning workflow.
INCOFT 2025 - International Conference on Futuristic Technology
684
3.8 Amazon athena
A serverless interactive query service that allows
users to analyse data stored in Amazon S3 using
standard SQL. It simplifies querying large datasets
and integrates seamlessly with the AWS ecosystem
for data storage and analysis.
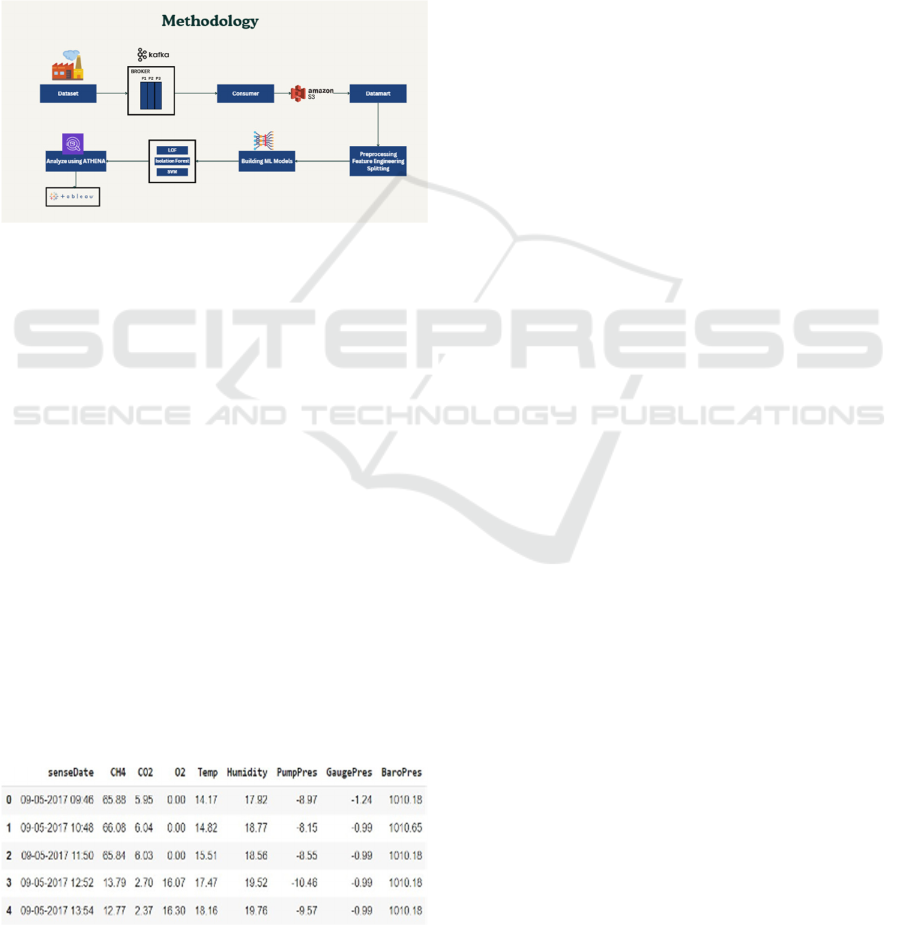
4 METHODOLOGY
Figure 2: Methodology Diagram
4.1 Collection of Diverse records from
industry for database:
The foundation of our research is built upon two
key datasets each serving a critical role in monitoring
industrial operations and detecting anomalies:
4.1.1 Dataset
This dataset comprises sensor readings from various
chemical and environmental parameters, including
methane (CH4), carbon dioxide (CO2), oxygen (O2),
temperature, humidity, pump pressure, gauge
pressure, and barometric pressure. These
measurements are essential for tracking gas
emissions, environmental conditions, and ensuring
regulatory compliance. Anomalies in this data can
indicate potential leaks, hazardous gas levels, or
equipment malfunction, which could impact both
safety and operational efficiency.
Figure 3: dataset
4.2 Data Streaming Using Apache
Kafka
To facilitate real-time data processing and ensure
timely anomaly detection, we utilize Apache Kafka
as a distributed streaming platform. The architecture
consists of:
4.2.1 Producers
Sensors and equipment (pumps, bearings) act as
producers, sending real-time data to Kafka topics.
4.2.2 Consumers
Data processing applications subscribe to these topics
to consume and analyze the incoming data in real-
time.
4.3
Data Preprocessing
4.3.1 Data Cleaning
4.3.2 Removing Duplicates
Scan the datasets to identify and remove duplicate
entries.
4.3.3 Handling Missing Values
Employ techniques such as interpolation for time-
series data or imputation based on domain knowledge
to handle missing data.
4.3.4 Correcting Erroneous Entries
Flag and correct unrealistic sensor readings (e.g.,
negative pressure values) based on expected
operational ranges.
4.4 Normalization
4.4.1 Min-Max Scaling
This technique transforms the feature values to a
fixed range, usually [0,1]. Each feature value i, x is
transformed using the formula:
𝑥′ 𝑥𝑖 𝑚𝑖𝑛𝑋/𝑚𝑎𝑥𝑋 𝑚𝑖𝑛𝑌
Standard Scaler is applied to normalize sensor
data, ensuring all features have a mean of 0 and a
standard deviation of 1. This helps the models like
Predictive Monitoring and Anomaly Detection in Industrial Systems
685
Isolation Forest and One-Class SVM to perform
efficiently without being affected by the scale of the
data.
𝑧𝑥𝑖𝜇/𝜎
Figure 4: Z-score
Moving averages and moving standard deviations
are computed over a sliding window for key
variables. For instance, the rolling mean and standard
deviation of methane (CH4) and temperature are
calculated to smooth out short- term fluctuations and
highlight longer-term trends or shifts.
4.5
Timestamp Alignment
In industrial settings, data from multiple sensors and
sources is often recorded at different times. Aligning
these timestamps is critical for analysis, especially
when dealing with time-series data. The process
involves:
4.5.1 Synchronizing Data:
All datasets are synchronized to a common
timestamp, ensuring that data points from different
sensors corresponding to the same time are grouped
together.
Resampling: In the cases where the data is
recorded at some intervals which are inconsistent, we
employ resampling techniques to create a uniform
time- series dataset. We use this to achieve desired
frequency using up-sampling and down-sampling.
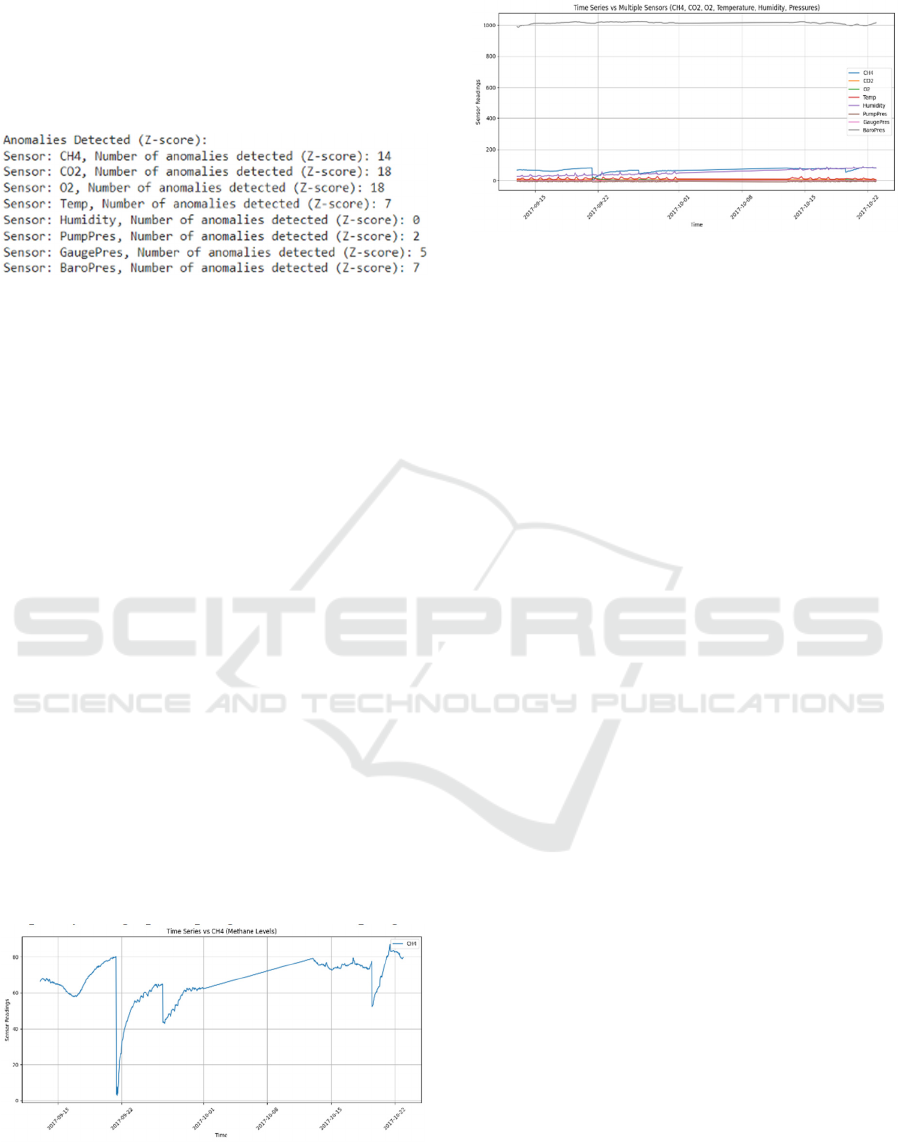
Figure 5: Time Series vs CH4
Figure 6: Time series vs Multiple sensors
4.6 Storage of the data
All the preprocessed data is stored securely in
Amazon S3 bucket. It provides durability and
scalability, and enables efficient access to the data for
model training and analysis.
4.7
Feature Engineering
The feature engineering step is very necessary in
developing machine learning model. It enhances
efficiency and accuracy of the model. This process
involves:
4.8
Moving Average:
We generated moving average features for sensor
readings (e.g., temperature, humidity, and pressures)
to capture trends and smooth out short-term
fluctuations. It tells us about inconsistent and
underlying issues in long-term trends.
4.9
Lagged Values Features
These values were created to check past sensor
readings, which can enable our model to learn from
the historical data and identify some temporal
patterns with anomalies.
4.10
Seasonality Indicator
The features which indicates the seasonal patterns
(e.g., a time of day, a day of week ) were created to
check for some periodic behaviour in sensor readings.
4.11
Trend Features
The features which captured the overall trend of time-
series data which helps our models to recognize the
INCOFT 2025 - International Conference on Futuristic Technology
686
long-term increase or decrease in the sensor
measurements.
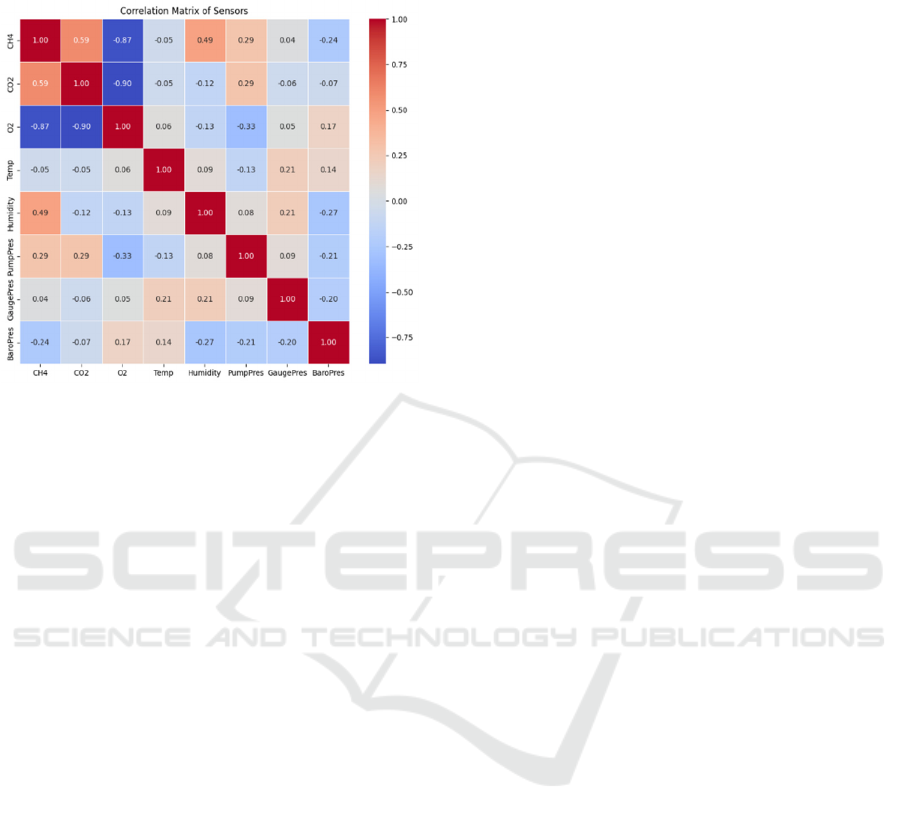
Figure 7: Correlation matrix
4.12 Distance Metrics
4.12.1 Euclidean Distance
The Euclidean distance is used in the pumps anomaly
detection between the two points x and y in n-
dimensional space is calculated as:
𝑛
𝑑(𝑥, 𝑦) = √∑(𝑥𝑖 − 𝑦𝑖)
2
𝑖=1
This metric is used in clustering to the group
which has similar operational parameters, such as
barometer, gauge pressure and temp readings from
chemical sensors and pumps to identify outliers in our
data, considering the correlations among the various
features. For example, while monitoring gas
emissions (CH4, CO2, O2) alongside temp and
humidity, Euclidean metric helps us to detect
anomalies by examining how far a point is from the
predicted distribution of normal data.
4.12.2 Manhattan Distance
Computes the distance between two points by
summing the absolute differences of their
coordinates. This distance is particularly used in grid-
like structures and high-dimensional space.
𝑛
𝑑(𝑥, 𝑦) = ∑ |𝑥𝑖 − 𝑦𝑖|
𝑖=1
4.13
Machine Learning Models
Now we will explore various machine learning
models in our project for anomaly detection, with a
study on the following four:
4.13.1 Isolation Forest
This is an ensemble learning method which is
specifically made for anomaly detection in
operational data. This algorithm operates by
constructing a large multitude of decision trees.
Unlike the traditional methods which profile normal
data points, Isolation Forest can isolate anomalies
based on the method that anomalies are different and
few. This process involves randomly selecting of a
feature and then again selecting a split value in
between the max and min value of that particular
feature. Anomalies tend to have shorter paths in the
tree structure as they are very less, which can make
them easier to isolate. This machine learning model is
highly efficient for high-dimensional datasets which
makes it suitable for very complex industrial
applications.
4.13.2 Local Outlier Factor (LOF)
This is a density-based anomaly detection algorithm
which we are using for detection technique which can
identify the anomalies by comparing all the local
density of a point to all of its neighbours. This
measures local density deviation of a particular data
point with respect to its neighbours. If a given point
has a significantly lower density compared to its
neighbours, it is then considered as an outlier. Local
Outlier Factor is particularly effective in identifying
local outliers in our dataset where the density is
varying significantly across different regions. This
density characteristic is very beneficial for detecting
anomalies in industrial data, where normal behaviour
can vary based on the environmental factors.
4.13.3 One-Class Support Vector Machine
(SVM)
The One-class SVM is a variation of the traditional
Support Vector Machine algorithm used for anomaly
detection tasks in data. It learns the boundaries of the
normal dataset by creating a decision function which
encapsulates the max of the data points in the dataset.
The points which fall outside the boundary are been
classified as anomalies. One-Class SVM is very
useful in the scenario where labelled anomalies are
not much frequent, as it primarily relies on the normal
data for some training. This model is very effective
Predictive Monitoring and Anomaly Detection in Industrial Systems
687
for some high-dimensional data which makes it
suitable for applications of industries with sensor
data.
4.13.4 Robust Covariance
The Robust Covariance method in machine learning
is an approach which estimates the covariance of a
data in such a manner that is less sensitive to the
outliers. Unlike the covariance estimation methods,
which can be influenced by anomalous data points,
robust covariance uses the techniques like Minimum
Covariance Determinant to provide with a more
stable estimation of the data variance and the
correlation structure. This method is very useful in
industrial stations where sensor data may be filled
with outliers, allowing for better and accurate
anomaly detection.
After training all the models and evaluating their
individual performance, we will focus on analyzing
the results and visualization using Tableau.
Visualizing the model outputs with the unstructured
data can reveal the critical findings into the
operational part and guide some maintenance
strategies.
5 RESULTS AND DISCUSSIONS
The anomalies detected are in similar number for
many of the sensors and algorithms, it just shows how
interconnected all the values of sensors are , so it’s
better to compare only 1 sensor value for our results
to show better analysis and reduce redundant
analysis.
The dataset is highly correlated which proves that
the systems are interdependent on each other causing
similar anomalies.
5.1 Isolation Forest Algorithm
5.1.1
Effectiveness of the Algorithm
This algorithm is unsupervised learning method
which isolates the anomalies by randomly selecting
features and splitting the data, and the most easily
isolated data is flagged as anomaly. This works
greatly for higher dimensionality of data where the
usual methods fail. The results prove that we can
detect unusual patterns in all the sensor readings.
5.1.2 Sensitivity Factor
The sensitivity of the model is based on parameters
like contamination factor which tells us about the
expected anomalies in the dataset or an estimate about
the anomalies. Adjusting this would either increase or
decrease the number of detected unusual patterns in
the data which in turn affect the recall and precision
of the model. A balance has been achieved by the
results in detecting actual anomalies and minimizing
the fake anomalies or the false positives.
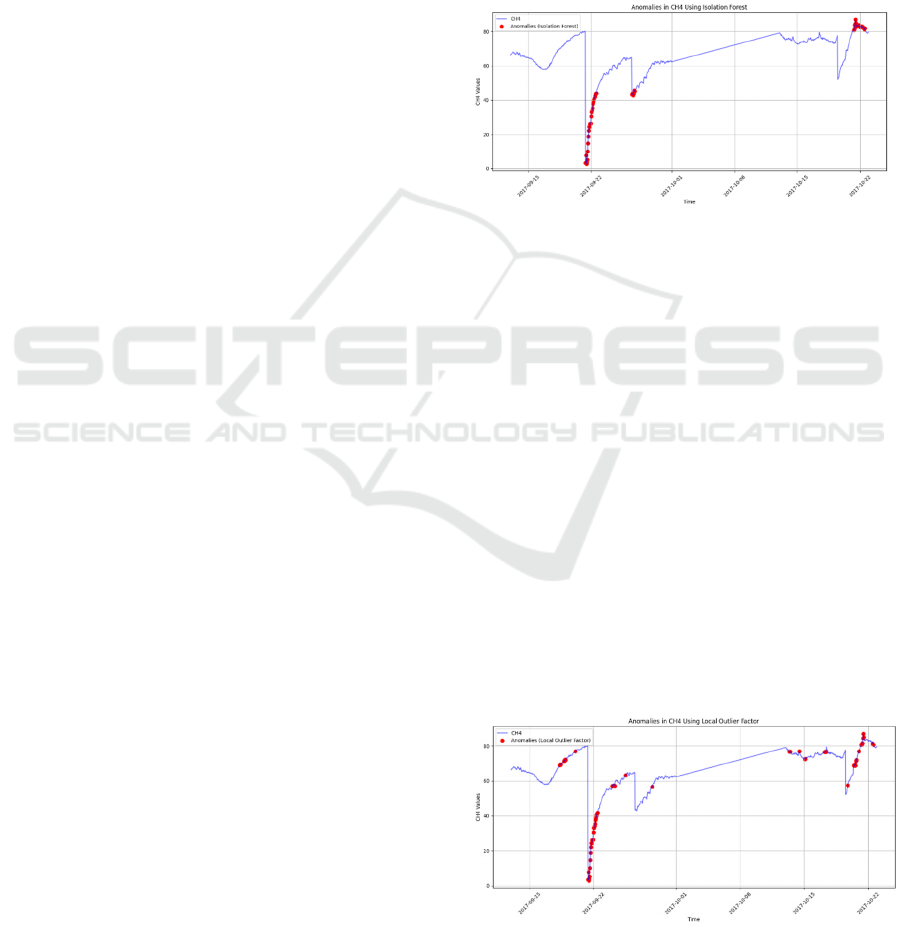
Figure 8: Anomalies in CH4 over time
The plot shows anomalies detected in groups and
clusters especially around the steep drops or steep rise
in sensor values, isolation forest is very effective in
detecting these steep changes especially in early
September and near October as shown in figure. It
shows a strong and balance anomaly detection across
all the parameters.
5.2 LOF
Local Outlier Factor is good for detecting anomalies
and varying trends in various times where the data has
varying spread of points or collection of points at one
point or a dense distribution.
LOF focuses on measuring the density of points
which are local to identify the data which does not fit
in. This is a very effective algorithm for datasets of
higher dimension which are very common in
industrial scenarios.
Figure 9: Anomalies in CH4 using Local Outlier Factor
INCOFT 2025 - International Conference on Futuristic Technology
688
It also detects anomalies in areas with sudden
changes in trend but mostly picks up anomalies in
areas with higher density regions , where the value of
sensor changes in drastic ways as shown in figure
above.
This is a good way to catch anomalies which
isolation forest cannot detect where there are less
significant changes in values, which in turn suggests
that it is sensitive to local density variations.
5.3 Robust Covariance
This is a mathematical statistics based approach used
to get a guess of the covariance of a dataset while
minimizing the effect of the anomalies.
This is a technique useful in outlier detection
where datasets structure could be distorted by these
values. It uses gaussian distribution to detect
anomalies in effective way.
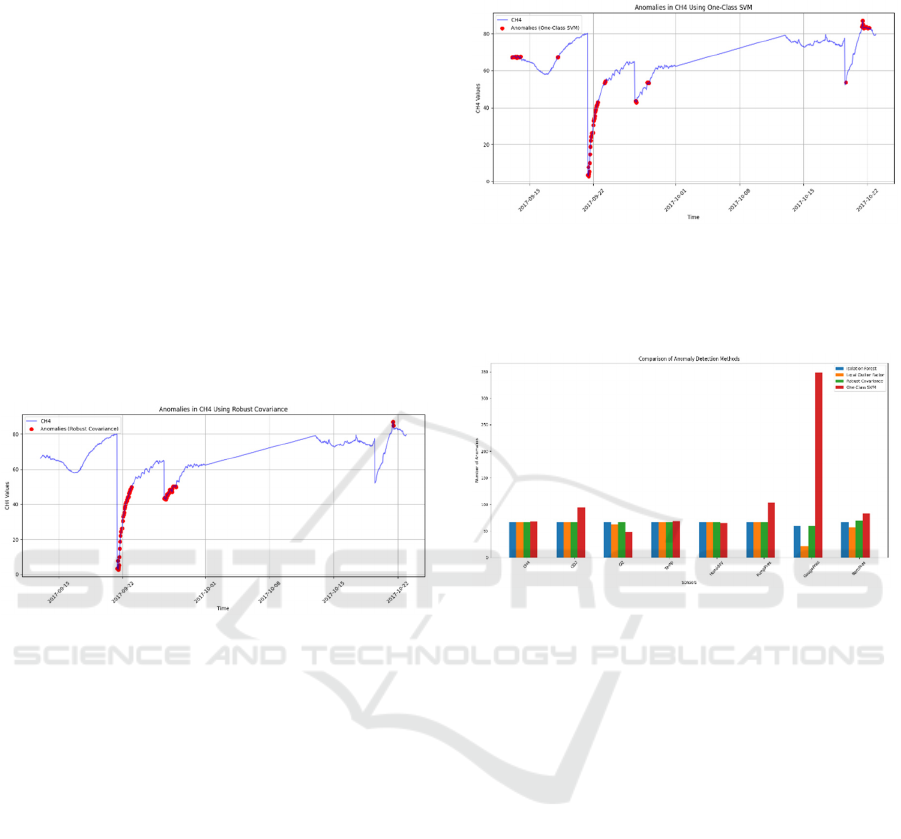
Figure 10: Anomalies in CH4 using Robust Covariance
It is usually able to detect anomalies in similar or
lesser proportion as compared to other algorithms, it
flags anomalies which are having a greater deviation.
This method is largely conservative as it does not
detect anomalies in gradual changes like LOF. The
data is giving similar anomalies for this algorithm,
which suggests that LOF and Robust Covariance are
equally effective for this dataset but with a slight edge
towards robust covariance.
5.4 One- Class SVM
One-Class SVM’s results are influenced by
parameters like kernal type and regularization of data.
With changesin these parameters, we can adjust how
sensitive the model is and because of such
adjustments it could also over-detect the number of
anomalies which you could see in gauge pressure
chart which is shown in comparative analysis of
various algorithms below.
It excels at flagging anomalies with non linear
trends making it one of the better options for this
dataset as compared to many other algorithms. But it
is much more sensitive which makes it over detect
anomalies.
Figure 11: Anomalies in CH4 using One-Class SVM
5.5 Comparative Analysis of
Algorithms
Figure 12: Comparison of anomaly detection methods
Overall Performance of Robust Covariance and
Isolation Forest were quiet similar and balanced in
terms of detection of anomalies. Robust Covariance
is preferred whenever there is a need for conservative
approach.
Local Outlier Factor excels for sensors like
Temperature and Humidity where local density was a
major factor influencing the model. It was less
effective for gauge and barometric pressures as it
might have missed anomalies with lesser densities. It
shows some high performance for Gauge pressure but
that is also a result of sensitivity , which may have
caused the model to falsely flag non anomalous data
also. But for majority of the sensors it showed poor
performance especially for the main “CH4” sensor
where other algorithms performed better.
5.6 Ensemble Learning
All the models which you could see above are merged
or their predictions are taken on whether a datapoint
is normal or an anomaly and based on the majority
decision we classify the point as anomaly.
Predictive Monitoring and Anomaly Detection in Industrial Systems
689
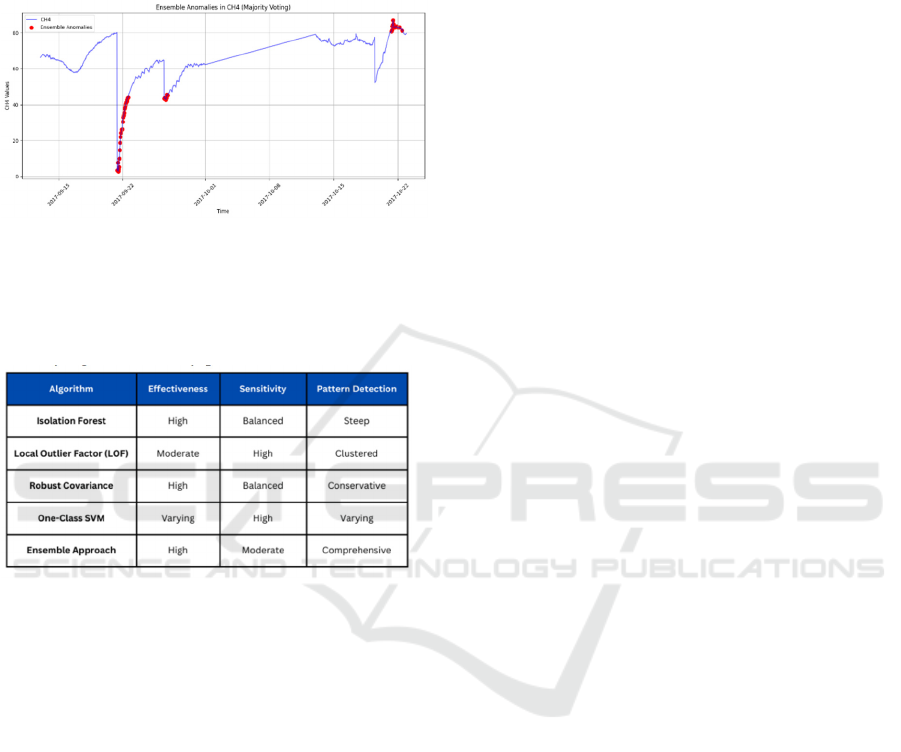
So if 3 of 4 models classify a point as something
which is deviating from the usual trend we have to
flag it as anomaly. This approach is very good for
removing false positives or data which is falsely
labelled as an anomaly.
Figure 13: Ensemble anomalies in CH4
Therefore it makes ensemble learning a very
reliable way to detect anomalies as it works on basis
of majority vote and is helpful in not falsely
identifying non-anomaly points.
Figure 14: Comparison between different anomaly
detection methods
6 CONCLUSIONS
We can say that this research presents a proper real-
time anomaly detection system tailored towards oil
and gas industry with real time data-streaming and
real time notifications through smtp client sent to the
officials in- charge.
By using various machine learning approaches
like isolation forest, local outlier factor, support
vector machine , robust covariance and also an
ensemble of all the models we have tried to get the
best way in which the anomalies could be detected.
Isolation Forest and Robust Covariance Factor
seemed to give the most accurate results and were
great at detecting most of the deviations in the data
which is very important in industrial system on an
individual level. Models Like Local Outlier Factor
and Support Vector Machine excelled at detecting
anomalies in high density sensor data . Ensemble of
these models just made the systems more reliable and
trust worthy as it made sure that the detected
anomalies were taken on basis of majority vote ,
thereby excluding the false positives
Implementation of these systems in real time
would just improve the outputs and reduce any
manual efforts in detection of these anomalies. These
systems would also reduce any manual errors which
may occur and also enhance the safety and boost the
production without any delays because of
maintenance related delays.
ACKNOWLEDGEMENTS
We are extremely thankful to Mrs. Shailaja Uke, Mrs.
Sangita Jaybhaye and Mrs. Archana Burujwale for
their guidance and support in this research. Their
consistent feedback and expertise in this domain has
greatly helped to give a proper direction to our work.
Additionally we are thankful to our institution for
providing us with the support we needed throughout
our research.
REFERENCES
Ahmed, M., Mahmood, A. N., & Hu, J. (2016). Techniques
for detecting network anomalies: A review of statistical
methods and machine learning approaches in industrial
settings. Journal of Network and Computer
Applications, vol. 84, pp. 23-45. DOI:
10.1016/j.jnca.2017.07.001.
Hodge, V. J., & Austin, J. (2004). Outlier detection
techniques: A survey of machine learning methods and
their applications in industrial environments. Artificial
Intelligence Review, vol. 22, no. 2, pp. 85-126. DOI:
10.1023/B0000045506.53593.b3.
Zong, B., et al. (2018). A novel model combining deep
autoencoders with Gaussian mixture models for
anomaly detection in industrial datasets.
Neurocomputing, vol. 268, pp. 92-99. DOI:
10.1016/j.neucom.2017.07.019.
Wang, F. Y., et al. (2018). Development of a real-time
anomaly detection system using machine learning
techniques for IoT applications in industrial settings.
IEEE Transactions on Industrial Informatics, vol. 14,
no. 4, pp. 1786-1795. DOI: 10.1109/TII.2017.2783939.
Yu, L., et al. (2018). Comparative effectiveness of machine
learning methods for detecting anomalies in industrial
processes. Expert Systems with Applications, vol. 95,
pp. 116-125. DOI: 10.1016/j.eswa.2017.11.003.
Munir, A., & Saeed, M. (2020). Predictive maintenance
techniques: A review of machine learning methods for
anomaly detection in industrial settings. Computers in
INCOFT 2025 - International Conference on Futuristic Technology
690

Industry, vol. 121, pp. 103241. DOI:
10.1016/j.compind.2020.103241.
Alhassan, S. A. T., et al. (2021). Challenges in applying
machine learning for anomaly detection in IoT
environments and future research directions. IEEE
Internet of Things Journal, vol. 8, no. 12, pp. 9860-
9872. DOI: 10.1109/JIOT.2021.3055323.
Choudhary, S., & Patel, P. (2021). Effectiveness of ARIMA
models for time series forecasting in chemical
processing and operational deviation detection. Journal
of Loss Prevention in the Process Industries, vol. 68,
pp. 104306. DOI: 10.1016/j.jlp.2020.104306.
Liu, Y., et al. (2021). Anomaly detection in industrial
control systems: Exploring different machine learning
approaches and their performance metrics. IEEE
Access, vol. 9pp. 32057-32066. DOI:
10.1109/ACCESS.2021.3054936.
Iglewski, J., & P. B. (2019). Framework for real-time
anomaly detection in manufacturing systems using
machine learning techniques and data integration.
Computers in Industry, vol. 106, pp. 1-13. DOI:
10.1016/j.compind.2018.11.007.
Ghafoor, K., et al. (2020). Effectiveness of deep learning
methods for detecting anomalies in industrial time
series data: A comparative analysis. Applied Sciences,
vol. 10, no. 9, pp. 3222. DOI: 10.3390/app10093222.
Zhang, Y., & Jiang, H. (2019). Methods for anomaly
detection in industrial applications: Integration of
machine learning and domain knowledge. Journal of
Process Control, vol. 78, pp. 29-39. DOI:
10.1016/j.jprocont.2019.02.005.
Li, Y., et al. (2021). Anomaly detection framework for
predictive maintenance in industrial settings utilizing
sensor data and machine learning models. Journal of
Manufacturing Systems, vol. 58, pp. 239-254. DOI:
10.1016/j.jmsy.2020.10.008.
Marjanovic, O., et al. (2020). Hybrid approach for anomaly
detection in smart manufacturing environments:
Combining rule- based and machine learning
techniques. Computers in Industry, vol. 118, pp.
103219. DOI: 10.1016/j.compind.2020.103219.
Roy, S., & Chowdhury, P. (2019). Real-time anomaly
detection system for industrial IoT applications:
Addressing data variability and noise challenges. IEEE
Transactions on Industrial Informatics, vol. 15, no. 4,
pp. 2248-2257. DOI: 10.1109/TII.2019.2934487.
Predictive Monitoring and Anomaly Detection in Industrial Systems
691
