
Comparative Study of LSTM-Models to Forecast Millet Production
in India
Bhramara Bar Biswal
1
, Satyanarayan Sahu
2
, Satya Narayan Das
1
, Prahallad Kumar Sahu
1
,
Shibani Tripathy
1
, Agni Tanmaya Behera
3
, Soumya Ranjan Mishra
1
, Ashutosh Mallik
3
and Shobhan Banerjee
4
1
Department of CSA, GIET University, Gunupur, Odisha, India
2
Department of CSE, CUTM, Jatni, Odisha, India
3
Department of CSE, GIET University, Gunupur, Odisha, India
4
Department of CSE, Indian Institute of Information Technology - Ranchi, Jharkhand, India
Keywords: Millet Consumption, Time Series Analysis, LSTM, Vanilla LSTM, Bidirectional LSTM, Convolutional
LSTM
Abstract: The production of millets has been extensively emphasized these days. Due to their high intrinsic qualities
and fewer requirements, the government is also trying to promote the production and consumption of millet
in the form of various millet missions. Due to limitations in the size of the data available, it becomes extremely
challenging to fine-tune the model in the context of limited availability. In this paper, we have attempted to
predict the consumption of millet in the Indian market using various variants of Long Short-Term Memory
(LSTM) models and compared their performances to predict the requirements of Jowar, Bajra, Ragi, and other
minor millet to see whether the forecast can meet the overall aggregated requirement or not. Both aggregate
and granular level forecasts have been analyzed to come up with a solution especially where the market is
booming, and data availability is constrained.
1 INTRODUCTION
The cultivation of millet has garnered significant
endorsement from both the central and various state
governments in contemporary times. This advocacy
is attributed to the superior nutritional profile of
millets when juxtaposed with other cereals, including
wheat and rice. While wheat serves as a
commendable source of Vitamin B, it is also
associated with gluten, which may provoke allergic
reactions, gastrointestinal disturbances, and adverse
consequences for gut health. In comparison, rice
exhibits a deficiency in fiber and micronutrients
relative to millet. Millet contains essential minerals
like magnesium, phosphorus, potassium, calcium,
iron, and Vitamin B. Notable advantages of millet
encompass a high fiber concentration, a low glycemic
index, the absence of gluten, and a wealth of
antioxidants.
Governmental bodies are undertaking numerous
initiatives aimed at augmenting millet production,
fostering awareness, facilitating market development,
ensuring sustainability, and formulating relevant
policies for millet agriculture. This endeavor is
congruent with global initiatives focused on
enhancing food security, advancing nutritional
quality, and promoting sustainable agricultural
methodologies.
The multifaceted nature and robustness of millet
significantly contribute to this initiative, considering
their diverse cultivation characteristics. Millets
exhibit a reduced water requirement for cultivation,
thereby enabling growth in regions characterized by
minimal precipitation. Millet demonstrates
remarkable adaptability to soils that are marginal or
of suboptimal quality. Their growth cycle generally
spans from two to four months, facilitating multiple
cropping opportunities throughout the year and
rendering them appropriate for production in areas
experiencing seasonal constraints. In addition to their
water needs, the demand for fertilizers and pesticides
in millet cultivation is notably low due to their
inherent resilience to pests and diseases when
compared to other cereal crops, thereby presenting a
cost-efficient option for farmers facing financial
Biswal, B. B., Sahu, S., Das, S. N., Sahu, P. K., Tripathy, S., Behera, A. T., Mishra, S. T., Mallik, A. and Banerjee, S.
Comparative Study of LSTM-Models to Forecast Millet Production in India.
DOI: 10.5220/0013583000004664
Paper published under CC license (CC BY-NC-ND 4.0)
In Proceedings of the 3rd International Conference on Futuristic Technology (INCOFT 2025) - Volume 1, pages 631-637
ISBN: 978-989-758-763-4
Proceedings Copyright © 2025 by SCITEPRESS – Science and Technology Publications, Lda.
631
challenges. Consequently, in light of prevailing
climatic conditions, the cultivation of millet is
imperative for the future of sustainable agriculture
and the satisfaction of human nutritional
requirements.
Authors in (Diene, et al. 2024) have addressed the
variability in pearl millet yield based on distance,
using UAV-based proxy sensing and ML. In
(Sankararao, Rajalakshmi, et al. 2022), the authors
have attempted to identify canopy water stress in
pearl millet using a UAV-based HSI sensor,
leveraging five ML-based feature selection
techniques. A blockchain smart contracts-based
method has been used in (Ning, Wang, et al. 2023) to
track millet information in the agricultural supply
chain. Authors in (Diack , et al. 2024) have estimated
the fraction of green cover for millet, using a
framework combining the green cover data Sentinel-
2 images. Machine Learning has been used to study
the reduction of obesity among children using the
nutritional contents of millet.
In (Suryo, Mustika, et al. 2019), the authors have
compared the RMSE values of LSTM with
the backpropagation algorithm, concluding the
effectiveness and improvement of LSTM over the
latter in the agricultural sector. A data discovery and
visualization tool has been presented in (Dhaliwal,
Galbraith, et al. , 2023) for time-series analysis in
agriculture. A time-series optimization and
forecasting task has been performed using
the Random Forest and ARIMA model in (Banerjee,
Banerjee, et al. , 2022). A comparative analysis
between deterministic and probabilistic time series
approaches has been performed by authors in
(Banerjee, Banerjee, et al. , 2023). LSTM RNNs have
been explained in detail in (Staudemeyer and Morris,
2019).
The challenge with millet consumption is that this
domain is new in the market as of now and sufficient
data is not available. The task is the generate
appropriate forecasts with the limited data available
in hand. In this paper, we have used various variants
of LSTMs namely – Vanilla LSTM, Stacked LSTM,
Bidirectional LSTM, Convolutional LSTM, and
LSTM to study their quality of forecasts with respect
to millet consumption. This is just an approach to
analyze whether the deep learning-based LSTM
models can generate quality forecasts based on
limited data or not.
2 DATA DESCRIPTION
2.1 Data Source
The data has been acquired by the data published by
the Indian Institute of Millets Research (IIMR),
which consists of data individually corresponding to
Finger Millets (Ragi), Pearl Millet (Bajra), Sorghum
(Jowar), and other minor millets. The data has been
made available since 1966-67 up to 2019-20. The
recent data has been acquired from the Agricultural
and Processed Food Products Export Development
Authority (APEDA) up to 2023-24.
2.2 Exploratory Data Analysis
Missing values were imputed with average
values.
Figure 1: Ragi Production
Figure 2: Bajra Production
INCOFT 2025 - International Conference on Futuristic Technology
632
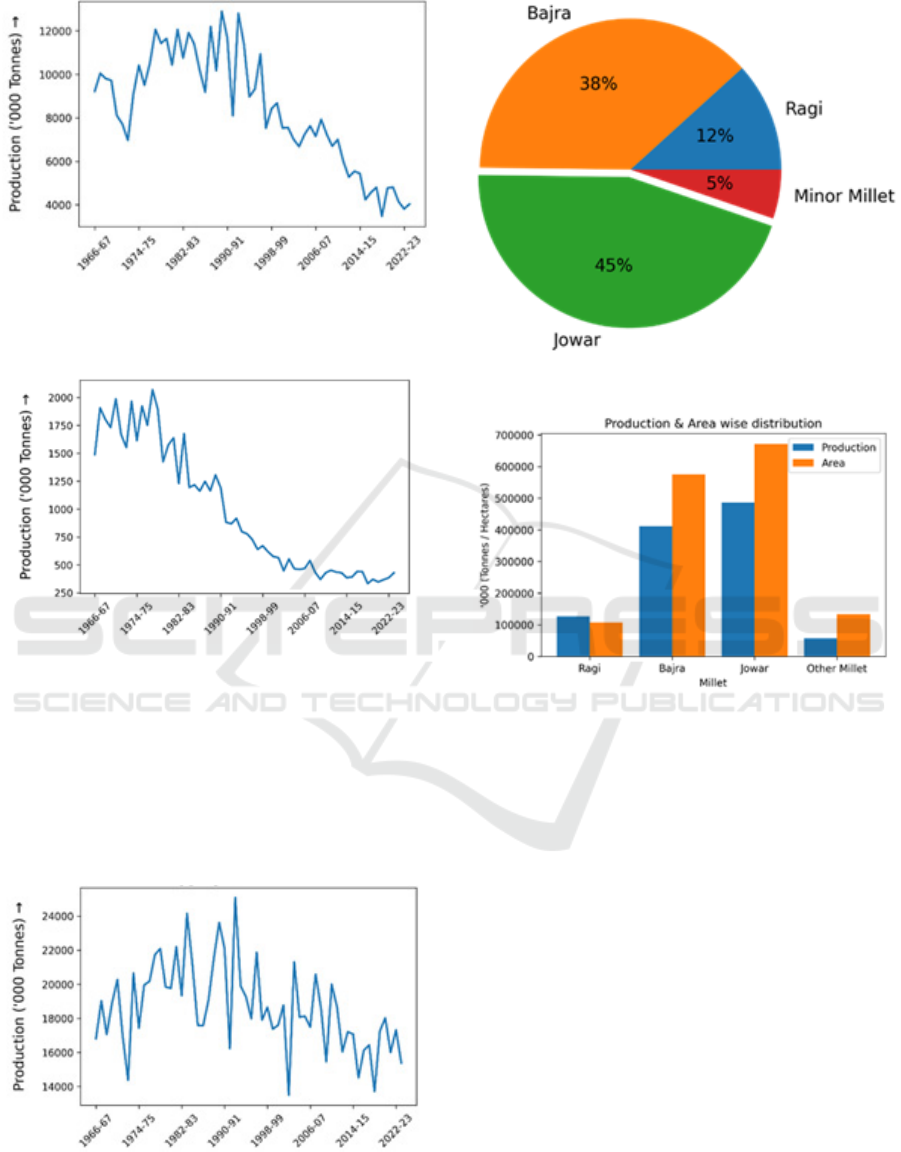
Figure 3: Jowar Production
Figure 4: Minor Millet Production
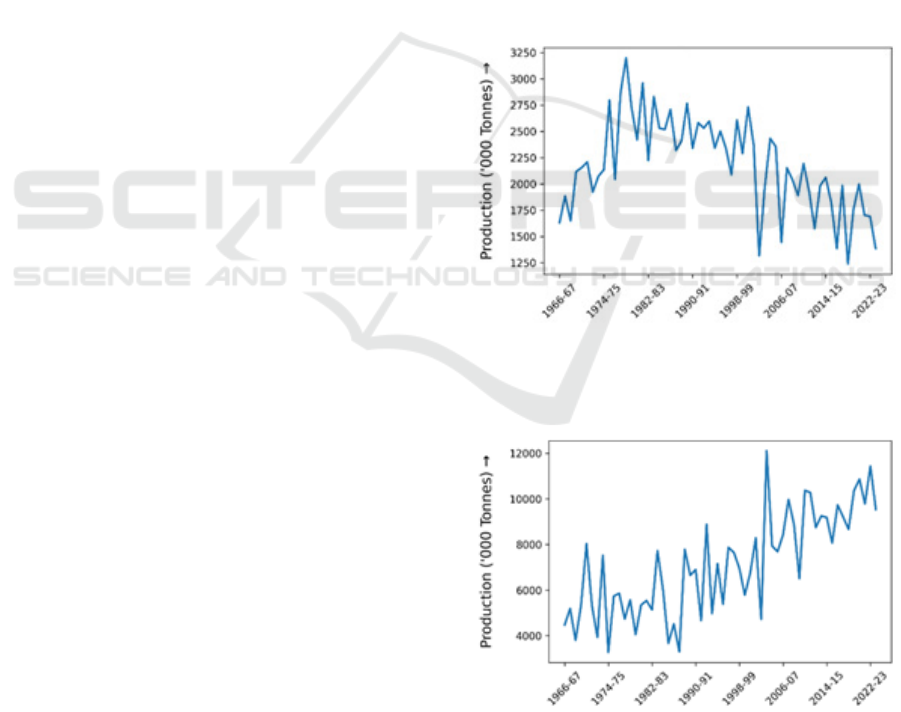
The data from both sources were merged followed
by which their distributions were plotted. Figs. 1 to 4
show the production of Ragi, Bajra, Jowar, and Minor
Millet over the years. Figure 5 shows the aggregate
production of all the variants of millet over the years.
We see that the overall trend is decreasing as of now,
but ragi production is increasing over the years.
Figure 5: Aggregate Production of millet over the years
Figure 6: Distribution based on production volume
Figure 7: Production & Area wise distribution
The pie chart in Figure 6 represents the overall
production percentages of each variant of millet in
India. We see that the variant widely produced across
India is Jowar. Figure 7 shows the total production
and area distribution for each variant of millet in
consideration. Here we also see that the total area
needed for the cultivation of Jowar is also the highest
and the production of Ragi is the least so far all over
India, even when compared to minor millet
cultivation.
3 LSTM – RECURRENT NEURAL
NETWORKS
Long Short-Term Memory Networks (LSTMs) are a
specialized type of recurrent neural network (RNN)
designed to effectively learn and remember patterns
in sequential data over long periods. Introduced to
Comparative Study of LSTM-Models to Forecast Millet Production in India
633
address the vanishing gradient problem that
traditional RNNs face, LSTMs utilize a unique
architecture featuring memory cells, input gates,
output gates, and forget gates. This structure allows
them to selectively retain or discard information,
making them particularly well-suited for tasks such as
natural language processing, speech recognition, and
time series forecasting. By maintaining a memory of
previous inputs while processing new data, LSTMs
can capture complex dependencies and trends within
sequences, leading to improved performance in
various applications.
Here we’ve used various variants of LSTMs to see
whether or not are they able to generate forecasts with
respect to the production of millet of each type in
consideration.
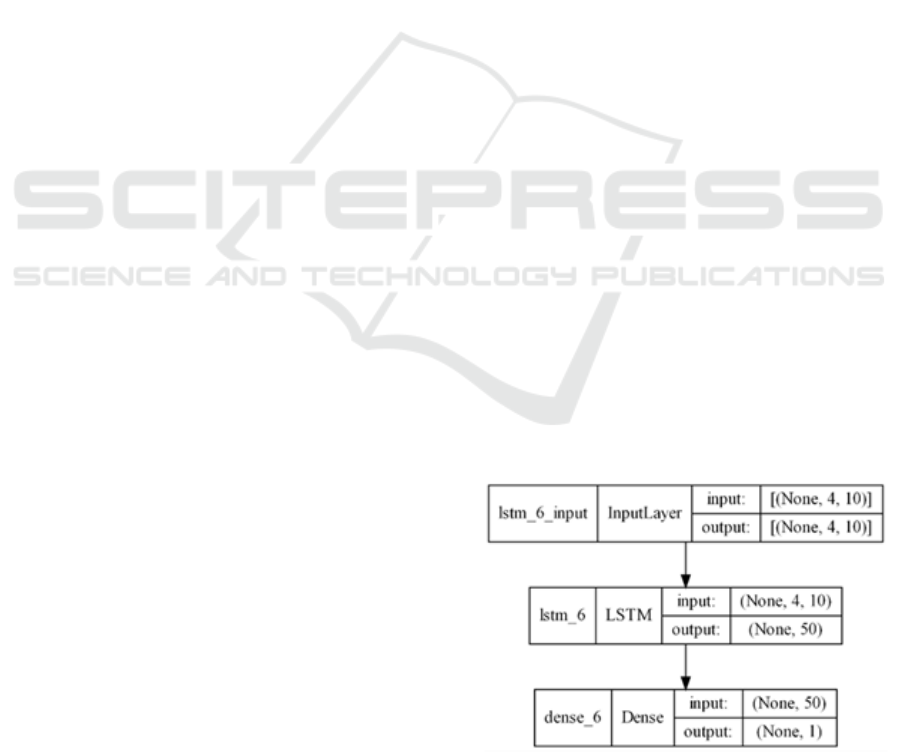
3.1 Vanilla LSTM
It refers to the standard implementation of Long
Short-Term Memory networks, which serves as the
foundational architecture for many advanced LSTM
variants. It consists of memory cells that can store
information over long sequences, helping to mitigate
issues like the vanishing gradient problem commonly
encountered in traditional recurrent neural networks.
Figure 8 shows the simple Vanilla LSTM
architecture used for our analysis.
3.2 Stacked LSTM
These architectures represent an advancement of the
fundamental Long Short-Term Memory (LSTM)
framework, which entails the superimposition of
multiple LSTM layers to augment the model's
capacity and enhance its proficiency in assimilating
complex representations. In a stacked LSTM
configuration, the output generated by one LSTM
layer is utilized as the input for the subsequent layer,
thereby enabling the network to effectively capture
hierarchical features present within the dataset. This
multi-tiered methodology significantly improves the
model's ability to discern intricate temporal patterns
and dependencies across diverse time scales. By
leveraging multiple layers, these networks can
improve performance on a wide range of applications
while also allowing for greater expressiveness in
modeling sequences. Figure 9 shows the Stacked
Vanilla LSTM as used for our analysis.
3.3 Bidirectional LSTM
Bidirectional LSTMs represent a sophisticated
modification of the conventional Vanilla LSTM
architecture, significantly augmenting the model's
proficiency in assimilating contextual information
from both antecedent and subsequent sequences. In
contrast to traditional LSTMs, which typically
process data in a unilateral direction (generally from
antecedent to subsequent), bidirectional LSTMs are
comprised of two distinct LSTM layers: one layer
processes the input sequence in a forward manner,
while the other layer undertakes the processing in a
reverse manner. This dualistic methodology enables
the network to acquire a holistic comprehension of
the temporal dynamics inherent in the data, as it is
capable of integrating information from both
temporal directions.
3.4 CNN LSTM
The integration of Convolutional Neural Networks
(CNNs) and Long Short-Term Memory networks
(LSTMs) in a CNN-LSTM architecture leverages the
distinct advantages presented by each model to
proficiently process and analyze spatio-temporal
datasets. The resultant output produced by the CNN
is subsequently utilized as the input for the LSTM,
which adeptly captures the temporal dependencies
inherent in the sequence of feature maps generated by
the CNN. This synergy allows the model to leverage
CNN's ability to identify spatial hierarchies while the
LSTM handles the sequential relationships over time.
Figure 11 shows the CNN LSTM used for our
analysis.
3.5 Convolutional LSTM
Convolutional LSTMs (ConvLSTMs) are a
specialized variant of CNN LSTMs, where the
convolutional layers replace the fully connected
Figure 8: Vanilla LSTM Architecture
INCOFT 2025 - International Conference on Futuristic Technology
634
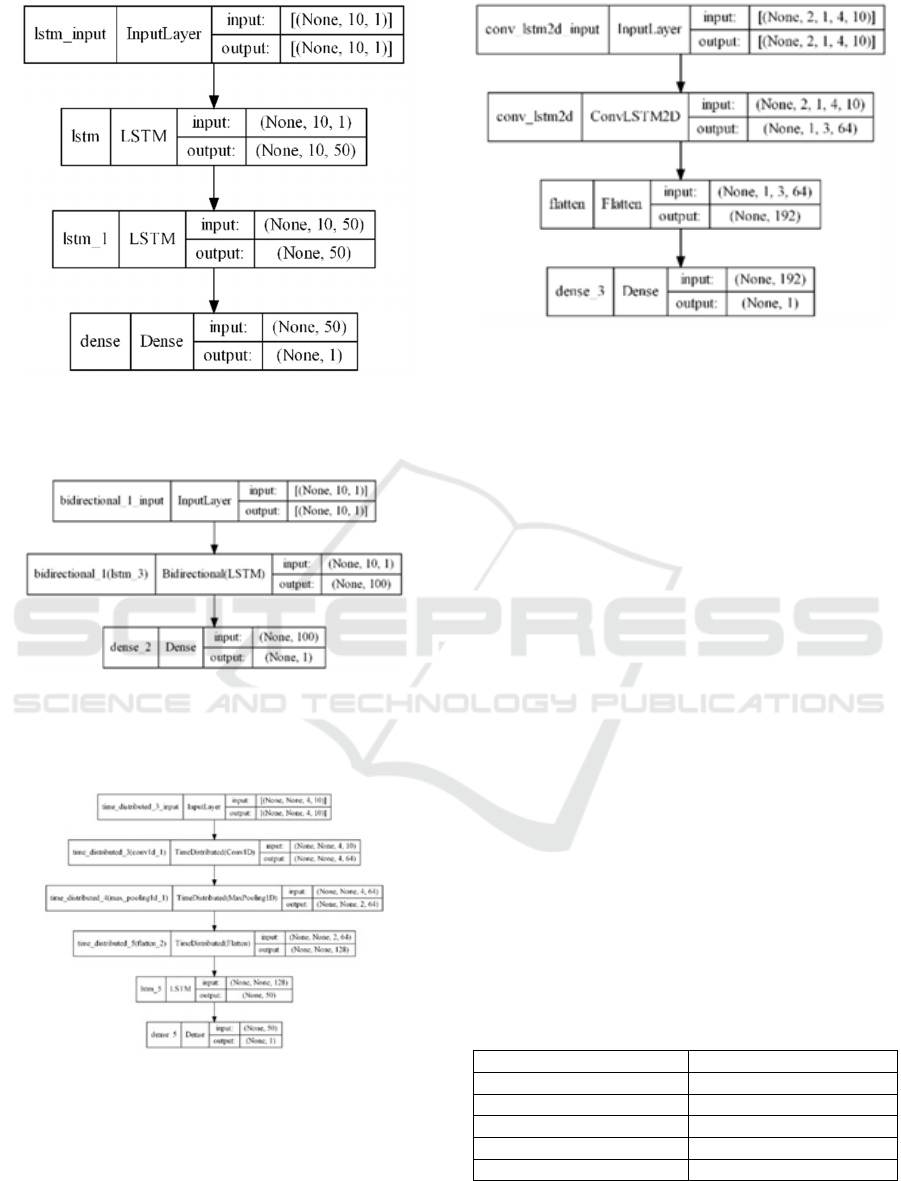
Figure 9: Stacked Vanilla LSTM Architecture
Figure 10: Bidirectional LSTM Architecture
Figure 11: CNN LSTM Architecture
layers found in standard LSTMs, enabling the model
to process input data as multi-dimensional arrays
rather than one-dimensional sequences. Figure 12
shows the Convolutional LSTM Architecture as used
for our analysis.
Figure 12: Convolutional LSTM Architecture
4 IMPLEMENTATION
The data acquired up to 2018-19 from IIMR has been
used to train the model. The data acquired from
APEDE has been used to test the model. This creates
a train set of 53 data points and a test set of 5 data
points corresponding the which the forecast will be
validated.
The Adaptive Moment Estimation (Adam)
optimizer has been used to train the model, since it
gives the benefits of both the RMSProp and
Momentum optimizers, hence adaptively adjusting
the learning rate. The mean-squared error has been
kept as the loss metric, which we are trying to
minimize during the training process. The Rectified
Linear Unit (ReLU) activation function has been used
across all the models. Since the data is not so big,
hence the batch size used in one pass has been set to
1, but the number of data points passed at a time will
be varied corresponding to which the RMSE values
will be calculated. The one that corresponds to the
lowest RMSE value will be finalized. The
hyperparameters along with their values have been
summarized in Table 1 below:
Table 1: Hyperparameters & their values
Paramete
r
Value
activation ‘relu’
o
p
timize
r
‘adam’
loss ‘mse’
n
_
features 1
n_seq 1
Comparative Study of LSTM-Models to Forecast Millet Production in India
635
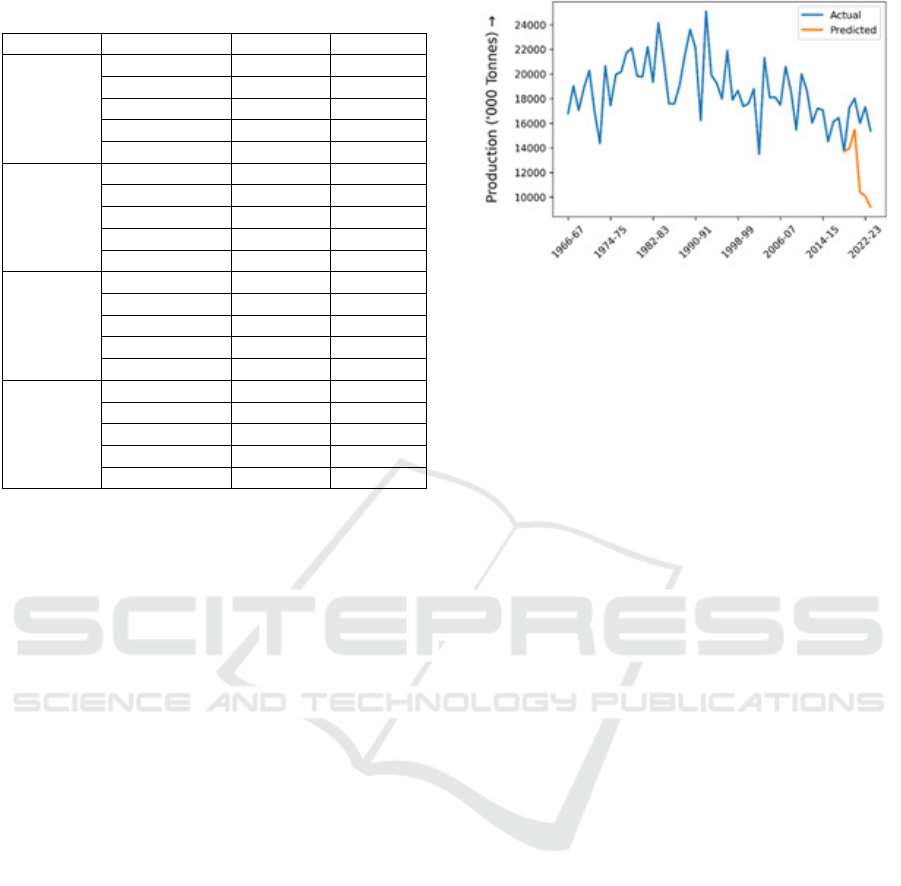
Table 2: n_step parameter values
Variant LSTM n
_
ste
p
s RMSE
Ragi
Vanilla 11 125.75
Stacke
d
12 151.39
Bidirectional 10 141.00
CNN 12 154.89
Convolutional 13 169.21
Bajra
Vanilla 14 720.08
Stacke
d
15 743.24
Bidirectional 10 736.07
CNN 20 856.97
Convolutional 20 614.41
Jowar
Vanilla 7 239.02
Stacke
d
7 251.46
Bidirectional 13 276.84
CNN 19 241.43
Convolutional 14 324.56
Minor
Millet
Vanilla 17 40.23
Stacke
d
20 37.92
Bidirectional 9 32.40
CNN 3 49.65
Convolutional 4 42.95
For each variant, for each LSTM, the
hyperparameter – n_steps were varied from 3 to 20
and the value corresponding to which the lowest
RMSE value was acquired had been chosen for the
final training of the model. Apart from the
Convolutional LSTM which was trained for 500
epochs due to its complex nature, the LSTMs were
trained for 200 epochs. The n_step parameter values
corresponding to the lowest RMSE have been
mentioned in Table 2.
From Table 2, we can see that the Vanilla LSTM
even though the simplest one, gave us the least value
of RMSE for Ragi, Bajra, and Jowar. Bidirectional
LSTM gave us the least RMSE corresponding to
minor millet. Hence, we proceed with the final
forecasts using these values of n_steps, training the
Vanilla and Bidirectional LSTMs for 200 epochs.
5 RESULTS AND DISCUSSION
After running the forecasts corresponding to each
variant for 5 years, their aggregate sum was
calculated. Figure 13 shows the aggregate forecasts
along with the actual values from 2019-20 to 2023-
24.
Figure 13: Aggregate Forecast
From Figure 13, we can clearly see that the exact
and predicted values have a lot of differences. But if
we visually analyze the trend of the aggregate curve,
after 1990-91 there has been a constant decrease in
the production and our forecasts lie in line with the
decreasing slope. This shows that based on the past
trends of the univariate data distribution, the
generated forecasts were up to the mark.
6 CONCLUSION AND FUTURE
SCOPE
Even after the generation of good-quality forecasts,
we see that there has been a good difference between
the forecast and the actual values. The increase in
production as depicted from the actual values might
be a consequence of the campaigns being run by the
government to enhance the consumption and hence
the production of millets.
This is where multivariate analysis comes into
the picture where there’s a need to analyze various
other factors such as awareness, marketing, subsidies,
etc. based on the availability of the data. This problem
will be addressed in our future works in a sequel to
this paper.
ACKNOWLEDGEMENTS
This work is inspired by the valuable insights and
guidance given by Mr. Shiv Charan Banerjee, Joint
Director – IT, National Informatics Centre, MeitY –
Jharkhand.
INCOFT 2025 - International Conference on Futuristic Technology
636

REFERENCES
S. Mansour Diene et al., "Improving Pearl Millet Yield
Estimation From UAV Imagery in the Semiarid
Agroforestry System of Senegal Through Textural
Indices and Reflectance Normalization," in IEEE
Access, vol. 12, pp. 132626-132643, 2024, doi:
10.1109/ACCESS.2024.3460107.
A. U. G. Sankararao, P. Rajalakshmi, S. Kaliamoorthy and
S. Choudhary, "Water Stress Detection in Pearl Millet
Canopy with Selected Wavebands using UAV Based
Hyperspectral Imaging and Machine Learning," 2022
IEEE Sensors Applications Symposium (SAS),
Sundsvall, Sweden, 2022, pp. 1-6, doi:
10.1109/SAS54819.2022.9881337.
Y. Ning, T. Wang, T. Liu, Z. Gao, L. Sun and H. Zhang,
"The Traceability of Millet Based on Blockchain Smart
Contracts in Agricultural Supply Chain," 2023 2nd
International Conference on Artificial Intelligence and
Blockchain Technology (AIBT), Zibo, China, 2023, pp.
65-70, doi: 10.1109/AIBT57480.2023.00020.
I. Diack et al., "Combining UAV and Sentinel-2 Imagery
for Estimating Millet FCover in a Heterogeneous
Agricultural Landscape of Senegal," in IEEE Journal of
Selected Topics in Applied Earth Observations and
Remote Sensing, vol. 17, pp. 7305-7322, 2024, doi:
10.1109/JSTARS.2024.3373508.
M. Birundadevi, G. Premalatha, M. Nalini, C. Iyyanar and
V. Arul, "A Machine Learning Strategy for Reducing
Childhood Obesity Using Millet," 2023 9th
International Conference on Smart Structures and
Systems (ICSSS), CHENNAI, India, 2023, pp. 1-6, doi:
10.1109/ICSSS58085.2023.10407542.
P. S. Budi Cahyo Suryo, I. Wayan Mustika, O.
Wahyunggoro and H. S. Wasisto, "Improved Time
Series Prediction Using LSTM Neural Network for
Smart Agriculture Application," 2019 5th International
Conference on Science and Technology (ICST),
Yogyakarta, Indonesia, 2019, pp. 1-4, doi:
10.1109/ICST47872.2019.9166401.
J. K. Dhaliwal, M. E. Galbraith, C. K. Leung and D. Tan,
"A Data Discovery and Visualization Tool for Visual
Analytics of Time Series in Digital Agriculture," 2023
27th International Conference Information
Visualisation (IV), Tampere, Finland, 2023, pp. 268-
271, doi: 10.1109/IV60283.2023.00053.
S. C. Banerjee, S. Banerjee and P. Rai, "Vaccine Supply
Optimization and Forecasting using Random Forest and
ARIMA Models," 2022 IEEE 3rd Global Conference
for Advancement in Technology (GCAT), Bangalore,
India, 2022, pp. 1-5, doi:
10.1109/GCAT55367.2022.9972154.
S. C. Banerjee, S. Banerjee and R. K. Jain, "Vaccine Supply
Forecasting and Optimization using Deterministic and
Probabilistic Approaches," 2023 2nd International
Conference for Innovation in Technology (INOCON),
Bangalore, India, 2023, pp. 1-5, doi:
10.1109/INOCON57975.2023.10101255.
Staudemeyer, R. C., & Morris, E. R. (2019, September 12).
Understanding LSTM -- a tutorial into Long Short-
Term Memory Recurrent Neural Networks. arXiv.org.
https://arxiv.org/abs/1909.09586.
Comparative Study of LSTM-Models to Forecast Millet Production in India
637
