
Usability Benchmarking of Data Analytic Tools with Market
Research for Decision-Making
Preethi Bitra, G K Mohan Devarakonda, Poodi Venkata Vijaya Durga, Jistnasai Upendra Kolapalli
and Ponnuru L N Prakash Kumar
Vishnu Institute of Technology, Bhimavaram, India
Keywords: Data Analysis, Business Intelligence, Data Visualization, Data Storytelling, Data-Driven Decision-Making,
Ease of Use, Governance, Security, Flexibility, Scalability.
Abstract: Data is the key for any Data Analytics application. To be a master in various fields like Data Science, Machine
Learning, Deep Learning, Computer Vision, Natural Language Processing, and Predictive analysis,
everything depends on perfect data maintenance. Also, the overfitting and underfitting analyses of various
popular models depend on the data that has been provided to them. To meet the requirements, several tools
emerged in the form of software, web versions, and command-line applications to make it easier to absorb
and analyze the data. Some of the latest data analysis tools include Tableau, Power BI, Alteryx, etc. Choosing
the right tool to perform the data analysis will give you a bit more success with the result. This paper attempts
to define the functionalities, advantages, and disadvantages of various data analysis tools on the market and
also attempts to produce a choice chart to help you select the right tool for your data.
1 INTRODUCTION
A collection of facts, statistics, measurements,
observations, or any other information recorded in an
organized or unorganized manner is referred to as
data (Sridevi, Bindu, et al. , 2017). It is the raw
material or input utilized to develop significant
insights, information, or actions through analysis,
interpretation, or processing. Text, numbers, photos,
music, video, and other forms can all exist as data.
Sensors, Polls, tests, Transactions, social media, and
other digital interactions can contribute. Databases,
Spreadsheets, files, and other data storage methods
are routinely used to store and organize data. Data is
the cornerstone for many applications in computer
science and information technology, including data
analysis, machine learning, artificial intelligence,
business intelligence (Sridevi, Bindu, et al. , 2017). In
reality, for instance, we can see the day-to-day
activities of a single person in their everyday actions
(Panesar, 2019). When a person desires to purchase a
good through an online retailer or a store, he or she
looks at the product price, quality, and many other
metrics depending on their needs. The study
conducted here can be considered a Data study in and
of itself. This little example demonstrates the
importance of data analysis in our daily lives. When
this idea is utilized with vast collections of data, we
need to be more cautious as we make decisions based
on the analysis that we have completed, which is
known as data-driven decision-making (Mario,
2017), (Xuan-Linh and Rajkumar, 2008). This has an
impact on business choices. However, due to the lack
of knowledge on tool selection, the outcome of the
work may vary in time and effectiveness (Dubey,
Patel, et al. , 2018).
2 THE DATA ANALYSIS TOOLS
2.1 Spreadsheet-based Analysis
Spreadsheet-based analysis is We did market research
on the technologies available to make it easier to
analyze the huge data sets created by large activities.
Tool selection is critical in producing effective
findings, depending on the sort of analysis being
conducted, data as behavior, and needs such as
platform as service, software as service, cloud-based
tool, non-coding, coding, cost, and so on.
600
Bitra, P., Devarakonda, G. K. M., Vijaya Durga, P. V., Kolapalli, J. U. and L N Prakash Kumar, P.
Usability Benchmarking of Data Analytic Tools with Market Research for Decision-Making.
DOI: 10.5220/0013582400004664
Paper published under CC license (CC BY-NC-ND 4.0)
In Proceedings of the 3rd International Conference on Futuristic Technology (INCOFT 2025) - Volume 1, pages 600-607
ISBN: 978-989-758-763-4
Proceedings Copyright © 2025 by SCITEPRESS – Science and Technology Publications, Lda.

Once you have considered these factors, you can
start to narrow down your choices. Here are a few
popular data analysis tools to consider based on the
variant:
The process of organizing, manipulating,
analyzing, and visualizing data using spreadsheet
applications such as Microsoft Excel or Google
Sheets. Spreadsheets are frequently used for a variety
of analyses, such as financial modeling, data analysis,
project management, and others (Gunnlaugsson,
2016). Data Entry, Formatting, Cleaning, Formulas
and Functions, What-If Analysis, Macros and
Automation, Reporting and visualization, Iteration
and Validation, and Collaboration and Sharing are
some of the services available. Spreadsheet-based
analysis provides a versatile and strong set of tools for
organizing and analyzing data (Şeref, Ahuja, et al. ,
2008), making it popular across sectors and
disciplines. The main drawback of this is that you
have to save the work continuously and keep backups
in order to avoid data loss.
2.2 Data Analysis Using Programming
Languages
Data Analysis using programming languages entails
using a programming language's ability to process,
alter, and analyze data. One of the techniques used in
this kind of analysis is Data exploration, where we
load and inspect the structure, format, and behavior
of the data, which can be read from databases, files,
APIs, or other sources using appropriate Libraries.
Data Cleaning and Preprocessing, Transforming
according to the criteria Visual representation to gain
insights, Statistical, time series, and text analysis
Machine learning, Optimization, simulation of Big
data, and Interactive analysis One must be a gem in
programming to conquer the analysis using this kind
of technique.
Platforms for Programming Languages:
RStudio, Jupyter Notebook, TensorFlow, etc.
2.2.1 SQL
SQL (Structured Query Language) is a Scalable and
powerful data analysis language, particularly when
working with structured data stored in relational
databases. Here are some of the benefits of using SQL
for data analysis:
Simple Data Retrieval, Data Aggregation, and
Summarization Joining various tables; filtering and
Sorting; Sub queries; and Derived Tables, SQL
allows for sub queries and data transformation
2.2.2 Data Integrity and Security
SQL databases impose data integrity restrictions to
ensure data correctness and consistency, as well as
security measures like user authentication and
permission. The SQL is Limited to Structured Data,
Procedural Logic, Statistical Analysis, and
Performance Considerations.
2.3 Python, R, Julia, and MATLAB
Python, R, Julia, and MATLAB are examples of
programming languages that include substantial
libraries, tools, and frameworks to aid with data
analysis tasks. They provide flexibility, scalability,
and the capacity to tailor your analysis to your
individual requirements (Ross and Gentleman, 1996),
(Coleman, Maliar, et al. , 2021).
2.4 Java for Big Data
Java is a popular programming language that may be
used for large-scale data processing and analysis.
While Python and R are both well-known data
analytics technologies (Coleman, Maliar, et al. ,
2021), when it comes to big data, Java reigns
supreme. Many of the technologies needed to handle
and analyze huge datasets, such as Spark, Hadoop,
Cassandra, Knime, Storm, Talend, and Elasticsearch,
are developed in Java. Java also has solutions for
interacting with cloud-based big data systems such as
Amazon Web Services (AWS) or Google Cloud
Platform (GCP) (Saxena, Kaushik, et al. , 2016).
2.5 Pros and Cons of Programming
Languages
2.5.1 Pros
Programming languages are extremely flexible,
allowing you to customize and alter your analytic
techniques to meet your demands.
1 Extensive Libraries and Tools: Many
programming languages have robust ecosystems
that include libraries and tools for data analysis.
These libraries include pre-built functions,
methods, and data structures that can help you
save time when doing analysis tasks.
2 Performance: Depending on the programming
language and optimization techniques used,
high-performance data analysis is possible,
particularly for computationally heavy jobs.
Programming languages are readily integrated
with other tools, technologies, and databases,
Usability Benchmarking of Data Analytic Tools with Market Research for Decision-Making
601
allowing for smooth data integration, transformation,
and interoperability.
2.5.2 Cons
1. Learning Curve: Learning curves are
common in languages used in programming,
and obtaining the requisite skills for data
analysis can take time and effort.
2. Development Time: Developing code for
data analysis activities might be more time-
consuming than utilizing a GUI-based
software tool.
3. Performance Limitations: Some
programming languages may not provide
ideal performance for particular sorts of data
analysis jobs, depending on the language
and individual use case.
4. Maintenance and debugging: Code-based
data analysis necessitates constant
maintenance and debugging since errors
might arise due to manual coding or updates
in the data set.
2.6 Web-Based Applications
Web-based applications are applications or apps that
run with the help of web servers as hosts and can be
accessed with the help of a Web browser. Some of
them are Google Analytics, Tableau, IBM Watson
Analytics, QlikView, and Microsoft Clarity. If you
are willing to perform the data analysis without
installing any of the GUI tools, then you can use
them. Some of the web applications are readily
available as downloadable software, where
installation can be done and used without hesitating
to be offline. Secure multi-party computing (MPC) is
a potential cryptographic technique for enabling
sensitive data analysis while maintaining anonymity,
which is the primary purpose of web-based
applications. (Lapets, Jansen, 2018).
2.7 Open Source
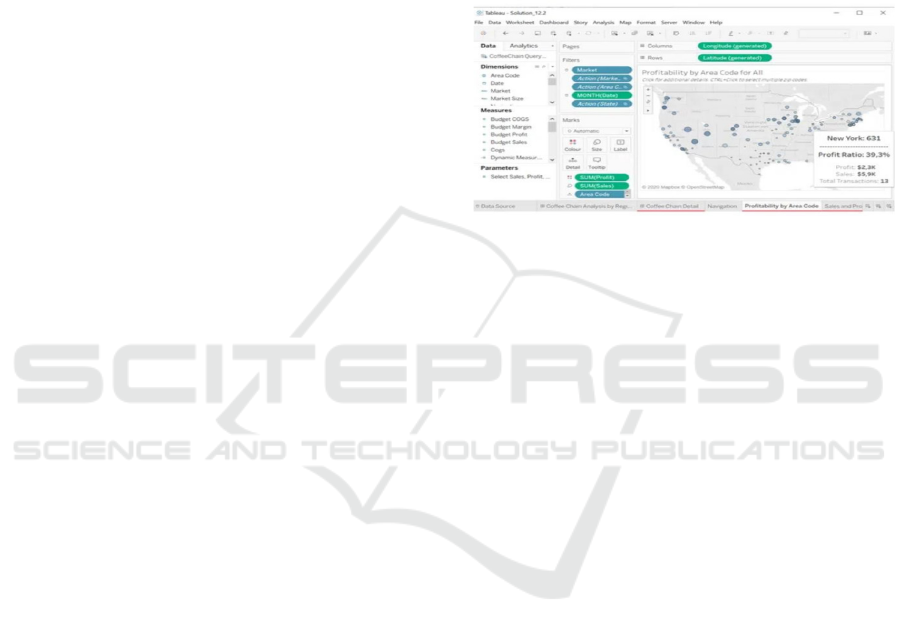
2.7.1 Tableau
Tableau is one of the most famous data visualization
tools. It is a data discovery and data exploration
application that allows you to give responses very
quickly, within seconds. It's one type of drag-and-
drop tool to visualize any type of data. One can get
real-time data by connecting to a database or API for
real-time visualization. This drag-and-drop analytic
tool is completely free for students and can be
downloaded from
“https://www.tableau.com/academic/students”. The
tableau tool works as shown in Figure 1. Tableau is
an open-source tool, so everyone easily visualizes
different types of charts, maps, and graphs. Tableau
helps you build dashboards that deliver actionable
information and help your business grow. Tableau
can extract data from virtually any data store,
including Excel, PDF, Oracle, and Amazon Web
Services. Tableau technologies enable data scientists
to visualize an infinite number of analytics.
Figure 1: Tableau working environment
Tableau is used in many industries and businesses
to generate reports and worksheets very quickly.
Different organizations, like Amazon, Wal-Mart, and
Accenture, widely use Tableau. Tableau limitations
are unclean data, a lack of data modeling, and a lack
of version control while creating a data dashboard.
There are two ways to get data by using the Tableau
tool:
• Developer Tools: In development, these tools
are used to generate charts, maps, dashboards,
reports, and visualizations. Tableau Public and
Tableau Desktop are the two most important
products in this category.
• Sharing Tools: These tools are used to share
various sorts of reports, visualizations, and
dashboards that have been developed using the
developer tools. Tableau Online, Tableau
Reader, and Tableau Server are the most
important items in this area.
2.7.2 Power BI
It is a Microsoft Business Intelligence and Data
Visualization application that is used to transform
data from numerous data sources, such as interactive
dashboards and analytical reports. Power BI also
provides cloud-based services for interactive data
visualization. Power BI Desktop for Microsoft
Windows 10 is available for download, as are native
mobile apps for Windows, Android, and iOS devices.
INCOFT 2025 - International Conference on Futuristic Technology
602
Microsoft Power BI is used to discover trends in a
company's data.
Figure 2: Power BI working environment
Microsoft Power BI is used by professionals and
management to develop reports and predictions to
assist sales and marketing agents, as well as data for
management on how the team or individual workers
perform towards their goals.
Users may select between three versions of Power
BI: Power BI Desktop, Power BI Pro, and Power BI
Premium. Power BI is a data visualization application
with a simple drag-and-drop interface. The BI
Desktop edition is free, and the ones that follow are
modestly priced. The three versions of Power BI are
a user-friendly, drag-and-drop data visualization tool.
The BI Desktop edition is free of charge, while the
following versions are reasonably priced.
The advantages of Power BI are that data
visualization is very inexpensive, it releases rigorous
updates every month, and it has its own gateways to
authorize unwanted traffic. The Limitations are
Power BI design involved complexity issues, no data
cleansing solution, and being unable to handle a large
amount of data.
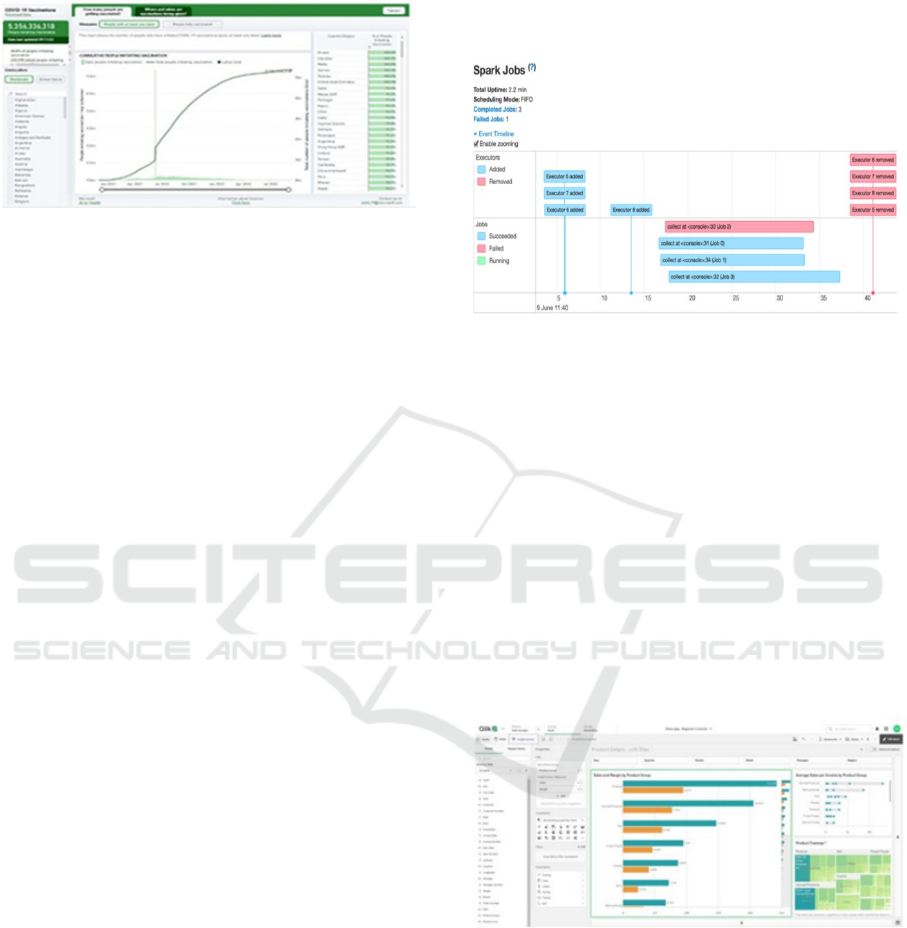
2.7.3 Apache Spark
Apache Spark is a super-fast cluster computing
solution developed for high-performance
computation. It is based on Hadoop MapReduce and
extends the MapReduce architecture to allow for
more efficient use of it for different sorts of
calculations, such as interactive queries and stream
processing. It is available as an open-source tool
Download Apache Spark by accessing the Spark
Download page and selecting the link from
“Download Spark". Some versions are offered at
affordable prices.
Spark is utilized in the healthcare industry
because it provides a full analysis of patient
information as well as past medical data, finance to
make informed decisions, credit risk assessment, and
targeted advertising. It produces high- quality
algorithms quickly and makes machine learning
simple to use and scale. Apache Spark features are
implemented on top of the Spark core. It offers a wide
range of APIs as well as apps for programming
languages such as Scala, Java, and Python to help
with development.
Figure 3: Apache Spark working environment
2.7.4 Qlik Sense
Qlik Sense is a QlikTech application that focuses on
data visualization and analysis. It helps with the
production of interactive dashboards and reports, as
well as data extraction from multiple data sources.
Qlik Sense is a QlikTech application that focuses on
data visualization and analysis. It helps with the
production of interactive dashboards and reports, as
well as data extraction from multiple data sources.
QlikSense editions are classified into three types:
Qlik Sense Desktop is a free and open-source
application. With the Qlik Download page using the
Qlik ID as a login can download the Qlik Sense
Desktop.
Figure 4.: Qlik Sense working environment
2.7.5 Sisense
Sisense's intuitive dashboard exploration and drag-
and-drop user interface make it simple for anybody to
create, investigate, and share insights. You can
quickly visualize data in a way that is best suited for
your research with the help of Sisense, which offers
intelligent computation and charting options based on
your unique data set. Dashboards can also be altered
Usability Benchmarking of Data Analytic Tools with Market Research for Decision-Making
603
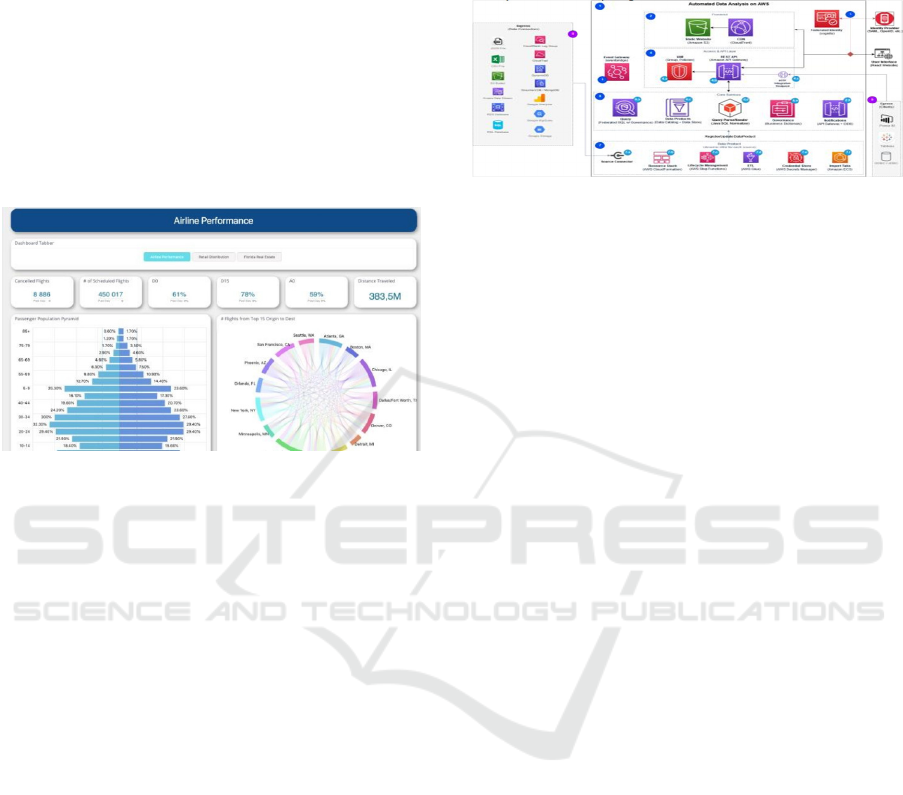
to have the style and feel that you choose.
Visualization may be enhanced with images, text,
videos, and links to turn insights into clickable
actions. Numerous benefits come with using the
Sisense Cloud, such as scalability and agility, a secure
environment, proactive support, hassle-free
maintenance, etc (Lousa, Pedrosa et al. 2019). It
offers both the ability for skilled coders to design
complicated reporting apps and for non-programmers
to quickly build unique reports using straightforward
drag-and-drop features. Sisense's data visualization
features make it simple to analyze reports and show
progress to clients, shareholders, and other parties.
Figure 5: Sisense airline performance dashboard screenshot
2.8 Cloud-Based Data Analytics
Cloud-based applications are the ones where the work
will be performed with the help of remote servers, and
the actual application will be run without installing
any software (Khan, Shakil et al. 2018). All we need
to get started are the login credentials. A cloud
platform offers a particular trial period for the user.
Once the trial is completed, one has to pay according
to usage and needs, similar to some open-source and
web applications. Here are some of the applications
in the cloud-based category:
2.8.1 AWS
Amazon Web Services is one of a kind and provides
a suite of cloud computing services like computing,
storage, databases, app development and deployment,
analytics, and management services. It offers a
variety of pricing options and plans to save you
money, including reserved instances and spot
instances. The main advantage of this is that it has
data centers all over the world and can deploy its
services nearly anywhere.
AWS Automated Data Analysis:
Automated analysis is the precise process of doing
analysis with a simple click that derives meaningful
insight from a specified range of data. With the help
of a deployed automatic process, it allows the users to
use this service with a user interface that abstracts
away the underlying AWS services.
Figure 6: Automated Data Analysis on AWS
2.8.2 Vanus
Vanus is a versatile cloud platform that can be used
without any prior knowledge of coding. It does all the
data preparation and transformation according to the
requirements. It does the work of Data
transformation, quality assurance, and visualization,
which includes charts, graphs, and map displays. In
addition to these works, it has an extension to
Machine Learning where it includes tools for
Classification, Regression, and clustering.
2.8.3 AppOptics Custom Metrics and
Analytics
A data collection service that is included in a bundle
that includes infrastructure and application
monitoring. This is a cloud-based solution that can
collect statistics for analysis from various cloud
platforms as well as your on-site resources.
2.8.4 IBM Cognos
Analytics combines AI approaches with stunning
visualizations to explore and detect trends. Have
plans for companies of all sizes (Magoma, Tshepo, et
al. 2021).
2.8.5 Microsoft PowerBI
Microsoft PowerBI has excellent visualization,
dashboard creation, and easy sharing and
collaboration with others. Machine learning is
included (Lousa, Pedrosa et al. 2019 ).
2.8.6 Zoho Analytics
Available on-premises and in the cloud, with drag-
and-drop dashboard customization.
INCOFT 2025 - International Conference on Futuristic Technology
604
2.8.7 TIBCO Spotfire
TIBCO Spotfire is an AI-powered, sophisticated
analytics product with robust search capabilities for
corporate users.
2.8.9 Domo
Domo collects data from third-party sources such as
Excel from Microsoft, Xero, Facebook,
Salesforce, AWS, MySQL, and others.
2.8.10 QlikSense
Qlik Sense Cloud costs $15 per month. The
Enterprise Edition of Qlik Sense is available in token
form, with each token worth $1,500. Qlik enables
users to ask any inquiry in natural language and
receive robust responses. Furthermore, as you study
your data, Qlik will automatically offer insights and
new connections to investigate.
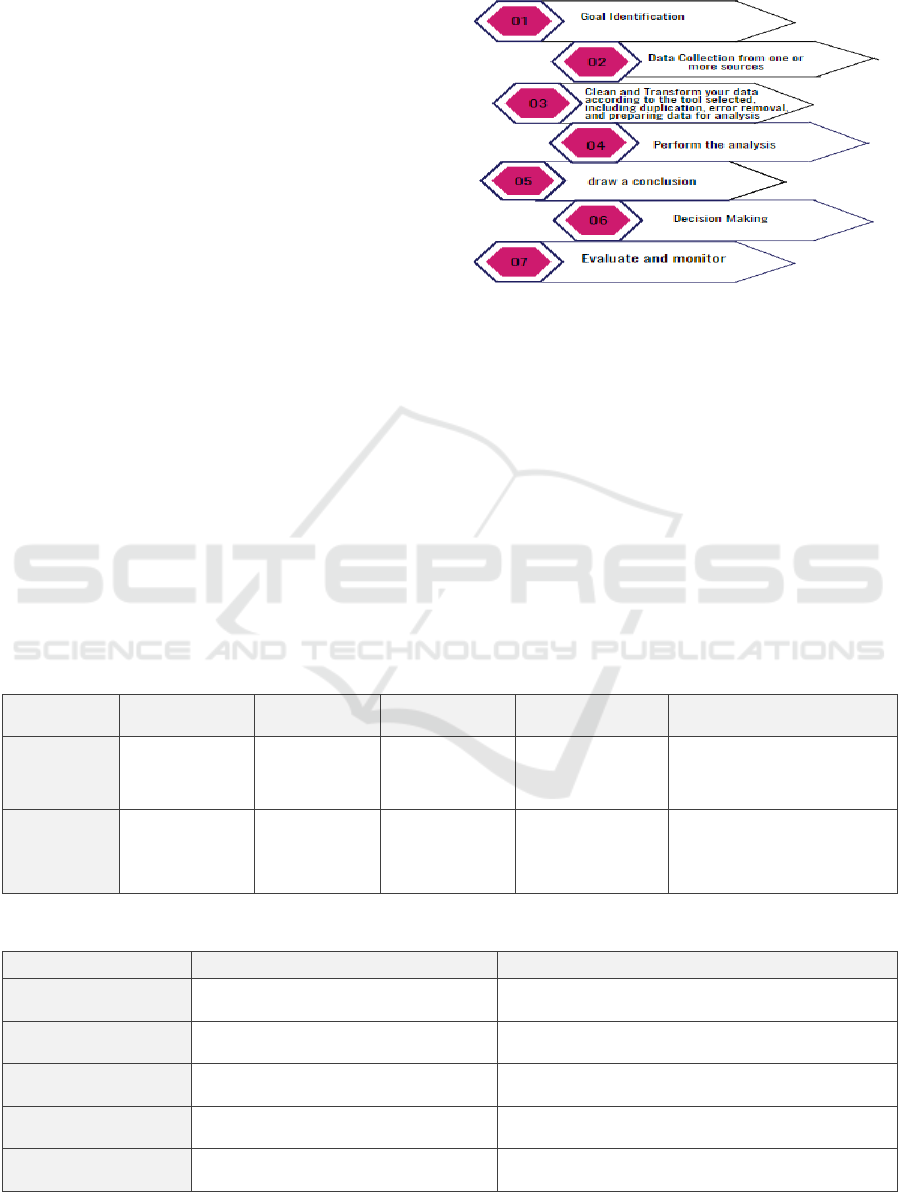
3 DATA–DRIVEN
DECISION-MAKING PROCESS
Whatever tool you select for your analysis, the
process that we follow for analytics is the same. Once
you have decided to go for analytics for your business
or some other purpose, there are some steps you can
take to get the right insights in a short period. These
are as follows:
Figure 7: Data Analysis Process Diagram
4 TAXONOMY OF THE TOOLS
AVA I L A B L E
The Analytics tools provided the basic usage
differentiation of different tools according to the
user's requirements. In this section, we would like to
give an outline of them, depending on the Budget,
memory space availability, working feasibility, and
limitations. The following tables give you an outline
of the different data analysis tools that are making a
blare in the market.
Table 1: Various Data Analysis Tools with Paid and Free Availability
Data Analysis
Metho
d
Spreadsheet Programming Web-based Open source Cloud-based
Paid Microsoft Excel,
Google Sheets
Python,
MATLAB, SAS
Tableau, Power
BI, QlikView
RStudio, Anaconda
Navigator, Qlick
Sense
Amazon Web Services (AWS),
Microsoft Azure, Google
Cloud Platform (GCP)
Free LibreOffice Calc,
Apache
OpenOffice Calc
Python, R,
Octave
Google Data
Studio, Microsoft
Power BI
Desktop, Looke
r
R, Python, Octave AWS Free Tier, Azure Free
Account, GCP Free Tier
Table 2: Pro’s and Con’s of Individual Data Analysis Tool Styles
Data Analysis Tool Advantages Disadvantages
Spreadsheets Easy to use, versatile, and affordable Can be limited for large and complex datasets, prone to
errors
Programming Most flexible and powerful, can be used
for com
p
lex data anal
y
sis tasks
It can be difficult to learn and use and requires
knowled
g
e of
p
ro
g
rammin
g
Web-based applications Easy to use, accessible from anywhere
with an internet connection, and scalable
May not be as powerful as programming or
spreadsheets for complex data analysis tasks
Open source software Affordable, customizable, large
community of users
Can be difficult to find support for and may not be as
well-
p
olished as commercial software
Cloud computing Scalable, affordable, and easy to use Can be expensive for large datasets; security concerns
Usability Benchmarking of Data Analytic Tools with Market Research for Decision-Making
605
5 REPORT ON TOOL ADOPTION
TRENDS OVER THE PAST 5
YEARS
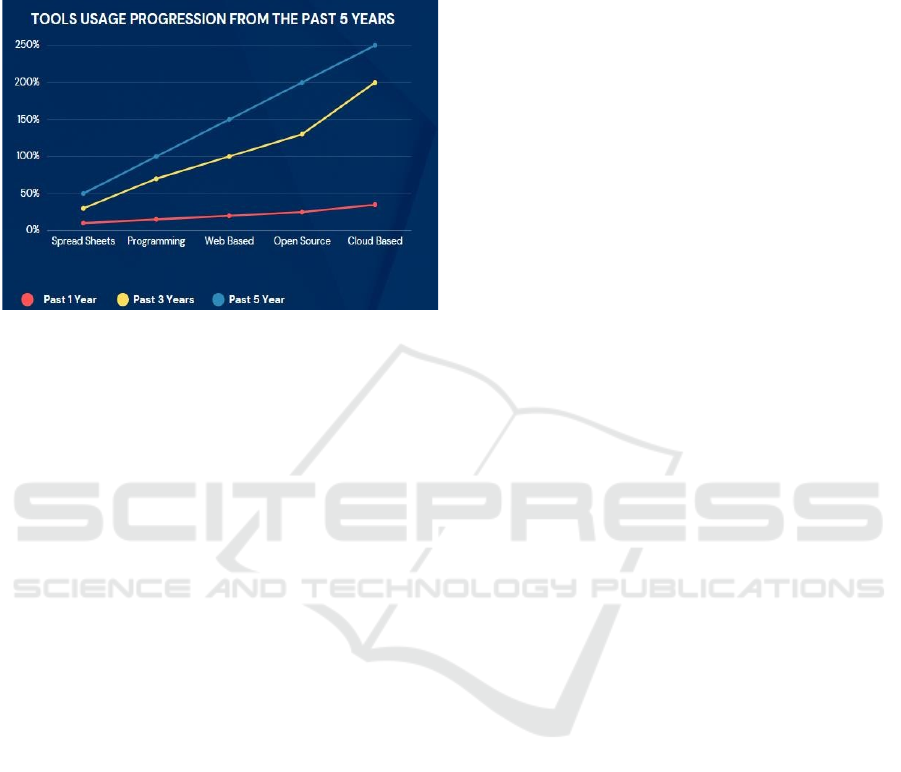
Figure 8: Data Analysis Usage Evolution for the past 5
years
The graph shows the usage of tools over the past
5 years. The Y-axis represents the number of users
using the tools, and the X-axis represents the year.
The graph shows that the usage of all tools has
increased over the past 5 years, but some tools have
grown more than others. Cloud- based computing has
grown the most, followed by open- source software,
web-based applications, programming, and
spreadsheets. This trend is likely due to the many
advantages of cloud-based computing and other
modern data analysis tools, such as scalability,
Affordability and ease of use. Additionally, the
increasing demand for data analysis skills and the
Growing availability of data have also contributed to
the growth of these tools.
Here is a more extensive breakdown of each tool's
growth:
Cloud computing has risen at the fastest rate in the
last five years, with a 250% increase. This is most
likely owing to cloud computing numerous benefits,
such as scalability, affordability, and ease of use.
Cloud computing systems can manage massive
datasets and are frequently less expensive than on-
premises data centers. Furthermore, cloud computing
systems are simple to use and may be accessible from
any region with an internet connection.
6 CONCLUSIONS
Cloud-based computing is the fastest-growing data
analysis tool. This is likely due to its scalability,
affordability, and ease of use. Programming is the
most flexible and robust data analysis tool. However,
it is also the most difficult to learn and use. Web-
based applications are a good option for users who
need a data analysis tool that is easy to use and
accessible from anywhere with an internet
connection. However, they may not be as powerful as
programming or spreadsheets for complex data
analysis tasks. Open-source Software is a good option
for users who need a data analysis tool that is
affordable and customizable. However, finding
support for open-source software can be difficult, and
it may not be as well-polished as commercial
software. Spreadsheets are a good option for users
who need a data analysis tool that is easy to use and
versatile. However, they can be limited to large and
complex datasets, and they may be prone to errors.
REFERENCES
Bonthu, Sridevi, and K. Hima Bindu. "Review of leading
data analytics tools." International Journal of
Engineering & Technology 7.3.31 (2017): 10-15.
Panesar, A. (2019). Data. In: Machine Learning and AI for
Healthcare. Apress, Berkeley, CA.
https://doi.org/10.1007/978-1-4842-3799-1_2
Diván, Mario. (2017). Data-driven decision making. 50- 56.
10.1109/ICTUS.2017.8285973.
Tran, Xuan-Linh & Huynh, Thomas & Shoval, Shraga &
Ferris, Timothy. (2008). Tool selection process and its
management for small and medium enterprises in
defense projects. Proceedings of the IEEE International
Conference on System of Systems Engineering
(SoSE'08). 1 - 7. 10.1109/SYSOSE.2008.4724173.
Dubey, S., Patel, J., Pasha, I. A., & BVRIT, N. (2018). BCI
SOFTWARE TOOLS AND DATASETS: A SHORT
SURVEY. International Journal of Pure and Applied
Mathematics, 120(6), 7855-7870.
Gunnlaugsson, H.P. Spreadsheet based analysis of
Mössbauer spectra. Hyperfine Interact 237, 79 (2016).
https://doi.org/10.1007/s10751-016-1271-z
Şeref, M., Ahuja, R. (2008). Spreadsheet-Based Decision
Support Systems. In: Handbook on Decision Support
Systems 1. International Handbooks Information
System. Springer, Berlin, Heidelberg. 3.
https://doi.org/10.1007/978-3-540-48713-5_14
Ross Ihaka ihaka@stat.auckland.ac.nz & Robert
Gentleman (1996) R: A Language for Data Analysis
and Graphics, Journal of Computational and Graphical
Statistics, 5:3, 299-314, DOI:
10.1080/10618600.1996.10474713.
Coleman, C., Lyon, S., Maliar, L. et al. Matlab, Python,
Julia: What to Choose in Economics?. Comput Econ
58, 1263–1288 (2021). https://doi.org/10.1007/s10614-
020- 09983-3.
Saxena, N. Kaushik, N. Kaushik and A. Dwivedi,
"Implementation of cloud computing and big data with
INCOFT 2025 - International Conference on Futuristic Technology
606

Java based web application," 2016 3rd International
Conference on Computing for Sustainable Global
Development (INDIACom), New Delhi, India, 2016,
pp. 1289-1293.
Andrei Lapets, Frederick Jansen, Kinan Dak Albab,
Rawane Issa, Lucy Qin, Mayank Varia, and Azer
Bestavros. 2018. Accessible Privacy-Preserving Web-
Based Data Analysis for Assessing and Addressing
Economic Inequalities. In Proceedings of the 1st ACM
SIGCAS Conference on Computing and Sustainable
Societies (COMPASS '18). Association for Computing
Machinery, New York, NY, USA, Article 48, 1–5.
https://doi.org/10.1145/3209811.3212701
Khan, S., Shakil, K.A., Alam, M. (2018). Cloud-Based Big
Data Analytics—A Survey of Current Research and
Future Directions. In: Aggarwal, V., Bhatnagar, V.,
Mishra, D. (eds) Big Data Analytics. Advances in
Intelligent Systems and Computing, vol 654. Springer,
Singapore. https://doi.org/10.1007/978-981-10-6620-
7_57
Lousa, I. Pedrosa and J. Bernardino, "Evaluation and
Analysis of Business Intelligence Data Visualization
Tools," 2019 14th Iberian Conference on Information
Systems and Technologies (CISTI), Coimbra, Portugal,
2019, pp. 1-6, doi: 10.23919/CISTI.2019.8760677.
Magoma, Tshepo, Khumalo, Sithembiso, & du Plessis,
Tanya. (2021). Affordability of IBM Cognos business
intelligence tool features suitable for small-and
medium-sized enterprises' decision-making. South
African Journal of Information Management, 23(1), 1-
9. https://dx.doi.org/10.4102/sajim.v23i1.1291
Usability Benchmarking of Data Analytic Tools with Market Research for Decision-Making
607
