
Assessing Registration and Screening Technologies for
Efficient Mass Vaccination and Public Health Monitoring
Eva K. Lee
1,2,3 a
and Kevin Yifan Liu
1,2
1
The Data and Analytics Innovation Institute, Atlanta GA 30309, U.S.A.
2
Georgia Institute of Technology, Atlanta GA 30322, U.S.A.
3
Accuhealth Technologies, Atlanta GA 30310, U.S.A.
Keywords: Point-of-Dispensing, Vaccination Clinic, Public Health Monitoring, Adverse Effect, Registration, Screening,
Barcode Scanner, QR Code, Immunization Information System, Vaccination Efficiency, Systems Simulation,
Performance Optimization, Resource Allocation, Nonlinear Mixed Integer Program.
Abstract: Vaccine data collection during mass vaccination campaigns is a difficult task due to the lack of a unified
system; yet, accurate and timely documentation is essential for monitoring efficacy and adverse effects. In
this study, we evaluate five electronic registration and screening technologies to test for how quickly
immunizations could be delivered and recorded given the different physical and cyber requirements of the
different technologies. Using time−motion studies and service data analysis from influenza vaccination
campaigns, we demonstrate operations and tracking efficiency with throughput improvements of 16% to 45%.
Based on these findings, we propose a prototypical unified system for dispensing, monitoring, and assessment
that is interoperable with existing immunization and electronic medical record systems. This paper highlights
the potential of electronic technologies to significantly enhance processes in vaccine administration and data
management. With the resource-constrained public health setting, the design emphasizes on minimally-
enhanced technology requirements to achieve seamless data and process management and improved
operations efficiencies. The system is flexible, scalable, and adaptable for different types of medical
countermeasures.
1 INTRODUCTION
During a pandemic or other vaccine-preventable
disease outbreak, it is essential to vaccinate as many
people as quickly as possible. Delaying vaccination
can lead to widespread illness and loss of lives and
serious burdens to healthcare systems (https://www.
cdc.gov/globalimmunization/fast-facts/index.html;
Lee, E. K., et al., 2015; Miller, M. A., et al., 2008;
Tisoncik, J. R., et al. 2009; Wein, L. M., et al., 2003).
There has been active research in advancing
operations and logistics to maximize vaccination and
mass dispensing throughput under time and resource
constraints (Cot, C., et al., 2021; Danzon, P. M., et al.
2005; Ferreira, L. S., et al., 2022; Hupert, N., et al.,
2002; Lee, E. K., et al., 2006a; Lee, E. K., et al.,
2006b; Prieto Curiel, R., et al., 2021; Wagner, C. E.,
et al., 2022; Washington, M. L., 2009). To establish
real-time, locale-specific and scalable capabilities for
public health decision-making, working with the
a
https://orcid.org/0000-0003-0415-4640
Centers for Disease Control and Prevention (CDC),
Lee et al. developed RealOpt©, a large-scale
information decision support system that seamlessly
integrates a disease modeling engine, a simulation
module and optimization technology into a unified
all-purpose response system. RealOpt allows real-
time analysis to maximize operations efficiency,
optimize staffing and resource allocation, analyze
layout design, and mitigate disease spread (Lee, E. K.,
et al., 2010; Lee, E. K., et al., 2013; Lee, E. K., et al.,
2017; Lee, E. K., et al., 2021; Kwong, J. C., et al.,
2010).
The recent COVID-19 pandemic caused by the
SARS-Cov-2 virus underscores the importance of the
rapid development of effective medical
countermeasures. Through Operation Warp Speed, a
partnership between the Departments of Health and
Human Services and Defense that aimed to help
accelerate vaccine development, the first COVID-19
vaccine was distributed to the public by December
156
Lee, E. K., Liu and K. Y.
Assessing Registration and Screening Technologies for Efficient Mass Vaccination and Public Health Monitoring.
DOI: 10.5220/0013571100003967
In Proceedings of the 14th International Conference on Data Science, Technology and Applications (DATA 2025), pages 156-170
ISBN: 978-989-758-758-0; ISSN: 2184-285X
Copyright © 2025 by Paper published under CC license (CC BY-NC-ND 4.0)
2020. Still, the United States reported over 111
million cases, resulting in over 1.2 million deaths.
Worldwide, over 7 million died from the disease.
Despite the vaccine development success, the
initial rollout of COVID-19 vaccines in the U.S. was
chaotic. There were supply shortages, distribution
issues, confusion over eligibility and a serious lack of
documentation. Many states struggled to set up
efficient appointment systems. Each state had its own
vaccine sign-up website, often run by the state health
department or local county health offices. Some of
these systems crashed due to high demand. Hospital
and healthcare provider systems used their own
patient portals for scheduling vaccine appointments,
and major pharmacy chains set up scheduling systems
too. With no centralized booking system, people had
to check different sites — state portals, pharmacy
chains, hospitals, and mass vaccination sites —
hoping to find an available slot. Many people signed
up on multiple websites, leading to wasted
appointment slots. The high traffic overwhelmed and
crashed scheduling systems, causing long wait times,
and raised access issues for seniors and underserved
communities. At the vaccination sites, clients were
given a paper card with their name, the vaccination
date and type, and a short note regarding where to
report an adverse effect.
Currently, there is no unified or integrated system
for effective vaccine data collection. Unless steps are
taken, inefficiencies such as these could occur during
a future emergency. Information regarding uptake is
critical for monitoring adverse effects and vaccine
efficacy. This is especially important when a newly
developed vaccine is being dispensed or when
multiple doses of vaccine are needed per person.
These data can provide valuable information during
an emergency and serve multiple purposes for public
health planning and research (Kwong, J. C., et al.
2010).
In this paper, we describe and analyze five types
of electronic technologies used for registration and
screenings in vaccination clinics. We contrast their
functionalities, usability and operations performance
based on time-motion studies and service data
collected during actual influenza vaccination
campaigns (“Campbell mass dispensing flu clinic”
CDC Report, n.d.; “Platte mass dispensing flu clinic”
CDC Report, n.d.; “Denver public health closed POD
for flu vaccination” CDC Report, n.d.; “Philadelphia
department of public health Closed POD for flu
Vaccination” CDC Report, n.d.; “CDC closed POD
for flu vaccination” CDC Report, n.d.) (Section 3.1).
We evaluate their dispensing performance under an
optimal dispensing clinic design (Section 3.2). Our
analysis shows that these electronic technologies can
improve operations and tracking efficiency with 16%
to 45% increase in overall throughput. Based on our
assessment and analyses, we propose a unified
prototypical registration and screening system with
integrated information flow for vaccination that can
be used for dispensing, monitoring and assessment
(Section 3.3). The system is interoperable to the local
Immunization Information system and electronic
medical record systems. The design is flexible and
adaptable for different types of medical
countermeasures and can be used by a broad spectrum
of regional public health departments.
2 METHODS AND DESIGN
This paper presents the first study using time-motion
techniques to scrutinize point-of-dispensing
operations by analyzing five different (inexpensive
and practical) electronic technologies for data input
and collection. RealOpt, an informatics-decision-
support enterprise system used by over 14,000 public
health emergency response users across 50 states, is
used to simulate and optimize the dispensing
operations to contrast the performance of each
technology. Through hundreds of time-motion
studies, it has proven that RealOpt is able to predict
the performance of the actual system throughput well
(within 95% to 105%). Hence, the analysis herein
should offer useful foundations and insights into the
potential improvement that can be achieved by the
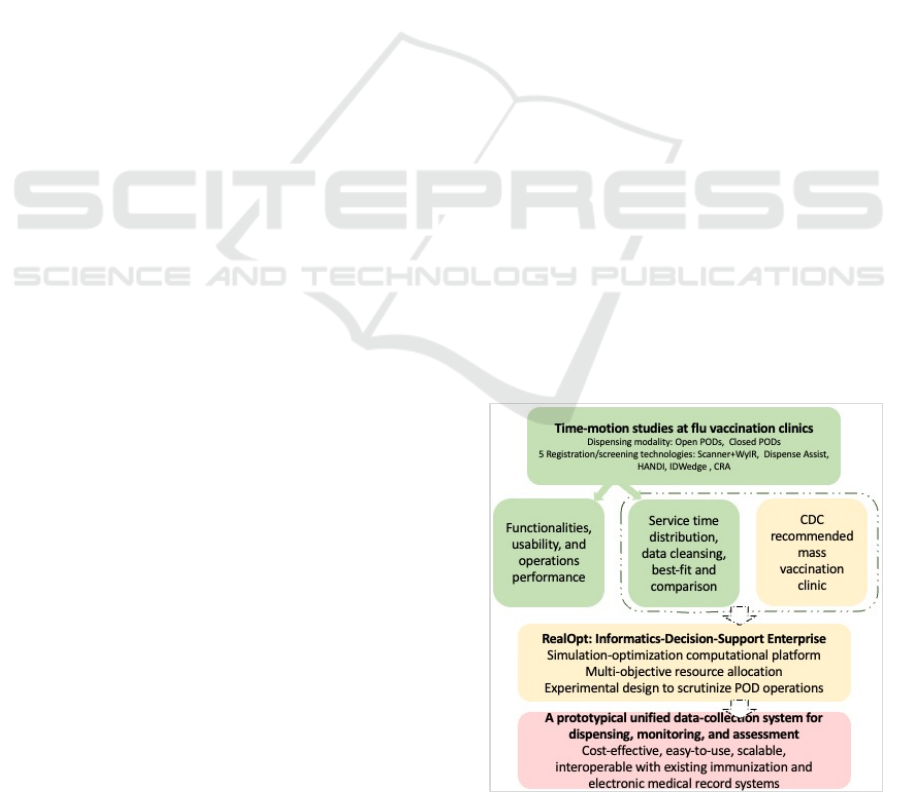
electronic data collection technologies. Figure 1
briefly layouts the schematic method and design of
our study.
Figure 1: A schematic layout of the method and design.
Assessing Registration and Screening Technologies for Efficient Mass Vaccination and Public Health Monitoring
157

2.1 Technologies for Registration and
Screening
A variety of methods have been used for client
registration and screening (Nanji, K. C., et al., 2009;
Pereira, J. A., et al., 2012). Based on a catalogue of
available electronic technologies developed by CDC
(Oak Ridge Associated University, 2016) and several
hundreds of time-motion studies on mass vaccination,
five representative technologies were investigated,
including barcode, mobile and magnetic stripe
scanners and web-based software modules. They
were chosen by public health leaders as candidates
and were supported by comparison results (done
independently) to be practical and cost-effective in
actual settings.
At the point-of-dispensing sites, through time-
motion study, we recorded the completion of each
task by observing and documenting staff members
performing their duties and interacting with clients.
Using RealOpt (Lee, E. K., et al., 2010; Lee, E. K., et
al., 2013; Lee, E. K., et al., 2017; Lee, E. K., et al.,
2021; Kwong, J. C., et al., 2010), a CDC-
recommended vaccination clinic is designed and used
to analyze the vaccination throughput performance
and contrast the strengths and limitations of each
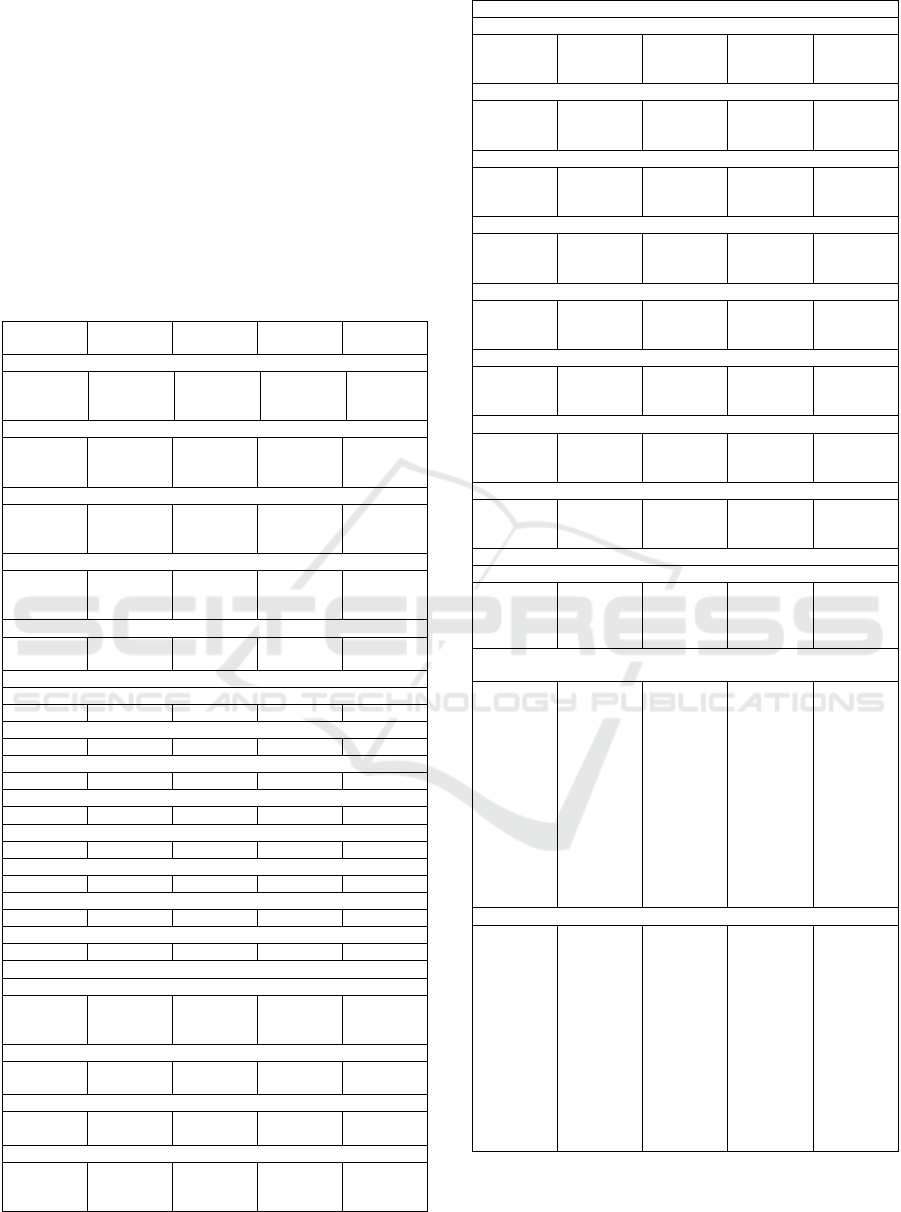
technology. Table 1 summarizes the five data
collection technologies and its usage information.
Table 1: Summary of the five studied sites.
Gillette,
W
y
omin
g
Platte City,
Missouri
Denver,
Colorado
Philadelphia,
PA
Atlanta, Georgia
Vaccination period
7am–7
p
m 10am–2
p
m 12
p
m–4
p
m 8am–1
p
m 8:30am–3
p
m
POD location
Public health
facilit
y
Middle school Public health
facilit
y
Police
b
uildin
g
State facility
Dispensing module
Walk-in open
POD for all
residents
Drive-through
and walk-in
open POD for
adult residents
(18 years or
older
)
Closed POD
for employees
with valid
badges
Closed POD
for first
responders
and their
family
member
Closed POD for
site employee
Data collection technology
Barcode
scanner and
Wyoming's
Immunization
Registry
(
W
y
IR
)
Dispense
Assist
Handheld
Automated
Notification
for Drugs and
Immunizations
(
HANDI
)
IDWedge &
AutoFill
Countermeasure
and Response
Administration
(CRA)
We briefly describe each technology below.
2.1.1 Barcode Scanner Linked to an
Immunization Registry
Barcode scanner linked to an Immunization Registry
was used at the Wyoming event. A Honeywell 4600G
Barcode scanner was used to scan the linear and 2D
barcodes on the Wyoming Drivers’ licenses. The
scanned information includes name, address, date of
birth, and gender. This information is populated onto
the Wyoming's Immunization Registry (WyIR). If the
scanning is successful, the system searches for
existing information linked to the driver’s license. For
those without valid licenses (new licenses or children)
or if the scanning failed, the demographic information
is input manually. Vaccine information is also entered
manually into the registry.
The entire setup is rather straightforward.
Scanning itself does not require an internet
connection. The scanners can be connected to the
computer via USB ports. A software program is used
to sync the barcode scanner to WyIR, allowing the
scanned data to be populated onto WyIR in real-time.
WyIR is an Immunization Information System
(IIS) and within it there is a password-protected mass
vaccination module, among other modules. Lot
numbers and other vaccination data (vaccinators,
manufacturers, clinic dates, etc.) can be input into
WyIR prior to the POD operations. Internet
connection is required to use the WyIR.
There are two levels of access within WyIR: entry
access and full access. Vaccine administrators login
via entry access to view data, conduct queries on
clients, and perform data entry. Full access allows
inventory management, and more complex tasks.
Vaccine can also be ordered from WyIR.
The barcode scanner-WyIR setup allows direct
import of client demographic information, reduces
data entry of client information after the dispensing
event, hence saving time and reducing potential
errors. The state health department provides technical
assistance for WyIR through email or telephone.
2.1.2 Dispense Assist
Dispense Assist is an online tool developed by the
Johnson County Department of Health and Environ-
ment in Kansas (https://www.kshcc.com/ dispense-
assist.html). It is used by multiple county health
departments across the nation. Dispense Assist collects
both client information (name, address, phone number,
date of birth, and gender) and vaccine information (the
vaccine type (CVX code), manufacturer (MVX code),
expiration date, injection site, route of administration,
provider and type and publication date).
Clients fill out the registration form either through
a web browser or a mobile app. The questions cover
demographic information and medical screenings.
The medical screening determines which medication
or treatment the client is eligible for. One family
member can fill out forms for an entire family. The
address input in the first form can be saved as a
DATA 2025 - 14th International Conference on Data Science, Technology and Applications
158

default address and pre-populated to subsequent
forms. Multiple vouchers can be saved on one device.
Dispense Assist interfaces with barcode
scanners (Motorola Symbol) and printers. The
system generates QR codes that can be scanned
directly from the mobile app. Vouchers can be
printed or saved to a mobile device. Alternately, it
can be sent to an email account set up by the clinic
and printed when the client arrives at the POD.
Scanning the QR code adds an entry to an Excel
spreadsheet. This spreadsheet can later be exported
to electronic medical records (EMRs) after being
reformatted to fit the EMR's specifications.
Real time usage requires an Internet connection, a
barcode scanner that can read QR codes ($80) and a
USB connection between the scanner and a laptop.
Once the QR code is scanned, the corresponding
coded data will pop up on the laptop screen for POD
staff to review. A server that can handle thousands of
simultaneous hits is required. Dispense Assist can
also be downloaded and used off-line. Staff can
record vaccination information on the form and scan
them into the database later. The system has Spanish
translation capability through a web-link.
2.1.3 Handheld Automated Notification for
Drugs and Immunizations (HANDI)
Handheld Automated Notification for Drugs and
Immunizations (HANDI) is a mobile device
application developed by Denver Public Health to
improve data capture and efficiently administer
immunizations for closed POD operations. The
system consists of two parts: a backend database
system and a front-end handheld device (iPod Touch
and scanner). It uses a three-step process to collect
data: (a) client pre-registration; (b) medical
contraindication; and (c) vaccination information.
Clients register online through a website setup via
HANDI. Once registered, the client’s employee ID is
scanned using a scanner attached to the mobile device.
The scanner reads the magnetic stripe on the ID. If the
identification card is not readable or available, the
information will be manually entered into the device.
Otherwise, registered information of the client will be
loaded for verification. Any additional information can
be updated at this point. Once scanned into the system,
it helps to monitor contraindications and track
immunizations, and treatment plans administered
during mass intervention events.
At the POD vaccination station, the nurses scan
the information to identify the vaccinator, lot number,
dosage and site name before administering the
vaccine. The information on the mobile device is sent
to the server after the POD is closed. The server
bundles the data from each station and the complete
data set is securely transferred to a designated
database or registry (e.g., a state immunization
registry). The application server stores the
information in a SQL-server database and can export
the data to other designated formats. For example,
HANDI can convert the data to HL7 and send its
records to any system that accepts HL7.
2.1.4 IDWedge & AutoFill IDWEdge
IDWedge & AutoFill IDWedge (Tokenworks)
supports scanning of drivers’ licenses and military
IDs from all U.S. states and all Canadian provinces.
Used in conjunction with IDWedge, AutoFill is a
Windows application that can be configured to
automatically populate forms with information from
scanned IDs. Prior to the clinic, a simple user defined
formula is generated to specify the field order (first,
last, etc.) and the keystrokes (tab, arrow up, enter)
which are sent to a database.
At the dispensing site, staff swipe drivers’
licenses or state identification cards using IDWedge
to collect client identification information. The data
prefills into the customized Microsoft Access
database in real time. The licenses scanned and their
vaccination records are automatically updated. For
children who do not have valid drivers’ licenses, their
parents’ licenses are scanned, and the children’s
personal information is input manually.
AutoFill is configured to automatically populate
the Access form with the client data. The Access form
also contains checkboxes for screening questions
(manually entered by the data collectors) and
vaccination information. The manufacturer, lot
number, and date of administration are copied for all
clients, while the injection site and provider are
manually entered for each vaccination. After the
event, the Access databases from each computer are
downloaded, merged, and manually cleaned up,
removing duplicates and populating missing fields.
The final merged database is uploaded onto the IIS.
2.1.5 The Countermeasure and Response
Administration (CRA)
The Countermeasure and Response Administration
(CRA) is a web-based application developed by CDC
contractors. Prior to the event, staff customize the
form manually and select various fields to record. The
only client ID collected is the employee ID number.
Information including the vaccine type (CVX code),
manufacturer (MVX code), dose number, expiration
date, dose volume and unit, injection site, lot number,
Assessing Registration and Screening Technologies for Efficient Mass Vaccination and Public Health Monitoring
159
date of administration, and provider can be recorded.
In addition, the VIS type and publication date are
collected with the latter given to the client.
At the vaccination event reported herein, four
fields were selected: employee ID number, date of
administration, vaccine lot number, and injection site.
The date of administration is pre-populated with the
event date and the vaccine lot number is pre-
populated with the lot number of the last vaccine
scanned. During the event, when a new batch of
vaccine is used, the staff scans the vaccine. The
vaccinator only records manually two fields, the
employee ID number and the injection site.
CRA can work as a stand-alone system to support
jurisdictional operations if an Internet connection is
not available. Aggregate data and reports can be
produced for individual clinics and client populations.
CRA can also create recall reminders for future doses
that clients may need. These reminders can be sent to
both providers and clients. After the event, all
recorded information is exported to a single file and
sent to the employer’s electronic medical record.
2.2 Analyzing Operational
Performance via a Common
Vaccination Clinic Layout
To gauge the operational performance, we derive
experiments to analyze the importance of each
technological component with respect to POD
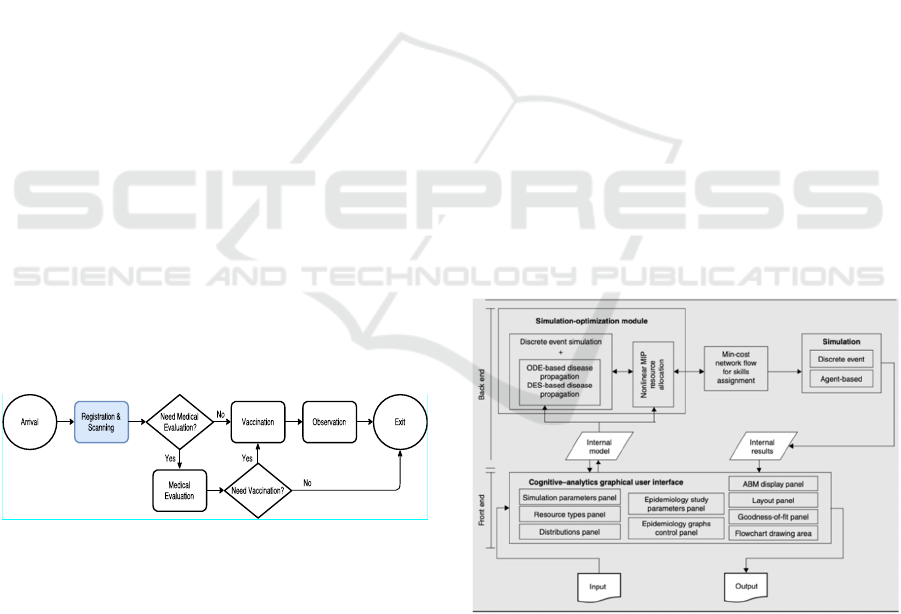
operations and the overall performance. Figure 2
shows a medical dispensing clinic process flow
recommended by CDC for mass medical
countermeasure dispensing and commonly used by
public health sites.
Figure 2: A medical dispensing clinic used for mass
vaccination.
2.3 Simulation-Optimization
Computational Platform and
Multi-Objective Resource
Allocation
2.3.1 The Simulation-Optimization
Computational Platform
RealOpt is designed for responding to emergencies,
including biological, chemical, radiological, nuclear
incidents and natural disasters. Figure 3 shows an
overview of RealOpt-POD for biological defense and
the analytic methodologies that are embedded in it. In
the frontend, users interact with the system through
the multi-panel, cognitive-analytics interface. In the
backend, the simulation-optimization module
consists of the large-scale simulator and the rapid
optimizer. The solution engine works by running
optimization and simulation in an interlacing manner.
The system has been used for mass vaccination (and
diagnostic testing) events including seasonal flu,
Ebola, Hepatitis, and COVID-19. It has been used for
fire, flood and hurricane responses (for setting up
shelters, food/medical/supply distribution sites, and
command-control logistics etc.), Haiti earthquake
emergency response relief, Japan Fukushima
radiological response (rapid screening and
decontamination, food/shelter, supplies
distributions), hurricane Sandy response, optimizing
Ebola treatment center operations, and predicting and
containing Zika disease spread. The system has also
been used by numerous hospitals/clinics for
optimizing hospital workflow and operations
efficiency (Lee, E. K., et al., 2015). The system
allows management of multiple resource types
simultaneously, for example, labor, equipment, beds,
financial investment, medical supplies, and
countermeasures (Lee, E. K., et al., 2010; Lee, E. K.,
et al., 2013; Lee, E. K., et al., 2017; Lee, E. K., et al.,
2021; Lee, E. K., Li, Z. L., Liu, Y. K., & Leduc, J.,
2021; de Mesquita PJB, et al., 2021).
Figure 3: The architectural design of RealOpt-POD.
2.3.2 Nonlinear Mixed-Integer Program for
Optimizing Resource Allocation and
System Performance
Within RealOpt, system optimization can be
performed to ensure the best operations and system
performance (throughput, wait-time, queue length,
DATA 2025 - 14th International Conference on Data Science, Technology and Applications
160

utilization, etc). The resource allocation is modeled
via a nonlinear mixed integer program (NMIP).
Resources can include labor, equipment, computer,
etc. Constraints in the model include: (a) maximum
limits on wait time and queue length (which is
dictated by the capacity of the waiting room in the
facility and also the desire to maintain sufficient
distancing to minimize potential infection); (b) range
of utilization desired at each station; (c) assignability
and availability for each resource group, and resource
types at each station (i.e., the skill set and the numbers
available); and (d) maximum limit on the cycle time
of the individual. Mathematically, the model
parameters are defined as follows:
R: the set of resource groups.
𝐓
: the set of resource types in resource group
r, 𝑟∈𝐑.
S: the set of services in the process flow.
𝐒
⊆𝐒: the set of services in which resource
type i in resource group r can be assigned. This
models the assignability of the resource (e.g.,
based on skills of workers).
𝑘
: the cost of assigning a resource of type i in
resource group r to station j. 𝑟∈𝐑, 𝑖∈𝐓
, 𝑗∈
𝐒
.
𝑚
and 𝑚
: the maximum and minimum
number of resources of type i in resource group
r that may be assigned to station j. 𝑟∈𝐑, 𝑖∈
𝐓
, 𝑗∈𝐒
.
𝑛
: the number of available resources of type i
in resource group r. 𝑟∈𝐑, 𝑖∈𝐓
.
𝑤
, 𝑞
, and 𝑢
: the average wait time, average
queue length, and average utilization rate,
respectively, at station j. 𝑗∈𝐒.
c: the average cycle time (i.e., the length of time
a customer spends in the system).
𝜃: the average throughput (number of customers
served in a specified period).
The decision variables for this problem are 𝑥
∈
𝐙
: the number of resources of type i in resource
group r assigned to station j. 𝑟∈𝐑, 𝑖∈𝐓
, 𝑗∈𝐒
.
We can represent the cost at each station j as
𝑔
∑
𝑘
𝑥
(
,
)
∈𝛀
, 𝑤
, 𝑞
, 𝑢
, 𝑗∈𝐒, where 𝛀
=
(
𝑖,𝑟
)|
𝑟∈𝐑, 𝑖∈𝐓
, 𝑗∈𝐒
. The total system cost
depends on the cost at each station, and on system
performance variables, such as cycle time and
throughput. Thus, we can represent the total cost as
𝑓
∑
𝑔
∈𝐒
, 𝑐, 𝜃. Here, 𝑔
and 𝑓 are functions that
are not necessarily expressible in closed form. We can
formulate a general representation of the multiple
resources allocation problem as
Min
𝑧=𝑓
𝑔
∈𝐒
, 𝑐, 𝜃
s.t.
𝑚
≤𝑥
≤𝑚
∀ 𝑟∈𝐑, 𝑖∈𝐓
,
𝑗
∈𝐒
(1)
𝑥
∈𝐒
≤𝑛
∀ 𝑟∈𝐑, 𝑖∈𝐓
(2)
𝑤
(
𝑥
)
≤𝑤
𝑞
(
𝑥
)
≤𝑞
𝑢
≤𝑢
(
𝑥
)
≤𝑢
∀
𝑗
∈𝐒 (3)
𝜃
(
𝑥
)
≥𝜃
𝑐
(
𝑥
)
≤𝑐
(4)
𝑥
∈𝐙
∀𝑟∈𝐑, 𝑖∈𝐓
,
𝑗
∈𝐒
(5)
Constraint sets (1) to (5) form a NMIP problem
for cost minimization under the constraints of
multiple resources allocation and stochastic system
performance. Constraint sets (1) and (2) describe the
resource availability for each service or decision.
Constraint sets (3) and (4) ensure that services satisfy
safety guidelines to minimize potential cross
infection, e.g., individuals are not waiting for too
long, the queues are of reasonable size, workers are
not overwork, individuals do not spend excessive
amount of time inside the dispensing facility, etc.
We note that Constraint sets (3)-(4) are system
parameters in the simulation, and performance
variables in the optimization. Since some of the
functions in the objective and constraints are not
necessarily expressible in closed form, the system
optimizes the overall outcome performance using the
cycle time as a surrogate measurement and the effect
on different processes and the global return. The
problem is proven intractable by commercial systems.
RealOpt is designed to overcome such computational
bottlenecks by interweaving rapid system simulation
and optimization (Lee, E. K., et al., 2010; Lee, E. K.,
et al., 2013; Lee, E. K., et al., 2017; Lee, E. K., et al.,
2021).
Given a clinical process configuration with
various service distributions for each process and
decision point and associated performance metrics,
RealOpt simulates the entire clinical process to
acquire the cycle time and the system performance
under the configuration. The output simulation
statistics are then input into the stochastic NMIP
optimization model where performance and resources
are optimized. The resulting optimization output is
entered back into the simulation to obtain the next
system performance metrics. The simulation-
optimization iterates until no further improvement is
achieved.
Assessing Registration and Screening Technologies for Efficient Mass Vaccination and Public Health Monitoring
161
3 RESULTS
3.1 Time-Motion Study and Data
Collection for Modeling
3.1.1 System Functionalities
Based on system functionalities and time-motion
studies, we summarize key features and user
experiences for each registration and data collection
technology in Table 2.
Table 2: Comparison of the five registration technologies.
Scanner+
W
y
IR
Dispense
Assist
HANDI
IDWedge
& AutoFill
CRA
Pre-re
g
istration online
No
Yes - via
website or
mobile app
Yes - via
internal
website
No No
Onsite re
g
istration
No
Yes - via
website or
mobile a
pp
Yes - via
internal
website
No No
In
p
ut mechanism: how client data are read into the s
y
stem
Barcode
scanner
Barcode
scanner
Magnetic
stripe
scanne
r
Magnetic
stripe
scanne
r
Manual
input
Identification used as input for client data
Driver’s
license
System
generated
QR code
Employee
ID
Driver’s
license
Employee
ID
Pediatric
Manual
input
QR code
Not
supporte
d
Manual
input
Not
supporte
d
Data collected - Client data
Name
Yes Yes Yes Yes Yes
Address
Yes Yes Yes Yes
Birthda
y
Yes Yes Yes Yes
Insurance status
Yes
ID t
yp
e
Yes
Gende
r
Yes Yes Yes
Phone numbe
r
Yes
Email
Yes
Vaccine data
Vaccination date
Yes –
manual
input
Yes -
manual
input
Yes -
scanned
Yes -
manual
input
Yes -
manual
input
Vaccine dose numbe
r
Yes -
scanne
d
Vaccine dose volume and unit
Yes -
scanne
d
Vaccine ex
p
iration date
Yes -
manual
in
p
ut
Yes -
manual
in
p
ut
Yes -
scanned
Vaccine data
Vaccine in
j
ection site
Yes -
manual
in
p
ut
Yes -
manual
in
p
ut
Yes -
scanned
Yes -
manual
in
p
ut
Yes -
manual
in
p
ut
Vaccine lot numbe
r
Yes -
manual
in
p
ut
Yes -
manual
in
p
ut
Yes -
scanned
Yes -
manual
in
p
ut
Yes -
manual
in
p
ut
Vaccine manufacturer
(
MVX code
)
Yes -
manual
input
Yes -
manual
input
Yes -
scanned
Yes -
manual
input
Yes -
manual
input
Vaccine
p
rovide
r
Yes -
manual
in
p
ut
Yes -
manual
in
p
ut
Yes -
scanned
Yes -
manual
in
p
ut
Yes -
manual
in
p
ut
Vaccine route of administration
Yes -
manual
in
p
ut
Yes -
scanned
Vaccine type (CVX code)
Yes -
manual
in
p
ut
Yes -
manual
in
p
ut
Yes -
scanned
Yes -
manual
in
p
ut
VIS date
g
iven to client
Yes -
manual
in
p
ut
Yes -
manual
in
p
ut
VIS t
yp
e &
p
ublication date
Yes -
manual
in
p
ut
Or
g
anization of data durin
g
/after events
Database t
yp
e
Interfaced
directly
with IIS
Generates a
generic
Excel form
Data stored
in local
SQL-server
database
Data stored
in local
Access
database
Data stored
in the local
database
Imports data electronically to database (merge automatically to the
database)
Yes -
Interfaced
directly
with IIS
No -
generate
Excel files
that needs
manual
operation
Yes - The
server
bundles the
data from
each station
and the
complete
data set is
securely
transferred
to a
designated
database or
re
g
istr
y
Yes - data
stored in
Access
database
Yes - data
stored in
local
database
Transfer data to other formats (EMRs, etc.)
No - data
directly
reported to
IIS
No - data
stored in
local Excel
files and
needs
manual
operations
to transfer
to other
formats
Yes - can
transmit the
data to
other
designated
formats,
convert to
HL7 and
send its
records to
any system
that accepts
HL7
No - data
stored in
local
Access
database
and needs
manual
operations
to transfer
to other
formats
Yes - data
is
exportable
to other
databases
including
the
electronic
medical
records and
CDC’s
occupationa
l health
database
DATA 2025 - 14th International Conference on Data Science, Technology and Applications
162
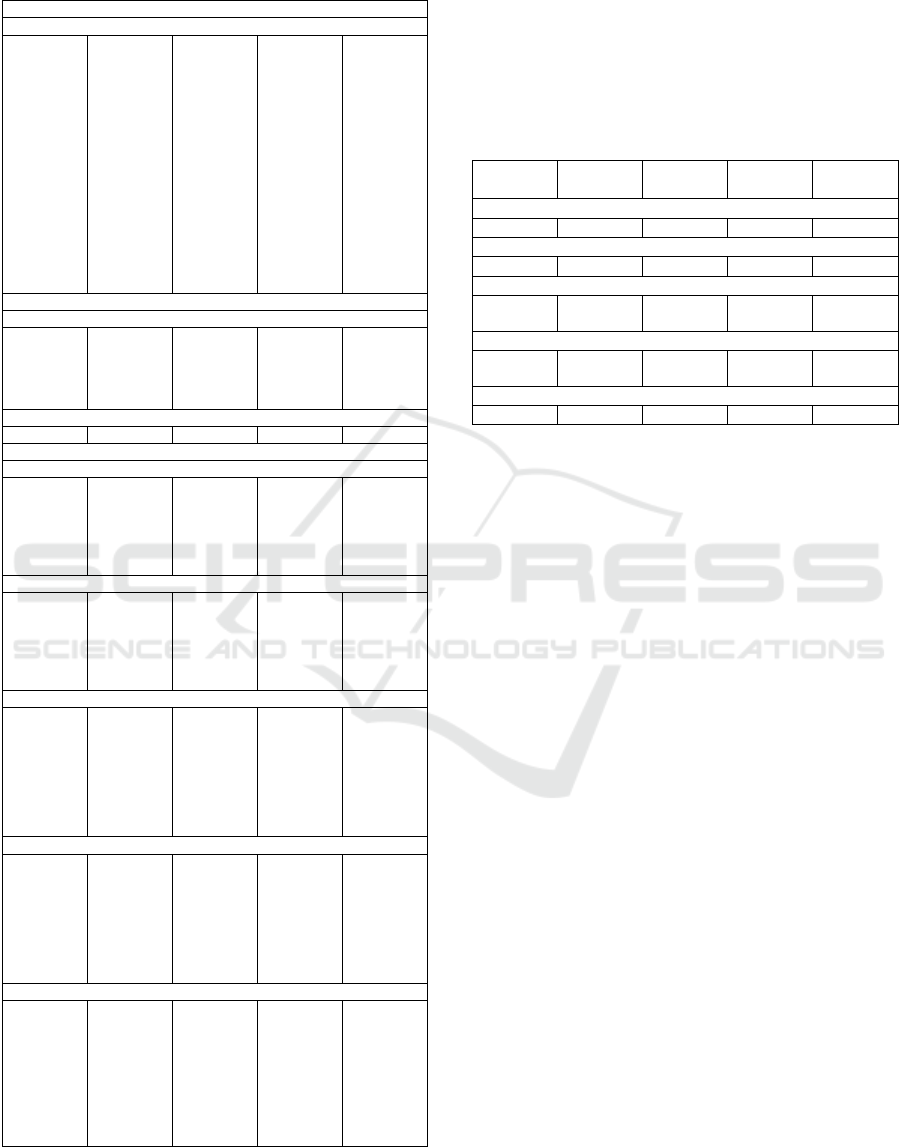
Table 2: Comparison of the five registration technologies
(cont).
Organization of data during/after events
Re
q
uire internet connection durin
g
events
Yes – for
connecting
to IIS
during
operations
Yes - for
onsite
registration
(5/4G or
LTE
connections
for mobile
phones will
also work)
Yes - for
onsite
registration;
but
essentially
only
Ethernet is
needed as it
is an
internal tool
for closed-
POD
No – unless
connecting
to IIS is
necessary
No – does
not need
connect to
any
database in
real time;
standalone
deployment
available;
registration
and
vaccination
are
performed
by the same
nurse
Scalabilit
y
for lar
g
er events
S
p
eed of data in
p
ut
Fast with
scanner,
slow with
manual
in
p
ut
Fast with
scanner,
slow with
manual
in
p
ut
Fast
Fast with
scanner,
slow with
manual
in
p
ut
Slow
Need for reliable servers
Yes Yes Yes No No
Observations durin
g
actual events
Trainin
g
Just-in-time
training;
workers
performed
well
Just-in-time
training;
workers
performed
well
Team has
5-year of
experience
Just-in-time
training;
workers
performed
well
Difficult for
vaccinators
to use,
more prone
to entry
errors
Pediatric
children
without
driver’s
license take
longer to
p
rocess
Via QR
code, same
as adults
Not
supported
children
without
drivers’
license take
longer to
p
rocess
Not
supported
Scanne
r
Failed to
scan some
drivers’
licenses
No scanner
available
on site. Pre-
filled forms
had to be
emailed
and printed
on site
Occasionall
y failed to
scan some
drivers’
licenses.
Registration
Automatic
Required
clients to
register
online,
many
forgot
Only
limited
employees
showed up;
unclear if
system is
scalable for
lar
g
e events
Automatic
No
mechanism
to input
client
information
automatical
ly
Health information
Not
connected
to EMR;
Health
information
needs to be
manually
filled out
by
clients.
Not
collected
Not
collected
Not
collected
Not
collected
3.1.2 Service Time Distributions
Observations were recorded for all clients entering
the vaccination site. Table 3 below shows the staffing
and total throughput (number of observations
collected) at each site.
Table 3: POD hours, staffing and throughput of the five
sites.
Gillette,
Wyoming
Platte City
Missouri
Denver,
Colorado
Philadelphia,
PA
Atlanta,
Georgia
Vaccination period
7am
–
7pm 10am
–
2pm 12pm
–
4p
m
8am
–
1pm 8:30am
–
3pm
POD type
Open POD Open POD Closed POD Closed POD Closed POD
Total throughput
650 adults
50 children
200 275 1,400 310
Staffing
8 staff, 4
volunteers
10 staff, 4
volunteers
4 11 10
Nurses
14 7 2 14 5
During time-motion studies, we observe several
factors that influence the service time.
Technology familiarity: For Scanner+WyIR,
Dispense Assist, and IDWedge systems, POD
workers received just-in-time training on the use
of the technology. For HANDI, the staff have used
it for multiple years and are quite proficient in its
usage. For CRA, workers log in a few days prior
to the vaccination event to learn of its usage and
to pre-set the dispensing information.
Incomplete technology: Scanning devices were
not available for the QR codes generated from
Dispense Assist to fully take advantage of its
capability. If equipped with proper scanning
devices to scan the generated QR codes (as the
technology is designed for), the service times will
be significantly shortened.
Human factor: Staff served at varying rates
depending on how busy the clinic was. Staff
tended to operate faster when the queue was long,
and slower when the clinic was not busy.
To address some of these factors, we perform
three steps: (a) Within each observed time, we
subtract from it the time spent on leisure chat between
the worker and the client (which we also collected).
(b) We remove outliers that are greater than the 90
percentiles. (c) We use only the service times
reflecting staff performance when the demand is high.
Figure 4 shows the adjusted service time with the
associated best-fit distribution (Chi-Square
Goodness-of-Fit Test) for registration and scanning
(data collection) for the five technologies and the
current manual process. The boxplots in Figure 5
Assessing Registration and Screening Technologies for Efficient Mass Vaccination and Public Health Monitoring
163
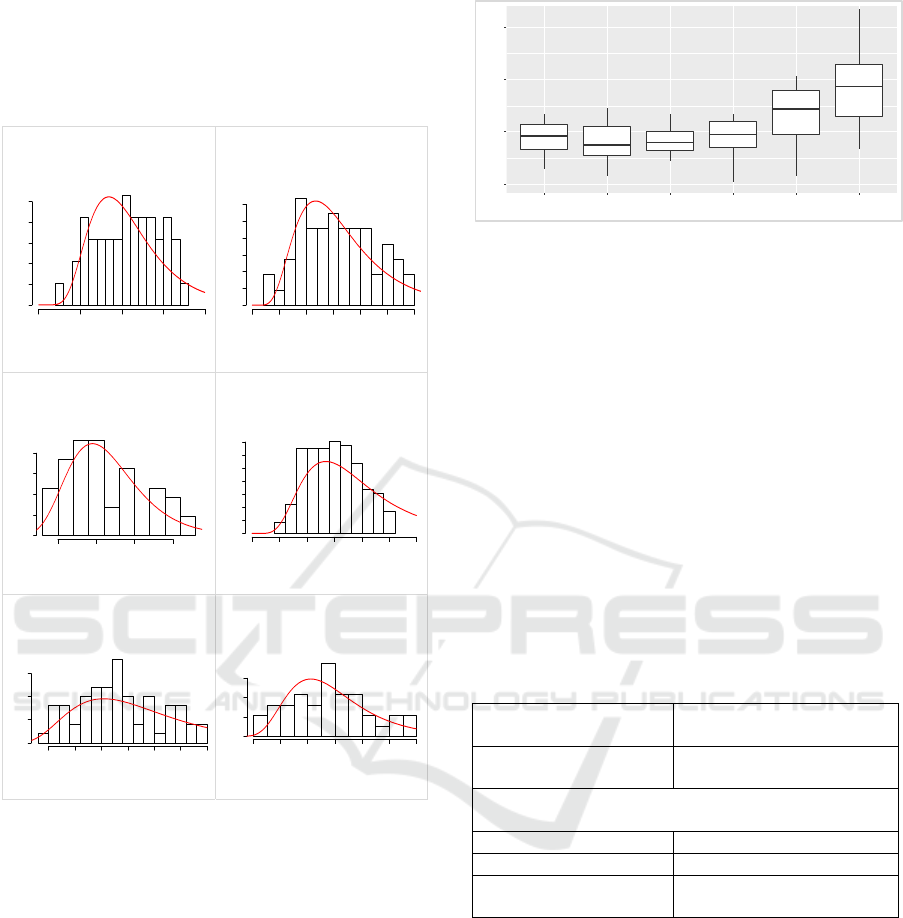
contrasts these service times for each technology. It
shows that scanner-type technology shares
comparable median time while computer input
requires a longer time. The figure depicts clear time
variance among users or types of clients.
Data collection time for
barcode scanner with WyIR
𝑙𝑜𝑔𝑛𝑜𝑟𝑚𝑎𝑙(21.84,9.45)
Data collection time for
Dispense Assist
𝑙𝑜𝑔𝑛𝑜𝑟𝑚𝑎𝑙(16.74,8.67)
Data Collection time for
HANDI
𝑙𝑜𝑔𝑛𝑜𝑟𝑚𝑎𝑙(16.57,4.99)
Data collection time for
IDWedge
𝑙𝑜𝑔𝑛𝑜𝑟𝑚𝑎𝑙(20.01,9.68)
Data collection time for
CRA
𝑙𝑜𝑔𝑛𝑜𝑟𝑚𝑎𝑙(28.10,13.64)
Data collection time for
manual input
𝑙𝑜𝑔𝑛𝑜𝑟𝑚𝑎𝑙(40.23,16.39)
Figure 4: Service time distributions with the associated
best-fit distribution for each technology after adjustment:
using only service times reflecting performance of staff
when demand is high. This excludes time spent on leisure
chats and outliers.
We note that across the five sites, there is marginal
difference in the service times for vaccination,
medical evaluation, and post-vaccination observation
respectively.
During the actual events, 90% of the clients in
Gillette, Wyoming event had valid Drivers’ licenses,
60% of the clients pre-registered at the Platte City
Missouri site, 86% of the clients pre-registered for
HANDI in Denver and 87% of the clients in
Philadelphia had valid Drivers’ licenses. We note that
at the Wyoming site, the form-filling process by the
clients themselves does not affect the performance of
the technology nor the POD process.
Figure 5: Boxplots contrasting the adjusted service times
for each technology.
3.2 Operations and Performance
Efficiency
Table 4 summarizes the associated service time
distributions and decision probabilities that are
collected from the time-motion studies. Using the
vaccine clinic layout in Figure 2 and these service
distributions, we simulate and perform systems,
operations and resource allocation optimization using
RealOpt for each of the technologies to obtain the best
throughout under the same number of staff (30) and
necessary equipment resource constraints. We report
some comparison findings below.
Table 4: Service time distributions and probabilities at
decision blocks obtained via time-motion studies of actual
influenza vaccination events.
Service Station Service Time Distribution
(all units in seconds)
Registration & Scanning Specific to each technology
as shown in Fi
g
ure 4
Best fit distribution obtained using combined data from
all five sites
Vaccination
𝑙𝑜𝑔𝑛𝑜𝑟𝑚𝑎𝑙
(
32.20,10.59
)
Medical Evaluation
𝑙𝑜𝑔𝑛𝑜𝑟𝑚𝑎𝑙
(
61.03,21.54
)
(Post-vaccination)
Observation
𝑢𝑛𝑖𝑓𝑜𝑟𝑚 (51.03,78.43)
Scanning Device versus Web Input Versus
Manual Approach. Figure 6 compares closed-POD
performance using magnetic strip scanners (HANDI,
IDWedge) versus input via website (CRA) versus the
manual approach. Magnetic strip scanners (HANDI
and IDWedge) gather the demographic information
of clients from their employee IDs or drivers’
licenses, while CRA requires workers to manually
input data onto the computer. When the pre-
registration percentage (for HANDI) or the
percentage of valid drivers’ licenses (for IDWedge)
are low, the resulting performance is similar to CRA.
During the actual vaccination events, 86% of the
Time (sec)
D
ens
i
t
y
0 10203040
0.00 0.02 0.04
Time (sec)
D
ens
i
t
y
0 5 10 15 20 25 30
0.00 0.02 0.04 0.06
Time (sec)
D
ens
i
ty
10 15 20 25
0.00 0.02 0.04 0.06 0.08
Time (sec)
Density
0 5 10 15 20 25 30
0.00 0.02 0.04 0.06
Time (sec)
Density
10 15 20 25 30 35 40
0.00 0.02 0.04 0.06
Time (sec)
Density
10 20 30 40 50 60 70
0.00 0.02
0
20
40
60
WyIR DispenseAssist HANDI IDWedge CRA Manual
Technology
Data Collection Time (seconds)
DATA 2025 - 14th International Conference on Data Science, Technology and Applications
164
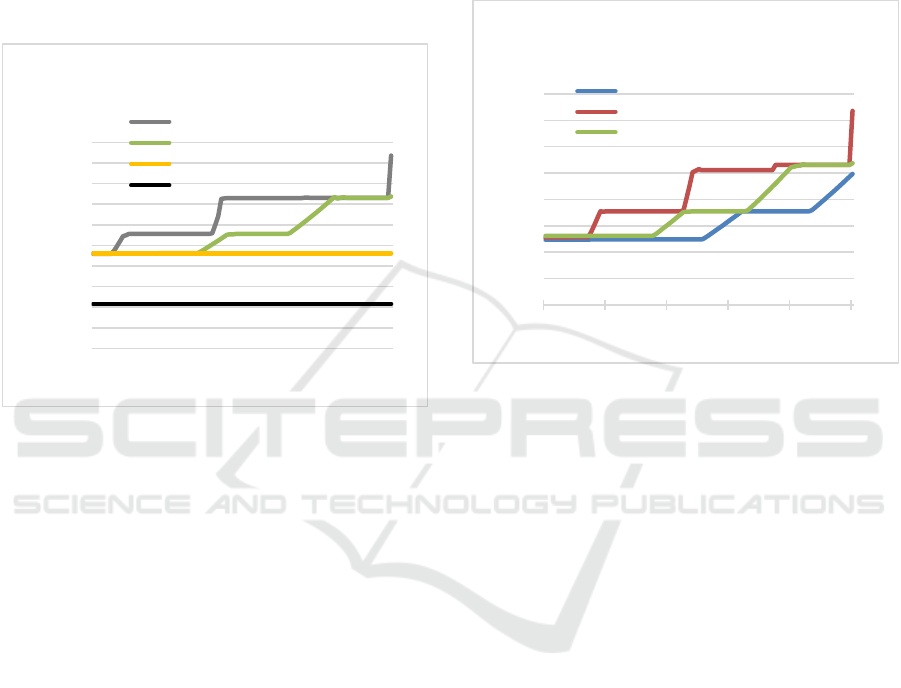
clients pre-registered, and 87% had valid drivers’
licenses. Thus, both HANDI and IDWedge produce
higher throughput than when using CRA by 14%.
However, we note that CRA results show that even
with a simple web-based system, the gain in
throughput can be significant (15% increase) when
compared to the traditional manual process. This
confirms that automatic scanning is essential for
efficient closed-POD operations and should be
incorporated into any data collection technology
Figure 6: Maximum throughput achieved when using
magnetic strip scanners, web-based input, and manual
registration respectively, under varying pre-registered
percentage or percentage with valid drivers’ licenses.
QR-Code versus Drivers’ ID. What is more efficient
for registration, QR codes or drivers’ licenses?
Scanner+WyIR and IDWedge use drivers’ licenses to
populate client demographic data automatically onto
the computer, while Dispense Assist generates a QR
code for each client (family) during online/mobile
registration for automatic population. Such
registration can be done either pre-event, or with on-
site kiosks or a mobile app. Figure 7 contrasts the
maximum throughput achieved by scanners
(Scanner+WyIR and IDWedge) versus QR-based
(Dispense Assist). When pre-registration and valid
drivers’ licenses percentages are both below 15%,
there is a marginal difference in the performance
among these technologies. However, Dispense Assist
shows a clear advantage as pre-registration picks up.
During the actual vaccination events, 60% of clients
pre-registered, while over 85% of clients have valid
drivers’ licenses. Uniformly, Dispense Assist
processes 20% more clients under the same resource
and time constraints. The IDWedge site performs
better than the Scanner+WyIR site. This may reflect
the fact that the former was a closed-POD operation,
where staff have used the same technology for five
years already; hence the POD operations ran more
efficiently. The clients were very comfor with the
environment. In general, QR code technology is very
competitive in an open-POD environment for
automatic registration. ID scanners are equally
competitive in closed-POD operations when most
clients have valid drivers’
licenses.
Figure 7: Maximum throughput achieved using QR codes
versus ID scanners, under varying pre-registered or
percentage with valid drivers’ licenses. Note that WyIR
uses onsite form-filling for medical screening while
IDWedge staff conducts verbal medical screening.
Verbal Medical Screening versus Form-Filling
Before Scanning. Both Scanner+WyIR and
IDWedge scan the drivers’ license to gather
demographic data automatically. In addition, clients
in Wyoming were asked to fill out a preliminary
medical screening form (by themselves) prior to
scanning, while Philadelphia IDWedge site
conducted onsite medical screening verbally during
scanning. Figure 7 (Blue versus Green) shows that the
throughputs are similar when the percentage of valid
drivers’ licenses is below 35%. Beyond 35%,
IDWedge is more competitive with slightly higher
throughput (10.5%) than Scanner+WyIR. When
every client has an ID, the difference in throughput is
only 1.9% (203 clients). During the actual events,
similar percentage of clients (90% vs 86%) had valid
IDs. The results show that verbal medical screening
(especially used in conjunction with the online EMR
or personal health records) is more efficient. The
time spent by nurses to review each paper form is not
negligible and may take up to a couple of minutes. In
addition, extra physical space is needed to
accommodate clients filling medical screening forms
onsite, which can potentially create congestion.
7000
7500
8000
8500
9000
9500
10000
10500
11000
11500
12000
0% 20% 40% 60% 80% 100%
Maximum throughput
Pre-registration % or % with valid drivers' licenses
Closed POD maximum throughput: scanner
(HANDI, IDWedge) vs web-base (CRA) vs manual
input
HANDI: pre-event registration %
IDWedge: % with valid drivers' license
CRA: web-based entry
Manual input
8000
8500
9000
9500
10000
10500
11000
11500
12000
0% 20% 40% 60% 80% 100%
Pre-registration % or % with valid drivers' licenses
Maximum throughput: scanner (WyIR, IDWedge)
vs QR code (Dispense Assist)
WyIR: % with valid drivers' license
Dispense Assist: pre-event registration %
IDWedge: % with valid drivers' license
Assessing Registration and Screening Technologies for Efficient Mass Vaccination and Public Health Monitoring
165
During a pandemic, this may increase infection
transmission within the dispensing facility; hence
proper crowd control such as the use of multiple
rooms or open space may be needed to facilitate
distancing among clients while completing the form.
Pre-Registration Impact. Dispense Assist uses
online pre-event registration and medical screening,
whereas IDWedge performs the entire process within
the POD (during scanning). We compare the
performance of these two technologies to gauge their
efficiency (Figure 7 Red versus Green). When less
than 15% of the clients pre-register or have valid ID,
performance of both technologies are similar. When
the pre-registration rate or percentage of valid
licenses range from 15% and 80%, Dispense Assist
performs better than IDWedge, while the maximum
difference in throughput is achieved at 49% with 10%
throughput difference. At a 60% pre-registration rate
for Dispense Assist and 87% valid ID for IDWedge,
there is only a marginal difference in the throughput.
We caution that Dispense Assist was used during an
open POD event (serving a more diverse population).
Hence its performance is remarkable when compared
to the closed-POD IDWedge results. Public
campaigns to encourage pre-registration during
mass dispensing events can help with the overall
efficiency and throughput
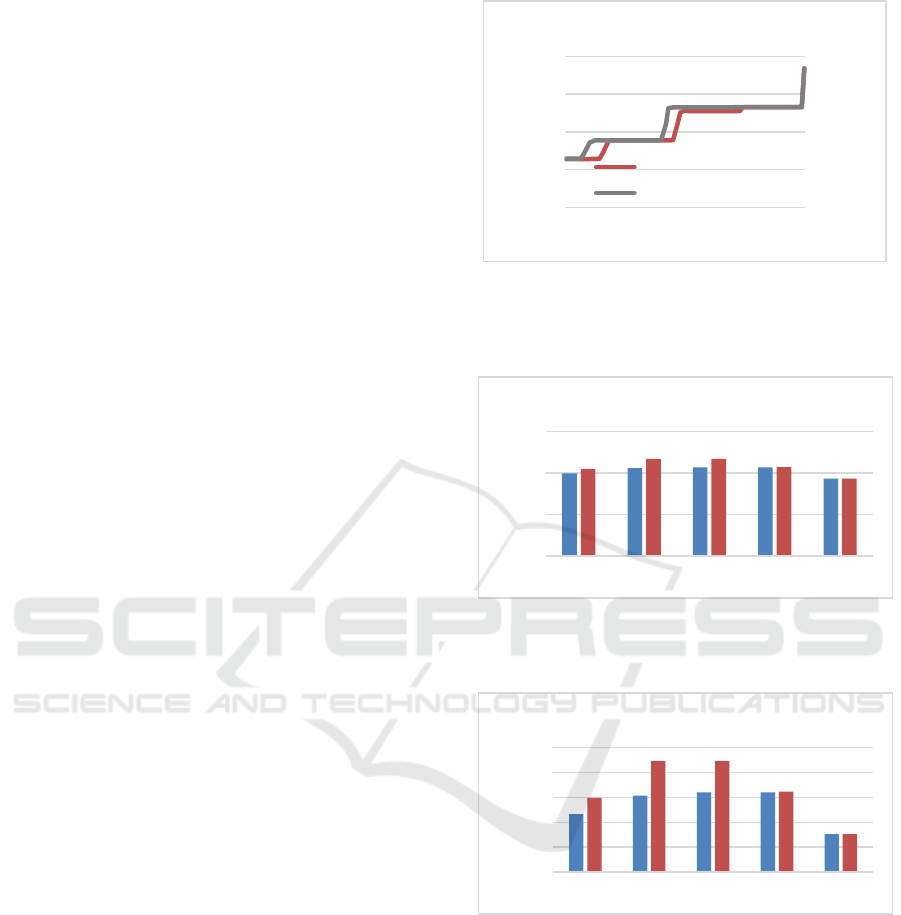
Open POD versus Closed POD. Dispense Assist is
used for general open POD events. The QR codes
generated via an online/mobile pre-registration is
scanned on-site. HANDI is used for closed POD
events to scan employees’ IDs. Both technologies
require pre-registration. Employee ID is an efficient
method for data input since every employee has one,
and with the same and standard data fields. Figure 8
show the maximum throughput under different pre-
registration rates. The two technologies have similar
trends as the pre-registration rate increases. At a low
pre-registration rate, HANDI has slight advantages in
the throughput. The results show that when
operating an open POD, QR codes are a good
alternative for employee IDs. QR code technology is
flexible in gathering information. Besides
demographics, and premedical screening questions,
additional information such as contact phone
numbers, primary physician, etc. can also be encoded.
This information can become crucial for health
monitoring and follow-up, or second dose reminder.
Although such information may also be recorded in
some employee IDs/records, they may not be
uniformed across different organizations.
Figure 8: Maximum throughput achieved for QR-based
technology (Dispense Assist) versus employee ID scanner
closed POD (HANDI) under varying pre-registered
percentage.
Figure 9a: Maximum throughput under an optimal POD
setup for a 6-hour shift using the observed time-motion
study data for each technology.
Figure 9b: Percentage throughput increases with respect to
manual registration is calculated as (x-manual)/manual *
100%.
Optimal Throughput For a 6-Hour Shift. Figure 9a
and 9b compare the maximum throughput of the five
technologies under the medical POD setup (Figure 2)
operating for a 6-hour shift. Each throughput is
obtained using the observed (real) time-motion study
data with the associated percentage of clients with
valid IDs and pre-registered. We also contrast the
results against the ideal scenario where all clients
have valid IDs and pre-registered (orange bar). In
contrast to the manual approach (Figure 9b), the CRA
8000
9000
10000
11000
12000
0% 20% 40% 60% 80% 100%
Pre-registration %
Maximum throughput achieved: open POD vs
closed POD
Dispense Assist: open POD QR-based
HANDI: closed POD employee ID scan
0
5000
10000
15000
WyIR: 90% vs 100%
valid drivers' license
DispenseAssist:
60% vs 100% pre-
registered
HANDI: 86% vs
100% pre-
registered
IDWedge: 87% vs
100% with valid
drivers' license
CRA
Maximum throughput
Maximum throughput under optimal POD
setup for a 6-hour shift
0%
10%
20%
30%
40%
50%
WyIR: 90% vs
100% valid drivers'
license
DispenseAssist:
60% vs 100% pre-
registered
HANDI: 86% vs
100% pre-
registered
IDWedge: 87% vs
100% with valid
drivers' license
CRA
% increase over manual
input
Percentage of throughput increase w.r.t.
manual registration
DATA 2025 - 14th International Conference on Data Science, Technology and Applications
166
web-based approach increases the throughput by
16%. Scanning drivers’ ID or using QR codes (even
with just 60% of client pre-registration) can increase
the throughput by 30%. If more people pre-register,
the gain could be as high as 45%.
3.3 A Prototypical Electronic System
for Data Collection During Mass
Dispensing
Based on our findings, we design a computerized
system for data input and collection during dispensing
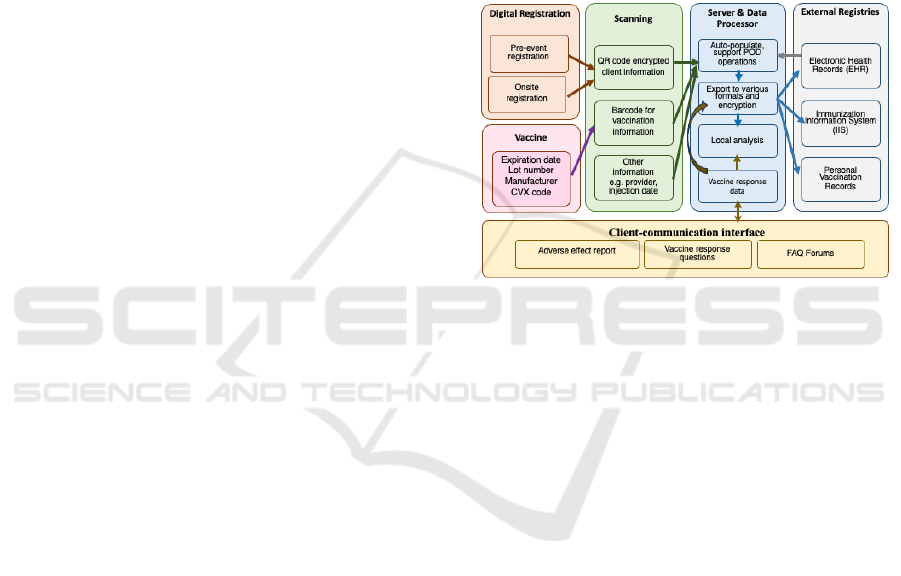
and post-event monitoring and assessment. Figure 10
shows the design structure and architecture of the
system. The system includes four key modules:
The digital registration module facilitates online
or on-site mobile registration. A QR code in
generated which stores the client information (e.g.,
name, address, zip code, immunization history etc.) in
standard format. QR codes are widely used in daily
activities including information gathering,
identification and mobile payment, air transportation
security (e.g., boarding passes), attendee ID at
conferences, and retails and sales. It is both reliable
and scalable.
The scanning module with a scanner, the client
information will pop up rapidly allowing staff to
review and cross reference to prepare for vaccination.
Scanning the barcode from vaccines saves time and
reduces errors. The scanning module streamlines the
POD operations, improves efficiencies and staff
utilization.
The database and interoperable encrypted
transfer module establishes a functional platform for
data analytics and interoperable data transfer. The
data collected is organized into various formats to
support key functions. SQL-like data queries and
management functionalities are employed to support
data analysis. HL7 and EMR-standardized format are
used to push data to immunization registries and local
EMRs. This is important for IIS data transfer — IIS
is critical for overall state level planning and
management beyond the individual POD site. The
system design is modulized with simple and
extensible architecture. This allows for flexible
expansion of system functions, ease of maintenance,
and connectivity to an EMR for pre-event cross-
reference on medical / vaccination history and post-
event monitoring and assessment of the efficacy of
the medical countermeasures.
The client-communication interface module is
critical for monitoring adverse effects and
determining vaccine efficacy. This is especially
important when newly developed vaccines are being
dispensed. Public health efficacy for the vaccines can
only be obtained when clients report their response /
health effect after vaccination. The communication
interface module is essential also for sending out
updates on vaccines, or reminders (to both providers
and clients), when multiple doses of vaccine are
needed per person. These features were sorely missed
(and are still missing) during COVID-19 vaccination
(Apartsin, K. A., et al., 2021; Chekol Abebe, E., et al.,
2022; Riad, A., et al., 2021; Yadav, T., et al., 2023).
This system captures the best among the five
technologies, it is practical, implementable, and
scalable.
Figure 10: The design architecture of an electronic system
for data collection during mass vaccination.
3.4 Contribution
Documenting clients, screening, and vaccinations
administered is of particular importance during mass
vaccination, since information regarding uptake is
critical for monitoring adverse effects and vaccine
efficacy. This is especially crucial when newly
developed vaccines are being dispensed, or when
multiple doses of vaccine are needed per person.
Hence, it is important that vaccine providers
document vaccinations administrated accurately and
quickly and upload this information onto the local
Immunization Information System. These data can
provide valuable information during an emergency
and serve multiple purposes for public health
planning and research. Currently, there is no uniform
or integrated system for effective vaccine data
collection. In this paper, we describe and analyze five
types of electronic technologies for registration and
screening in vaccination clinics. We contrast their
functionalities, usability, and operations performance
based on time-motion studies and service data
collected during actual influenza vaccination
campaigns. We evaluate their dispensing
performance under an optimal dispensing clinic
Assessing Registration and Screening Technologies for Efficient Mass Vaccination and Public Health Monitoring
167

design. Our analysis shows that these electronic
technologies can improve operations and tracking
efficiency with 16% to 45% increase in overall
throughput. Based on our assessment and analyses,
we design a prototypical registration and screening
system with integrated information flow for
vaccination that can be used for dispensing,
monitoring, and assessment. The system connects to
the local Immunization Information system and
electronic medical record systems. The design is
flexible and adap and can be used by a broad spectrum
of regional public health departments.
4 CONCLUSIONS
This paper addresses the critical issue of efficient
vaccine data collection during mass vaccination
campaigns. Recognizing the importance of accurate,
timely documentation for monitoring adverse effects
and efficacy, we evaluate five electronic registration
and screening technologies to test for how quickly
immunizations could be delivered and recorded given
the different physical and cyber requirements of the
different technologies. Through time−motion studies
and service data analysis from influenza vaccination
campaigns, we demonstrate and throughput
improvements of 16% to 45%. Based on these
findings, we propose a prototypical integrated system
designed for dispensing, monitoring, and assessment,
emphasizing its flexibility and interoperability with
existing immunization and medical record systems.
During a pandemic or other vaccine-preven disease
outbreak health emergency, it is essential to vaccinate
as many people and as quickly as possible.
Documenting vaccines administered during the event
is particularly important, and vaccination administra-
tion information (i.e., patient and vaccine information)
will need to be reported to the jurisdiction’s
Immunization Information System quickly. Advanced
technologies play an irreplaceable role in healthcare
and vaccine dispensing and can be used to accelerate
the processing rate of vaccination clinics.
Few studies have investigated the time staff spend
registering clients and collecting data in a mass
vaccination or other dispensing event. This paper
presents the first study using time-motion techniques
to scrutinize point-of-dispensing operations by
analyzing five different (inexpensive and practical)
electronic technologies for data input and collection.
There are clear advantages of electronic input
technologies compared to traditional manual input
approaches. They automate or eliminate labor-
intensive tasks such as searching and typing, and
reduce manual-entry errors. These technologies can
improve POD throughput, operations efficiency, and
quantity and accuracy of collected data.
The five technologies analyzed herein offer
different input mechanisms. Scanner+WyIR and
IDWedge both scan Drivers’ drivers’ licenses to
populate demographic information, while the
vaccination information is input by staff members.
Both systems can be linked in real-time to a
jurisdiction’s immunization information system. This
assists during health screening of clients the
determination of the type of vaccination/medication
that should be used. CRA, on the other hand, allows
scanning of the vaccination information but requires
manual input of clients’ demographic information.
The two technologies that benefit from pre-
registration (HANDI and Dispense Assist) also utilize
scanning devices to facilitate input of information.
Moreover, Dispense Assist is the most flexible by
generating a QR code using data input by clients.
During observation, most on-site registrations are
done by manual form filling, even though electronic
form-filling options are available (the mobile app for
Dispense Assist, and the on-site web-based
registration for HANDI). This creates additional
workloads for both clients and staff: clients have to
spend extra time in the POD filling out the forms, and
staff need to spend extra time and pay attention to
reading the handwritings when inputting these hand-
filled forms to a computer system. Although
implemented not very efficiently at the influenza
vaccination clinic, Dispense Assist does provide a
very promising solution to overcome this issue. The
gain in throughput is remarkable.
A mobile app or website for registering clients
and disseminating knowledge regarding the type of
medical countermeasures to be dispensed is practical
and useful to the public. These sites can be accessed
easily via web browsers on clients’ mobile devices
and generate barcodes or QR codes that can later be
used for scanning. This setup can significantly reduce
the workload for POD staff and the time clients spend
inside PODs. It also improves accuracy in the data
collected.
RealOpt is a live evolving informatics decision-
support enterprise system and has over 14,000 public
health emergency response users across 50 states.
Among the hundreds of time-motion studies
conducted for real dispensing events, the results from
RealOpt simulation analysis predict the performance
of the actual system well (within 95% to 105%).
Hence, the analysis present herein provides useful
foundations and insights into the potential
DATA 2025 - 14th International Conference on Data Science, Technology and Applications
168

improvement that can be achieved by the electronic
data collection technologies.
Our analysis shows that electronic technologies for
registering and screening can improve 16% to 45% in
overall throughput. Moreover, it is not necessary for
a health department to seek the most advanced, most
cutting-edge electronic data collection technologies.
Our findings show that simple technlogy increment
(e.g. a scanner) can already provide improved
operations efficiency and data accuracy. Health
departments should carefully analyze their demand and
environment and choose the technology that best suits
their needs. Simple-to-use is key for just-in-time easy
training. Automation reduces input errors. These are all
key elements to consider during selection. Health
departments should incorporate these devices into their
routine vaccination process. This ensures staff
confidence in using the devices and that proper device
maintenance is performed.
We propose a prototypical integrated system
designed for dispensing, monitoring, and assessment,
emphasizing its flexibility and interoperability with
existing immunization and medical record systems.
The prototypical electronic system for data collection
during mass dispensing (a) transfers most of the time-
consuming tasks to clients before their arrivals to
improve efficiency; (b) enables fast and computerized
onsite registration through the online / mobile
registration tool; (c) improves data / process flow and
efficiency and reduces errors by automating the
vaccine data collection using scanning devices; (d)
connects clients to vaccine reminders, and the vaccine
effect registry where clients can report their response
and also receive vaccine update information; (e) is
easy to use and maintain; and (f) is flexibility and
scalability. In our design, we propose a synthesis of
the various techniques that would prove more efficient
than the least efficient methods while requiring a
minimally-enhanced technology and methods. This is
critical for the resource strapped public health
organizations. The system can easily accommodate
new devices to reflect the rapid advances in electronic
devices, systems, and software.
At the time of this writing, our recommendation
has been adopted by CRA. CRA has incorporated the
scanner for registration and screening, affording 45%
throughput improvement over the manual input.
This work highlights the potential of electronic
technologies to significantly enhance vaccine
administration and data management. The design is
flexible and adaptable for different types of medical
countermeasures and dispensing purposes. For
example, it can be used for prophylactic medical
countermeasure dispensing against biological attack,
or decontamination and health registration for
radiological incidents. The online registration can be
adapted based on the nature and purpose of the event.
ACKNOWLEDGEMENTS
This material is based upon work supported by the
Centers for Disease Control and Prevention. The
views and conclusions contained in this document are
those of the authors and should not be interpreted as
necessarily representing the official policies, either
expressed or implied, of the Centers for Disease
Control and Prevention.
The authors thank the students Lavannya Atri,
Aissatou B Bah, Yu Cao, Joseph Malecki,
Danielle
Mathis,
Kyumin Lee, Zhuonan Li, Parthiv Naresh,
Hunter Stroud, Pavan Thaker, and Xin Wei from
Georgia Institute of Technology for assisting in time-
motion study and data collection. We give special
thanks to Amy Parker Fiebelkorn and Dr. Samuel
Graitcer from CDC National Center for
Immunizations and Respiratory Diseases for their
invaluable guidance, insights, comments, and edits on
the paper. We thank the anonymous reviewers for
their insightful comments.
REFERENCES
Apartsin, K. A., Sverdlova, N. A., Kireeva, V. V., Riad, A.,
& Klugar, M. (2021). International COVID-19 Vaccines
Safety Tracking Study (CoVaST-RU): Participation of
the Russian Federation. Profilakticheskaya Meditsina,
24(12).
Campbell mass dispensing flu clinic, Gillette, Wyoming.
CDC report: Centers for Disease Control and Prevention.
CDC closed POD for flu vaccination, Atlanta, Georgia. CDC
report: Centers for Disease Control and Prevention.
Chekol Abebe, E., Mengie Ayele, T., Tilahun Muche, Z.,
Behaile T/Mariam, A., Dagnaw Baye, N., Mekonnen
Agidew, M., & Asmamaw Dejenie, T. (2022).
Evaluation and comparison of post-vaccination adverse
effects among Janssen and Oxford-AstraZeneca
vaccinated adult individuals in Debre Tabor Town: A
cross- sectional survey in Northwest Ethiopia. Human
Vaccines and Immunotherapeutics, 18(6).
Cot, C., Cacciapaglia, G., Islind, A. S., Óskarsdóttir, M., &
Sannino, F. (2021). Impact of US vaccination strategy on
COVID-19 wave dynamics. Scientific Reports, 11(1).
Danzon, P. M., Pereira, N. S., & Tejwani, S. S. (2005).
Vaccine Supply: A Cross-National Perspective. Health
Affairs, 24(3).
de Mesquita PJB, Roush R, Sarkar J. County-Level Planning
for Efficient Distribution of Emergency Medical
Countermeasures with RealOpt Software. Health Secur.
Assessing Registration and Screening Technologies for Efficient Mass Vaccination and Public Health Monitoring
169

2021 Sep-Oct;19(5):532-540. doi: 10.1089/hs.2021.00
26. Epub 2021 Oct 4. PMID: 34609918.
Denver public health closed POD for flu vaccination,
Denver, Colorado. CDC report: Centers for Disease
Control and Prevention.
Fast Facts on Global Immunization, Centers for Disease
Control and Prevention. https://www.cdc.gov/global-
immunization/fast-facts/index.html
Ferreira, L. S., de Almeida, G. B., Borges, M. E., Simon, L.
M., Poloni, S., Bagattini, Â. M., da Rosa, M. Q. M., Diniz
Filho, J. A. F., Kuchenbecker, R. de S., Camey, S. A.,
Kraenkel, R. A., Coutinho, R. M., & Toscano, C. M.
(2022). Modelling optimal vaccination strategies against
COVID-19 in a context of Gamma variant predominance
in Brazil. Vaccine, 40(46).
Hupert, N., Mushlin, A. I., & Callahan, M. A. (2002).
Modeling the public health response to bioterrorism:
Using discrete event simulation to design antibiotic
distribution centers. Medical Decision Making, 22(5
SUPPL.).
Kwong, J. C., Foisy, J., Quan, S., Heidebrecht, C., Kolbe, F.,
Bettinger, J. A., Buckeridge, D. L., Chambers, L. W.,
Crowcroft, N. S., Dhalla, I. A., Sikora, C. A., Willison,
D. J., Pereira, J. A., Boulianne, N., Brien, S., Deeks, S.,
Elliott, R., Finkelstein, M., Guay, M., … Quach, S.
(2010). Why collect individual-level vaccination data?
CMAJ. Canadian Medical Association Journal, 182(3).
Lee, E. K., Atallah, H. Y., Wright, M. D., Post, E. T.,
Thomas, C., Wu, D. T., & Haley, L. L. (2015).
Transforming hospital emergency department workflow
and patient care. Interfaces, 45(1). https://doi.org/10.12
87/inte.2014.0788.
Lee, E. K., Chen, C. H., Pietz, F., & Benecke, B. (2010).
Disease propagation analysis and mitigation strategies
for effective mass dispensing. AMIA ... Annual
Symposium Proceedings / AMIA Symposium. AMIA
Symposium, 2010.
Lee, E. K., Li, Z. L., Liu, Y. K., & Leduc, J. (2021). Strategies
for vaccine prioritization and mass dispensing. Vaccines,
9(5).
Lee, E. K., Liu, Y., Yuan, F., & Pietz, F. H. (2021). Strategies
for Disease Containment: A Biological-Behavioral-
Intervention Computational Informatics Framework.
AMIA Annu Symp Proc. 2021.
Lee, E. K., Maheshwary, S., Mason, J., & Glisson, W.
(2006a). Decision support system for mass dispensing of
medications for infectious disease outbreaks and
bioterrorist attacks. Annals of Operations Research,
148(1).
Lee, E. K., Maheshwary, S., Mason, J., & Glisson, W.
(2006b). Large-scale dispensing for emergency response
to bioterrorism and infectious-disease outbreak.
Interfaces, 36(6).
Lee, E. K., Pietz, F. H., Chen, C. H., & Liu, Y. (2017). An
interactive web-based decision support system for mass
dispensing, emergency preparedness, and
biosurveillance. ACM International Conference
Proceeding Series, Part F128634.
Lee, E. K., Pietz, F., Benecke, B., Mason, J., & Burel, G.
(2013). Advancing public health and medical
preparedness with operations research. Interfaces, 43(1).
Lee, E. K., Yuan, F., Pietz, F. H., Benecke, B. A., & Burel,
G. (2015). Vaccine prioritization for effective pandemic
response. Interfaces, 45(5).
Miller, M. A., Viboud, C., Olson, D. R., Grais, R. F., Rabaa,
M. A., & Simonsen, L. (2008). Prioritization of influenza
pandemic vaccination to minimize years of life lost.
Journal of Infectious Diseases, 198(3).
Nanji, K. C., Cina, J., Patel, N., Churchill, W., Gandhi, T. K.,
& Poon, E. G. (2009). Overcoming Barriers to the
Implementation of a Pharmacy Bar Code Scanning
System for Medication Dispensing: A Case Study.
Journal of the American Medical Informatics
Association, 16(5).
Oak Ridge Associated University. Catalog of electronic
technologies used for data collection at vaccination
clinics. Washington, DC: National Association of
County & City Health Officials; 2016.
Pereira, J. A., Quach, S., Hamid, J. S., Heidebrecht, C. L.,
Quan, S. D., Nassif, J., Diniz, A. J., Van Exan, R.,
Malawski, J., Gentry, A., Finkelstein, M., Guay, M.,
Buckeridge, D. L., Bettinger, J. A., Kalailieff, D., &
Kwong, J. C. (2012). Exploring the feasibility of
integrating barcode scanning technology into vaccine
inventory recording in seasonal influenza vaccination
clinics. Vaccine, 30(4).
Philadelphia department of public health Closed POD for flu
vaccination, Philadelphia, Pennsylvania. CDC report:
Centers for Disease Control and Prevention.
Platte mass dispensing flu clinic, Platte City, Missouri. CDC
report: Centers for Disease Control and Prevention.
Prieto Curiel, R., & González Ramírez, H. (2021).
Vaccination strategies against COVID-19 and the
diffusion of anti-vaccination views. Scientific Reports,
11(1).
Riad, A., Schünemann, H., Attia, S., Peričić, T. P., Žuljević,
M. F., Jürisson, M., Kalda, R., Lang, K., … Klugar, M.
(2021). Covid-19 vaccines safety tracking (Covast):
Protocol of a multi-center prospective cohort study for
active surveillance of covid-19 vaccines’ side effects.
International Journal of Environmental Research and
Public Health, 18(15).
Tisoncik, J. R., Belisle, S. E., Diamond, D. L., Korth, M. J.,
& Katze, M. G. (2009). Is systems biology the key to
preventing the next pandemic? In Future Virology (Vol.
4, Issue 6).
Wagner, C. E., Saad-Roy, C. M., & Grenfell, B. T. (2022).
Modelling vaccination strategies for COVID-19. In
Nature Reviews Immunology (Vol. 22, Issue 3).
Washington, M. L. (2009). Evaluating the capability and cost
of a mass influenza and pneumococcal vaccination clinic
via computer simulation. Medical Decision Making,
29(4).
Wein, L. M., Craft, D. L., & Kaplan, E. H. (2003).
Emergency response to an anthrax attack. Proceedings of
the National Academy of Sciences of the United States
of America, 100(7).
Yadav, T., Kumar, S., Mishra, G., & Saxena, S. K. (2023).
Tracking the COVID-19 vaccines: The global landscape.
In Human Vaccines and Immunotherapeutics (Vol. 19,
Issue 1).
DATA 2025 - 14th International Conference on Data Science, Technology and Applications
170
