
Towards a KD4LA Framework to Support Learning Analytics in
Higher Education
Thi My Hang Vu
1,2
1
Faculty of Information Technology, University of Science, Ho Chi Minh City, Vietnam
2
Vietnam National University, Ho Chi Minh City, Vietnam
Keywords: Knowledge Discovery, Education Data Mining, Learning Analytics.
Abstract: Learning analytics (LAs) involves the process of collecting, organizing, and generating insights from
educational data, such as learner assessments, learner profiles, or learner interactions with the educational
environment, to support educators and learners in decision-making. This topic has gained attention from the
community for many decades. Nowadays, with advancements in data mining and the availability of large
amounts of data from various educational environments, learning analytics presents both opportunities and
challenges. Especially in higher education, where data is more complex and data analytics is closely integrated
with pedagogical activities and objectives, a consolidated framework is crucial to support both educators and
learners in their tasks. This paper proposes a comprehensive framework, named KD4LA (Knowledge
Discovery for Learning Analytics), which clarifies essential components of common learning analytics tasks
in higher education. These tasks include generating statistical insights on student assessments, segmenting
students based on their acquired knowledge, or evaluating their proficiency in relation to learning objectives.
The proposed framework is validated through several real-world case studies to demonstrate its practical
applicability.
1 INTRODUCTION
Learning analytics (LA) involves the process of
collecting, organizing, and generating insights from
educational data, such as learner assessments, learner
profiles, or learner interactions with the educational
environment, to support educators and learners in
decision-making (Ahmad et al., 2022; Nunn et al.,
2016). This topic has gained attention from the
community for many decades.
Nowadays, with advancements in data mining
technologies and the increasing availability of large
amounts of data from various educational
environments, learning analytics presents both
opportunities and challenges (Nunn et al., 2016). On
the one hand, these advancements enable more
precise tracking of learner progress, personalized
learning experiences , and data-driven decision-
making to enhance educational outcomes
(Hernández-de-Menéndez et al., 2022; Khalil et al.,
2023). Educators can leverage learning analytics to
identify high-risk learners early, adjust learning
activities to accommodate different learner groups
and learning styles, and optimize curriculum design
based on data-driven insights (Bakharia et al., 2016).
For learners, learning analytics allows them to
monitor their own progress in relation to the required
course outcomes, helping them recognize whether
they are at risk or have the potential to achieve a top
ranking in their class (Aldowah et al., 2019; Alyahyan
& Düştegör, 2020). Additionally, students can
compare their performance with the class average,
providing motivation and self-awareness to improve
their learning strategies (Susnjak et al., 2022). On the
other hand, effectively interpreting complex data to
provide actionable insights without overwhelming
educators with excessive or irrelevant information is
essential. The low adoption rate of learning analytics
among educators indicates that current tools do not
fully align with their needs, highlighting the necessity
for more intuitive, user-friendly, and educator-centric
analytics solutions (Bere et al., 2022). Additionally,
to the best of our knowledge, few researchers have
focused on analyzing how to interpret learning
analytics results in relation to learning outcomes to
assess whether the learning design is effectively
supporting the achievement of specific knowledge.
Vu and T. M. H.
Towards a KD4LA Framework to Support Learning Analytics in Higher Education.
DOI: 10.5220/0013571000003967
In Proceedings of the 14th International Conference on Data Science, Technology and Applications (DATA 2025), pages 575-582
ISBN: 978-989-758-758-0; ISSN: 2184-285X
Copyright © 2025 by Paper published under CC license (CC BY-NC-ND 4.0)
575

This paper introduces KD4LA (Knowledge
Discovery for Learning Analytics), a comprehensive
framework designed to clarify the learning analytics
process and encompass key components to common
learning analytics tasks in higher education. These
tasks include: generating statistical insights on
student assessments, segmenting students based on
their acquired knowledge, and evaluating student
proficiency in relation to learning objectives. To
validate the proposed framework, we conduct real-
world case studies using data from selected courses at
a designated university. These case studies enable in-
depth analysis of student performance, engagement,
and learning progress. By leveraging real academic
data, the case studies demonstrate the practical
applicability of KD4LA in supporting educators with
data-driven decision-making and enhancing student
learning experiences.
The structure of the paper is as follows. Section 2
presents the methodology adopted to implement the
KD4LA framework. Section 3 summarizes related
works involving learning analytics in higher
education and identifies the research gaps. Section 4
provides details of the KD4LA framework, clarifying
the primary knowledge elements of learning analytics
in higher education and presenting a set of analytics
patterns that serve as blueprints for educators to
perform analytics tasks. Section 5 focuses on
validating the proposed framework through real-
world scenarios in higher education. Finally, Section
6 concludes the paper by discussing the implications
and limitations of the study, as well as suggesting
potential avenues for future research.
2 METHODOLOGY
This research proposes the Knowledge Discovery for
Learning Analytics (KD4LA) framework, a
knowledge-based approach to enhancing learning
design and analytics in higher education. The
framework is developed using the Design Science
Research (DSR) methodology (Dresch et al., 2015),
which focuses on creating innovative artifacts to
solve practical problems through four key phases
(Peffers et al., 2007).
Problem Identification. This phase identifies the
research questions to be addressed for building
KD4LA framework. Two key questions are
identified: RQ#1: What types of essential knowledge
can support analytics? And RQ#2: How can the
knowledge be elaborated and used effectively?.
Solution Definition. This phase defines possible
solutions to solve the identified problems.
Specifically, it defines essential knowledge types in
learning analytics and determines predefined cases to
facilitate analytics tasks. A brief literature review has
been conducted to summarize the current state-of-the-
art in the related field.
Design and Development. This phase involves
creating KD4LA artifacts. These artifacts are
classified in constructs, models, methods, and
instantiation, according to DSR methodology (Peffers
et al., 2007). The constructs define essential
knowledge types, the model formalizes relationships,
and the methods introduces predefined analytics
patterns to guide educators. Several real-world case
studies are also implemented as instantiations to
validate the practical applicability of the framework.
Constructs clarify fundamental knowledge
types for structuring learning analytical
knowledge elements and ensuring alignment
among these elements. This includes various
types of knowledge: WHO, defining whether
the analysis is for an individual, a group, or
multi-groups; WHAT, specifying the type of
data used for analytics WHY, defining the
analysis purposes; HOW, identifying suitable
analytics methods based on the WHO, WHAT,
and WHY knowledge types; CONTEXT,
adding constraints or conditions for selecting
proper analytics techniques/methods.
Model organizes the knowledge types defined
in the constructs, a data model is proposed.
This model helps in structuring WHO, WHAT,
WHY, HOW, and CONTEXT knowledge as
interrelated entities, as well as establishing
rules and dependencies to determine how
different knowledge types interact. For
instance, the data model ensures that when an
instructor needs a specific analytics purpose
(WHY) for a given dataset (WHAT), the
system automatically suggests relevant
analytics methods (HOW) while considering
additional contextual constraints (CONTEXT).
Methods predefine a collection of analytics
patterns to guide educators in performing their
tasks. These patterns encapsulate common
analytical scenarios in higher education and
serve as recommendation templates. For
example, if an instructor wants to compare
(WHY) student final grades (WHAT) across
multiple classes (WHO), the system
recommends descriptive analytics using bar
charts, boxplots, or histograms, or statistical
tests like t-tests (for two groups) or ANOVA
(for more than two groups) to determine if there
DATA 2025 - 14th International Conference on Data Science, Technology and Applications
576

are significant differences between the mean
grades of classes.
Demonstration and Evaluation. This phase
involves validating the proposed framework in real-
world situations. To assess the practical applicability
of our framework, we adopt the data model and apply
the predefined analytics patterns in some courses at a
selected university. This evaluation aims to determine
the potential of the framework in deriving meaningful
insights from learning analytics.
3 RELATED WORKS
This section provides an overview of current research
on data analytics in the education sector and identifies
research gaps that need to be addressed to enhance the
adoption of learning analytics tools among educators.
3.1 Data Analytics in Education
The data analytics, in general, can be classified in
three principal categories: descriptive, predictive, and
prescriptive analytics (Bere et al., 2022).
The first type, descriptive analytics, has gained
considerable attention from the educational
community. This type of analytics is often closely
associated with Learning Analytics Dashboards
(LADs) (Costas-Jauregui et al., 2021). Over the
years, both researchers and practitioners have
endeavored to develop interactive and intelligent
dashboards to enhance understanding and discovery
of student performance. Some studies focus on
tracking learner performance, monitor learner
assessement (Peraić & Grubišić, 2022), explore
learner interactions within a learning environment
(Kaliisa & Dolonen, 2023; Peraić & Grubišić, 2022);
while others incorporate data mining or machine
learning techniques for enhanced prediction and
deeper analysis (Peraić et al., 2025; Ramaswami et
al., 2023). The other recent research on LAD is
comprehensively reviewed in (Barbé et al., 2024;
Jayashanka et al., 2022; Masiello et al., 2024).
The second type, predictive analytics, is often
categorized under educational data mining (EDM)
(Aldowah et al., 2019). This analytics type involves
using machine learning or advanced statistical
techniques to discover hidden patterns, relationships,
or trends within educational data, subsequently
enabling accurate forecasts to support decision-
making. Specifically, predictive analytics can
forecast learner performance or retention (Alyahyan
& Düştegör, 2020, 2020; Batool et al., 2023; Bin
Roslan & Chen, 2022), classify learners into different
groups based on learning styles, behaviors, or
academic results (Dol & Jawandhiya, 2023; Križanić,
2020; Nimy & Mosia, 2023). Further relevant studies
on educational data mining can be found in (Baek &
Doleck, 2023; Romero & Ventura, 2020; Salloum et
al., 2020).
The third type, prescriptive analytics, focuses on
recommending specific actions or strategies to
optimize learning/teaching tasks (Susnjak, 2024). It
leverages advanced techniques, including AI
solutions and optimization algorithms, to suggest the
most effective interventions based on predicted
scenarios. In some instances, prescriptive analytics is
integrated with educational recommendation
systems to provide personalized suggestions tailored
to individual learners' needs and preferences (
Dhananjaya et al., 2024; George & Lal, 2021; Saito
& Watanobe, 2020). Although prescriptive analytics
is less common due to its complexity, it holds
significant potential to enhance educational decision-
making (Rivera et al., 2018).
3.2 Research Gap Identification
A recent empirical study (Bere et al., 2022) highlights
critical determinants influencing the adoption of
learning analytics, revealing that the most significant
barrier is the mismatch between educators'
capabilities and the complexity of available analytics
tools. This mismatch underscores the necessity of
aligning technological solutions with educators'
specific needs and skill levels.
From the brief summary from the related works,
most current research tends to focus heavily on
algorithms, educational models, or the application of
machine learning and traditional data mining methods
to extract meaningful insights supporting teaching
and learning practices, commonly referred to as
Educational Data Mining (EDM). Other studies
concentrate on optimizing visual representations
specifically for educational decision-making. Despite
these advancements, there remains a notable absence
of structured methodologies explicitly connecting
the essential components of data analytics;
including data types, analytical objectives, targeted
user requirements, and suitable visualization
techniques; into a cohesive framework.
To address these gaps, this paper introduces the
preliminary KD4LA framework, which clarifies the
essential components (or knowledge types) for
learning analytics by considering educators' needs
and skills within a set of predefined analytics patterns.
Towards a KD4LA Framework to Support Learning Analytics in Higher Education
577
4 KD4LA FRAMEWORK
This section outlines essential constructs of the
KD4LA framework, as well as predefined analytics
patterns designed to facilitate easier adoption and
application of analytics solutions by educators.
4.1 KD4LA Constructs and Model
The KD4LA constructs are structured in a multi-level
data model to enhance reusability and facilitate future
expansions. The model utilizes the 5W1H model
(who, what, why, when, where, and how), as
introduced by (Jang & Woo, 2012). According to the
5W1H model, the KD4LA encompasses five types of
knowledge for specifying learning analytics tasks:
target users involved in analysis (WHO), types of
learning data for analysis (WHAT), analysis purposes
(WHY), analysis methods/techniques used to process
and interpret learning data (HOW), and additional
conditions for selecting suitable analysis methods
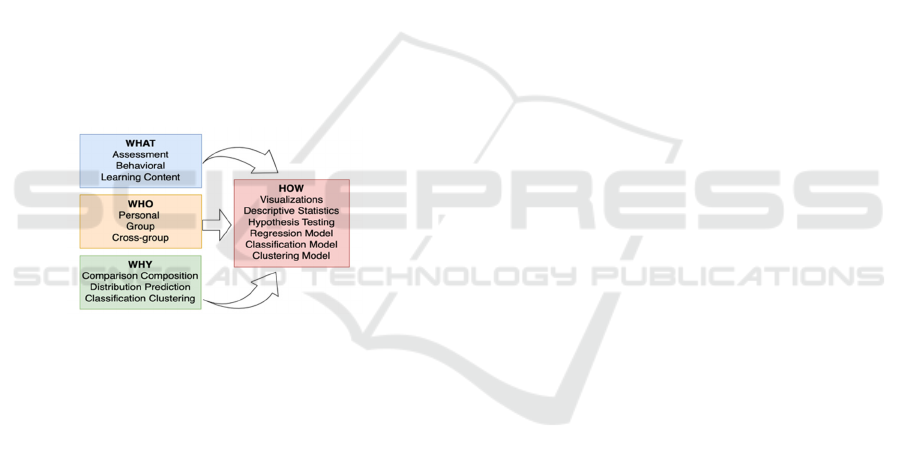
(CONTEXT). Figure 1 illustrates a comprehensive
overview of these knowledge types.
Figure 1: KD4LA Knowledge Elements.
The WHO knowledge type in learning analytics
refers to the target learners involved in the analysis.
This factor determines the scope of analysis, which
can be classified into the following scopes:
Personal analytics focuses the analysis of
individual learners by monitoring their
performance, behaviors, and learning patterns.
Group analytics concentrates on analyzing
specific groups of learners within a class or
course, providing educators with an aggregated
overview of learning outcomes, participation
levels, and overall student performance.
Cross-group analytics examines learning
outcomes across multiple groups, classified by
various criteria, to identify potential
imbalances in knowledge and competency
acquisition. This approach helps educators
determine if discrepancies in teaching methods
contribute to varying performance among
different classes or groups.
The WHAT knowledge type refers to the kinds of
data that can be collected, processed, and analyzed to
gain educational insights. In the context of university
research, learning data are primarily collected from
Learning Management Systems (LMS) and can be
classified into the following categories.
Assessment data stores student results for a
specific course. It can be categorized into
progressive assessment data (P) and final
assessment data (F). The former includes
student grades from labs, quizzes, assignments,
and other learning activities. The latter
represents the overall final course grade.
Behavioral data captures interactions between
students and the learning environment, such as
the number of clicks on learning activities, time
spent on various activities. This reveals how
frequently different learning activities are
accessed and used by students.
Learning content data involves specific
concepts, skills, or knowledge areas covered in
a course, typically structured as learning
outcomes. This enables educators to assess
whether learning activities align effectively
with intended learning objectives, identify gaps
in instructional design, and refine content to
enhance knowledge acquisition.
The WHY knowledge type refers to purposes
behind analyzing learning data, influencing the
choice of appropriate analytical methods. Informed
by analytics types (descriptive, predictive, and
prescriptive) and aligned with educators' needs, the
classification of analytical purposes is presented.
Comparision evaluates differences and
similarities across various learning data to
derive meaningful insights about student
performance, engagement, and learning
behavior.
Composition analysis examines the distribution
of participation across various learning
activities; such as lectures, quizzes; to identify
which contribute most to student success.
Distribution analysis visualizes how specific
learning data types are spread across a student
population. This method supports the
identification of student engagement or
knowledge acquisition levels, and highlights
patterns such as outliers or learning gaps.
Prediction forecasts future outcomes based on
historical data. It uses statistical models and
machine learning techniques to develop
regression models (e.g., linear or logistic
regression) to predict final grades based on
early engagement and assessment data.
DATA 2025 - 14th International Conference on Data Science, Technology and Applications
578

Classification allows identifying students at
risk of dropping out or likely to succeed, based
on historical patterns, including login
frequency or assignment completion rates.
Clustering segments students into distinct
groups based on similarities in learning
behaviors or performance, enabling educators
to implement targeted learning strategies or
interventions tailored specifically to each
group.
The HOW knowledge type refers to the specific
analytical methods used to process, interpret, and
derive actionable insights from learning data. The
choice of method depends on the WHAT (type of
data being analyzed), WHY (purpose of analysis),
and WHO (target users of the analysis). By selecting
the appropriate analytical techniques, educators and
decision-makers can effectively translate raw data
into meaningful insights that drive improvements in
teaching and learning. These methods can generally
be categorized into the following key areas.
Visualization techniques transform data into
visual representations such as graphs, charts,
heatmaps, and dashboards to help educators
and learners quickly determine trends, patterns,
and relationships within the data.
Statistical methods range from basic
descriptive statistics, like means, medians to
more advanced inferential techniques such as
hypothesis testing, regression models, and
correlation analysis. These methods enable
quantitative assessment of learning outcomes
and help identify significant factors that
influence student performance.
Machine learning models, Clustering methods,
such as K-Nearest Neighbors (KNN) and
hierarchical clustering, are used to group
students with similar performance patterns or
learning behaviors. Moreover, predictive
models can forecast student outcomes (e.g.,
risk of dropout) based on various learning
indicators, continuously refining their accuracy
as more data becomes available.
The CONTEXT knowledge type acts as a set of
conditions or constraints that further refine HOW is
determined based on WHO, WHAT, and WHY. It
ensures that the selected analytical method is suitable
for the given dataset and scenario.
4.2 KD4LA Methods
In our framework, we define a set of analytics
patterns that encapsulate the four key dimensions
(WHO, WHAT, WHY, HOW) within the educational
context. These patterns serve as predefined templates
that guide the selection of suitable analytical
methods, addressing a critical challenge faced by
many educators who struggle to clearly define their
own analytical needs or choose the appropriate
analytics approach.
Each analytics pattern takes WHO (target users),
WHAT (learning data), and WHY (analytical
purpose) as input parameters and generates possible
HOW (analytics method) to provide educators with
the most effective analytics method to address their
needs (see Figure 1, 2).
For example, in a common scenarios where a
teacher wants to compare (WHY) the final grades
(WHAT) among different classes (WHO) for a
specific course they teach in a semester. Their goal is
to evaluate the effectiveness of their teaching
methods and identify potential imbalances in student
performance across classes. Some suitable analytics
techniques for this comparison include bar charts and
histograms for visualizing grade distributions.
Additionally, mean hypothesis testing (e.g., t-tests for
two groups or ANOVA for multiple groups) can be
applied to determine whether there is a statistically
significant difference in the mean final grades among
classes. The CONTEXT component ensures that the
selected analytical method is appropriate for the given
dataset and scenario. For example, in mean
hypothesis testing, if comparing two groups with a
sample size of less than 30, a t-test (Student’s t-test)
is the appropriate choice.
Figure 2: Examples of KD4LA Analytics Patterns.
5 VALIDATION
In the validation phase of the KD4LA framework, a
comprehensive suite of analytics is applied to two
specific courses at a selected university, enabling the
confirmation and refinement of insights derived from
educational data. This phase leverages visualization
techniques, such as bar charts, histograms, and box
plots, to transform complex data into intuitive, easily
interpretable formats, allowing educators to quickly
identify trends, patterns, and anomalies.
Towards a KD4LA Framework to Support Learning Analytics in Higher Education
579
To ensure consistency and accuracy, the collected
data undergoes serious preprocessing tasks. First,
data cleaning removes missing or inconsistent entries.
Next, the dataset is organized into a standardized
CSV format to streamline analysis. Then, data
transformation converts categorical variables (e.g.,
engagement levels) into numerical representations
suitable for statistical evaluation. Figure 3 illustrates
sample representations of the processed dataset in
CSV format.
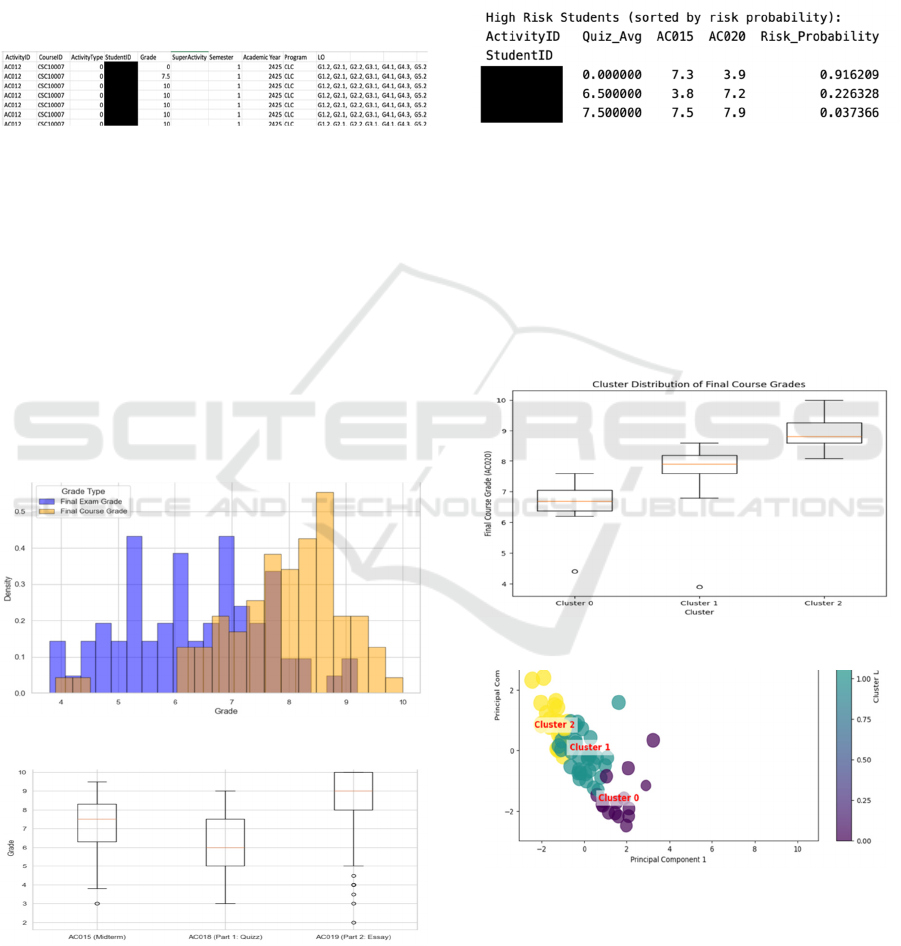
Figure 3: Sample Data for Validating KD4LA Framework.
Three case studies will be conducted using the
sample data to uncover valuable educational insights.
Case Study #1: Assessing Grade Distribution
Across a Course. This case study investigates the
distribution (WHY) of assessment data (WHAT);
specifically, final exam grades and final course
grades; for an entire class enrolled in a course
(WHO). Using histograms (Figure 4) and box plots
(HOW) (Figure 5), the study visualizes how these
grades are distributed, allowing for a comparative
evaluation of exam performance against overall
course outcomes (see Figure 4).
Figure 4: Grade Distribution using Histograms.
Figure 5: Grade Distribution using Boxplots.
Case Study #2: Identifying At-Risk Students.
In this case study, a logistic regression model was
used to identify students who are at high risk of failing
a course based on their quiz average (Quiz_Avg),
midterm exam grade (AC015), and final course grade
(AC020). Figure 6 shows a subset of these students
sorted by their predicted risk probability, illustrating
how certain combinations of low final grades and
inconsistent midterm performance can indicate a
higher likelihood of failure.
Figure 6: Identifying At-Risk Students.
Case Study #3: Clustering Students. This case
study groups students into distinct clusters based on
shared performance patterns across quizzes, midterm,
and final exam grades (see Figures 7 and 8). By
examining each cluster’s average grades and bubble
sizes, educators can design targeted strategies for
improvement (for Cluster 0), maintain steady support
(for Cluster 1), and provide enrichment (for Cluster 2).
Figure 7: Student Clustering.
Figure 8: Cluster Visualization.
6 CONCLUSION
This section summarizes the paper’s contributions
and outlines future research directions.
DATA 2025 - 14th International Conference on Data Science, Technology and Applications
580

In terms of contributions, the paper first proposes
a comprehensive knowledge model that integrates
various types of knowledge within the context of
learning analytics (LA). This model offers educators
a holistic view of how different knowledge types can
be leveraged to facilitate data-driven insights. The
second contribution is a structured method that
defines a set of predefined analytics patterns.
Through the case studies, the paper demonstrates the
feasibility of implementing the proposed framework
in real-world educational settings.
In terms of future research, the framework
remains in an early conceptual stage, presenting
opportunities for further development and
refinement. In future work, a key objective is to create
a web-based tool that streamlines interaction between
educators and learners, enabling them to access and
utilize analytics more intuitively. Additionally,
expanding the repository of analytics patterns is
required to enrich the predefined analytics cases,
providing deeper insights into student performance,
engagement, and other critical learning factors. These
enhancements will not only broaden the framework’s
applicability but also foster more robust, data-driven
decision-making in diverse educational contexts.
ACKNOWLEDGEMENTS
This research is funded by University of Science,
VNU-HCM under grant number CNTT 2023-09.
REFERENCES
Ahmad, A., Schneider, J., Griffiths, D., Biedermann, D.,
Schiffner, D., Greller, W., & Drachsler, H. (2022).
Connecting the dots – A literature review on learning
analytics indicators from a learning design perspective.
Journal of Computer Assisted Learning, jcal.12716.
Aldowah, H., Al-Samarraie, H., & Fauzy, W. M. (2019).
Educational data mining and learning analytics for 21st
century higher education: A review and synthesis.
Telematics and Informatics, 37, 13–49.
Alyahyan, E., & Düştegör, D. (2020). Predicting academic
success in higher education: Literature review and best
practices. International Journal of Educational
Technology in Higher Education, 17(1), 3.
Baek, C., & Doleck, T. (2023). Educational Data Mining
versus Learning Analytics: A Review of Publications
From 2015 to 2019. Interactive Learning
Environments, 31(6).
Bakharia, A., Corrin, L., De Barba, P., Kennedy, G.,
Gašević, D., Mulder, R., Williams, D., Dawson, S., &
Lockyer, L. (2016). A conceptual framework linking
learning design with learning analytics. Proceedings of
the Sixth International Conference on Learning
Analytics & Knowledge - LAK ’16.
Barbé, R., Encelle, B., & Sehaba, K. (2024). Adaptation in
Learning Analytics Dashboards: A Systematic Review:
Proceedings of the 16th International Conference on
Computer Supported Education, 75–86.
Batool, S., Rashid, J., Nisar, M. W., Kim, J., Kwon, H.-Y.,
& Hussain, A. (2023). Educational data mining to
predict students’ academic performance: A survey
study. Education and Information Technologies, 28(1).
Bere, A., Chirilele, P., & Chitiga, R. (2022). Critical
Determinants for Learning Analytics Adoption in
Higher Education. In International Association for
Development of the Information Society. International
Association for the Development of the Information
Society.
Bin Roslan, M. H., & Chen, C. J. (2022). Educational Data
Mining for Student Performance Prediction: A
Systematic Literature Review (2015-2021).
International Journal of Emerging Technologies in
Learning (iJET).
Costas-Jauregui, V., Oyelere, S. S., Caussin-Torrez, B.,
Barros-Gavilanes, G., Agbo, F. J., Toivonen, T., Motz,
R., & Tenesaca, J. B. (2021). Descriptive Analytics
Dashboard for an Inclusive Learning Environment.
2021 IEEE Frontiers in Education Conference.
Dhananjaya, G. M., Goudar, R. H., Kulkarni, A. A., Rathod,
V. N., & Hukkeri, G. S. (2024). A Digital
Recommendation System for Personalized Learning to
Enhance Online Education: A Review. IEEE Access,
12, 34019–34041. IEEE Access.
Dol, S. M., & Jawandhiya, P. M. (2023). Classification
Technique and its Combination with Clustering and
Association Rule Mining in Educational Data
Mining—A survey. Engineering Applications of
Artificial Intelligence, 122.
Dresch, A., Lacerda, D. P., & Antunes Jr, J. A. V. (2015).
Design Science Research: A Method for Science and
Technology Advancement.
George, G., & Lal, A. M. (2021). A Personalized Approach
to Course Recommendation in Higher Education.
International Journal on Semantic Web and
Information Systems.
Hernández-de-Menéndez, M., Morales-Menendez, R.,
Escobar, C. A., & Ramírez Mendoza, R. A. (2022).
Learning analytics: State of the art. International
Journal on Interactive Design and Manufacturing
(IJIDeM), 16(3).
Jang, S., & Woo, W. (2012). 5W1H: Unified User-Centric
Context. 2.
Jayashanka, R., Hettiarachchi, E., & Hewagamage, K. P.
(2022). Technology Enhanced Learning Analytics
Dashboard in Higher Education. Electronic Journal of
E-Learning, 20(2), pp151-170.
Kaliisa, R., & Dolonen, J. A. (2023). CADA: A teacher-
facing learning analytics dashboard to foster teachers’
awareness of students’ participation and discourse
patterns in online discussions. Technology, Knowledge
and Learning, 28(3), 937–958.
Towards a KD4LA Framework to Support Learning Analytics in Higher Education
581

Khalil, M., Prinsloo, P., & Slade, S. (2023). The use and
application of learning theory in learning analytics: A
scoping review. Journal of Computing in Higher
Education, 35(3), 573–594.
Križanić, S. (2020). Educational data mining using cluster
analysis and decision tree technique: A case study.
International Journal of Engineering Business
Management, 12.
Masiello, I., Mohseni, Z. (Artemis), Palma, F., Nordmark,
S., Augustsson, H., & Rundquist, R. (2024). A Current
Overview of the Use of Learning Analytics
Dashboards. Education Sciences, 14(1), Article 1.
Nimy, E., & Mosia, M. (2023). Web-based Clustering
Application for Determining and Understanding
Student Engagement Levels in Virtual Learning
Environments. E-Journal of Humanities, Arts and
Social Sciences, 4–19.
Nunn, S., Avella, J. T., Kanai, T., & Kebritchi, M. (2016).
Learning Analytics Methods, Benefits, and Challenges
in Higher Education: A Systematic Literature Review.
Online Learning, 20(2).
Peffers, K., Tuunanen, T., Rothenberger, M. A., &
Chatterjee, S. (2007). A Design Science Research
Methodology for Information Systems Research.
Journal of Management Information Systems, 24(3),
Article 3.
Peraić, I., & Grubišić, A. (2022). Development and
Evaluation of a Learning Analytics Dashboard for
Moodle Learning Management System. In G.
Meiselwitz, A. Moallem, P. Zaphiris, A. Ioannou, R. A.
Sottilare, J. Schwarz, & X. Fang (Eds.), HCI
International 2022—Late Breaking Papers. Interaction
in New Media, Learning and Games (Vol. 13517, pp.
390–408).
Peraić, I., Grubišić, A., & Pintarić, N. (2025). Machine
Learning in Learning Analytics Dashboards: A
Systematic Literature Review. 2025 IEEE 23rd World
Symposium on Applied Machine Intelligence and
Informatics (SAMI), 000047–000052.
Ramaswami, G., Susnjak, T., Mathrani, A., & Umer, R.
(2023). Use of Predictive Analytics within Learning
Analytics Dashboards: A Review of Case Studies.
Technology, Knowledge and Learning, 28(3), 959–980.
Rivera, A. C., Tapia-Leon, M., & Lujan-Mora, S. (2018).
Recommendation Systems in Education: A Systematic
Mapping Study. In Á. Rocha & T. Guarda (Eds.),
Proceedings of the International Conference on
Information Technology & Systems.
Romero, C., & Ventura, S. (2020). Educational data mining
and learning analytics: An updated survey. WIREs Data
Mining and Knowledge Discovery, 10(3), e1355.
Rowley, J. (2007). The wisdom hierarchy: Representations
of the DIKW hierarchy. Journal of Information
Science, 33(2).
Saito, T., & Watanobe, Y. (2020). Learning Path
Recommendation System for Programming Education
Based on Neural Networks: International Journal of
Distance Education Technologies, 18(1), 36–64.
Salloum, S. A., Alshurideh, M., Elnagar, A., & Shaalan, K.
(2020). Mining in Educational Data: Review and Future
Directions. In A.-E. Hassanien, A. T. Azar, T. Gaber,
D. Oliva, & F. M. Tolba (Eds.), Proceedings of the
International Conference on Artificial Intelligence and
Computer Vision.
Susnjak, T. (2024). Beyond Predictive Learning Analytics
Modelling and onto Explainable Artificial Intelligence
with Prescriptive Analytics and ChatGPT.
International Journal of Artificial Intelligence in
Education, 34(2), 452–482.
Susnjak, T., Ramaswami, G. S., & Mathrani, A. (2022).
Learning analytics dashboard: A tool for providing
actionable insights to learners. International Journal of
Educational Technology in Higher Education, 19(1),
12.
DATA 2025 - 14th International Conference on Data Science, Technology and Applications
582
