
Data Storytelling in Learning Analytics: AI-Driven Competence
Assessment
Ainhoa Álvarez
a
, Aitor Renobales-Irusta
b
and Mikel Villamañe
c
Department of Computer Languages and Systems University of the Basque Country UPV/EHU, Spain
Keywords: Learning Analytics, Generative Artificial Intelligence, Data Storytelling, Dashboards.
Abstract: Learning dashboards have become very popular, but the information shown on them is often difficult to
interpret by users. Different authors have worked to improve dashboards including narratives or data
storytelling techniques. However, creating these narratives is a complex process. Several studies have begun
to analyse the use of GenAI tools to generate these narratives in a scalable way, but this is still an area of
study that is at an early stage. In this paper, we present a proposal and a study aimed at generating narratives
using GenAI, extending previous work by aligning the generated narratives with the curriculum design of the
course. We first present a proposal for generating the narratives and then a study to evaluate their adequacy.
1 INTRODUCTION
A learning analytic dashboard is “a single display
that aggregates different indicators about learner(s),
learning process(es) and/or learning context(s) into
one or multiple visualizations” (Schwendimann
et al., 2017). Dashboards have gained popularity as a
tool to show analytical data regarding students
(Pozdniakov et al., 2025), and thus, providing
teachers with insights about the learning process of
their students (Fernandez-Nieto et al., 2024).
However, these dashboards are often challenging to
interpret by teachers and usually provide no guidance
on how to interpret them (Fernandez Nieto et al.,
2022). Several authors have worked in the inclusion
of explanatory features, for example, through Data
Storytelling (Fernandez-Nieto et al., 2024). Those
approaches are very powerful but generating the
narratives is a complex process that requires much
effort from creators (Li et al., 2024) and therefore,
some works have begun to explore the use of
Generative Artificial Intelligence (GenAI) to
automate and ease their generation in a scalable way
(Pinargote et al., 2024).
In a previous work (Villamañe, Mikel et al.,
2025), authors have begun to explore the use of
a
https://orcid.org/0000-0003-0735-5958
b
https://orcid.org/0000-0002-2148-9269
c
https://orcid.org/0000-0002-4450-1056
Generative AI to facilitate the comprehension of
dashboards and reduce the problem of data-literacy
lack that some teachers face when presented with
dashboards. Authors enhanced the dashboards
generated by the AdESMuS system (Alvarez et al.,
2020) with GenAI capabilities. As shown in Figure 1,
GenAI was introduced with three main objectives:
give general explanations about the chart, provide
interpretations about the data shown in the chart and
provide pedagogical insights and recommendations
in order to facilitate teachers taking remediation
actions when needed.
Figure 1: Dashboard with GenAI capabilities.
536
Álvarez, A., Renobales-Irusta, A., Villamañe and M.
Data Storytelling in Learning Analytics: AI-Driven Competence Assessment.
DOI: 10.5220/0013567300003967
In Proceedings of the 14th International Conference on Data Science, Technology and Applications (DATA 2025), pages 536-543
ISBN: 978-989-758-758-0; ISSN: 2184-285X
Copyright © 2025 by Paper published under CC license (CC BY-NC-ND 4.0)

We also carried out a study with 15 teachers, and
one of its conclusions was that it could be useful to
relate assessment items to the contents of the course
in order to enhance the recommendations given by the
GenAI tool. This involves aligning pedagogical
intentions and course curriculum design with the
narratives about the data as other authors (Pinargote
et al., 2024) have also suggested.
In this paper, we address the alignment of
narratives with the curriculum design of the course
and present an initial approach. We present how we
propose to tackle the alignment and a study aimed at
answering these research questions:
RQ1: How does providing course curriculum
design information to GenAI influence the
depth and utility of pedagogical insights?
RQ2: To what extent do conclusions derived
from GenAI-driven analysis align with
pedagogical intentions and expectations of the
teachers?
This paper first presents some previous works
related to the study carried out. Next, the study design
is presented followed by the obtained results, a
discussion about them and finally some conclusions
and future work are presented.
2 PREVIOUS WORKS
This section resumes a preliminary study conducted
by the authors and that sets the basis of the work
presented in this paper. It also depicts the definition
of the ontology for the domain and student data used
in this work.
2.1 Preliminary Study
Previous to this work, in (Villamañe, Mikel et al.,
2025) we presented the use of GenAI to enhance
dashboards in different aspects. One of those aspects
was related to the generation of pedagogical
conclusions about the data shown in the charts (see
Figure 1) and providing recommendations so that the
teacher could take remediation actions.
To this end, we used the prompt template shown
in Table 1, along with any of the charts displayed on
the dashboard showing the student's performance
across different assessment items of the course (see
Figure 1), and asked the GenAI to provide the teacher
with conclusions about the performance of the
student.
Table 1: Prompt template.
I am a university professor and I would like you to
indicate in a maximum of 250 words what
conclusions can be drawn from the data contained in
the attached file and indicate if you consider that I
should make any recommendation to the person to
improve their learning process. I don't need you to
describe the information, just give me the conclusions
and recommendations in a general way, focusing only
on those elements that are es
p
eciall
y
relevant.
This process was repeated with the charts of
several students and Table 2 shows some of the
sentences included in the conclusions and
recommendations generated by the GenAI.
Table 2: Sentences selected from the answers generated by
the GenAI.
This suggests a relatively solid knowledge in this topic
Here the student shows a deep understanding of the
topic
It would be useful for him to strengthen his knowledge
in analysis and design.
It is suggested to dedicate more time to studying and
practicing topics related to Elem3, considering the
possibility of requesting additional support or tutoring.
As can be seen in Table 2, the system introduces
sentences such as “
This suggests a relatively solid
knowledge in this topic”. However, the system does not
know the topics each assessment item is related to, so
it can not derive more insightful conclusions. For
example, what happens if there are two assessment
items related to the same topic and with very different
performance results?
Our thesis is that relating the curriculum design
that defines the course topics or competences to the
assessment items would create more comprehensive
and more useful information for the teacher.
2.2 Ontology for Domain and Student
Data
The objective of this paper is to analyse the
comparative impact of curriculum design-enriched
versus standard performance-based prompts on the
effectiveness of AI-generated learning
recommendations included in dashboards. We have
therefore defined an ontology to formalise the domain
model for the curriculum structure including its
competences, learning units, learning materials, and
other related elements, as well as the student model
with the student-related information.
Data Storytelling in Learning Analytics: AI-Driven Competence Assessment
537
The domain model represents “the skills,
knowledge and strategies of the topic being tutored”
(Sottilare et al., 2016). It defines a conceptual
framework to represent all the elements and
relationships within a course. There are many ways to
represent the domain model but it is important for the
model to be general enough to be able to integrate
data from different sources, such as Learning
Management Systems (LMS) or Intelligent Tutoring
Systems (ITS) (Samuelsen et al., 2019).
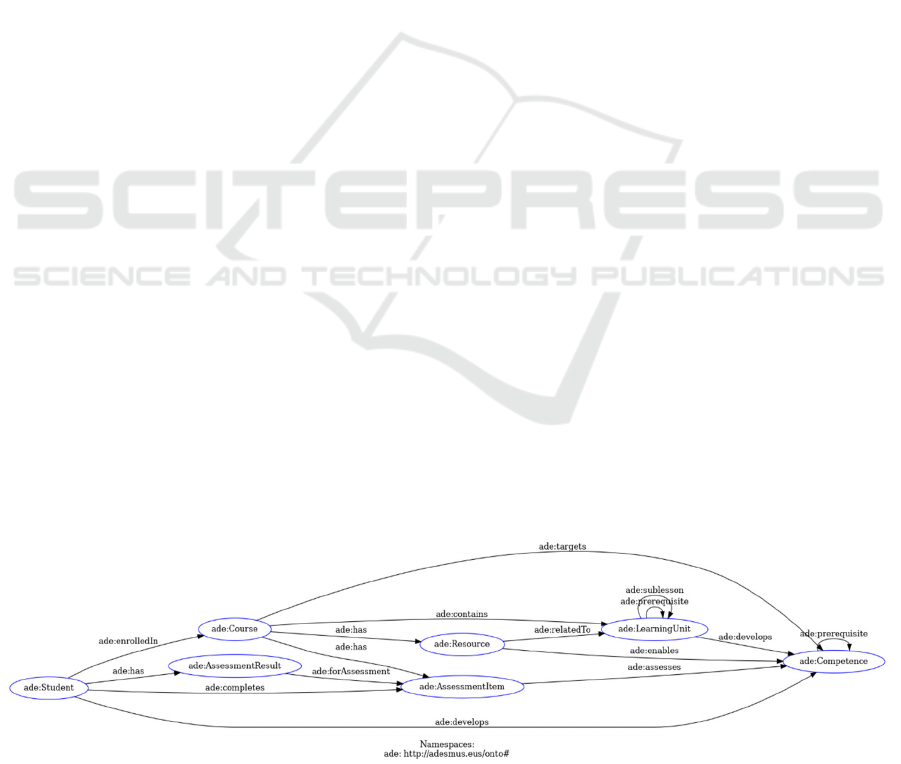
Figure
2
shows an excerpt of the domain model
ontology used, which is an extension of the ontology
defined in (Villamañe et al., 2018) that has been
successfully used in previous studies. It is also
founded on the Competence-based knowledge space
theory (CbKST) (Idrissi et al., 2017) and the domain
models of classical educational systems (Aleven
et al., 2023). This ontology provides a framework for
structuring educational content of courses with a
focus on competence-based learning, establishing
clear relationships between learning units, resources,
activities, and the competences they help develop. It
defines five core entities: Courses, Resources,
LearningUnits, AssessmentItems, and Competences,
connected through various relationships. This
structure creates a comprehensive framework that
links educational content, activities, and assessments
to the skills and knowledge learners should acquire.
This structure is general enough to accommodate
information coming from different educational
systems such as ITSs or LMSs as Moodle, and it can
incorporate data from different courses. That is, the
ontology is not dependent on any specific course or
educational system.
Figure
2
also shows the main elements of the
student model that are used in this study. Taking into
account that a key element of any student model is the
student performance data (Pelánek, 2022), we have
included the student general information together
with the representation of its relationship to courses,
assessment items, and competences.
3 STUDY DESIGN
To evaluate and validate our proposal, we conducted
an initial study involving two teachers from the
course Analysis and Design of Information Systems
and the assessment data of the 60 students enrolled in
the course. In this section, we present the design of
the study detailing the competences defined for the
course and the student data collection together with
the methodology used for the study.
The process and instruments used in the study
were approved by the Ethics Commission for
Research and Teaching (CEID/IIEB) of the
University of the Basque Country UPV/EHU with
code M10-2016-181 and informed consent was
obtained from all individual participants included in
the study. Following the recommendations of the
ethics commission, all direct identifiers and attributes
that could potentially be used to identify students
were supressed. Afterwards, a numerical id was
randomly assigned to each student.
3.1 Competence and Student Data
Definition
As mentioned before, the aim of this study is to
analyse whether it would be interesting to enhance the
system with course information in order to obtain
more insightful conclusions and recommendations.
To that end it is necessary to populate the prompt
template used in the preliminary work (see Table 1),
with information following the ontology shown in
Figure 2.
First, the teachers defined the main competences
of the course, as shown in Table 3. These
competences were then linked to the assessment items
that students should complete throughout the course.
Figure 2: Extract of the defined ontology.
DATA 2025 - 14th International Conference on Data Science, Technology and Applications
538
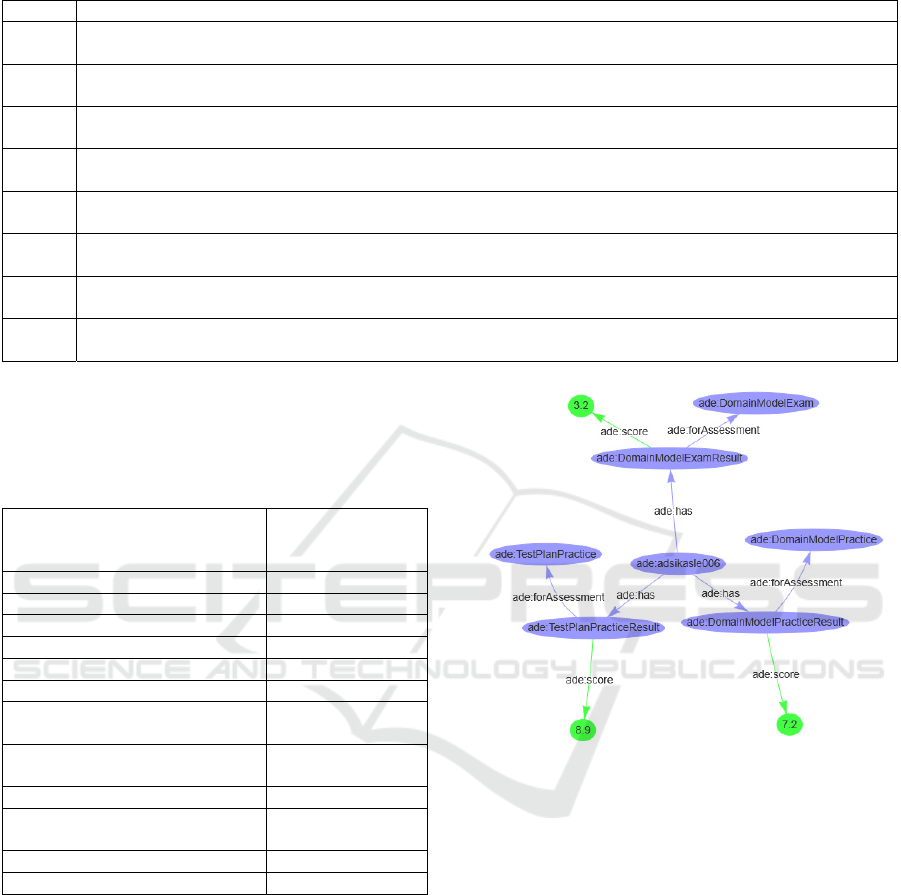
Table 3: Course Competences.
CODE COMPETENCE
C1 Interact with users to gather requirements for information systems, ensuring clear understanding of
stakeholder needs through effective communication techniques.
C2 Identify client requirements for software development projects, translating business needs into functional
s
p
ecifications usin
g
UML methodolo
g
ies.
C3 Create data models that represent information structures and relationships, using UML class diagrams and
entit
y
-relationshi
p
models for database desi
g
n.
C4 Analyse software specifications to determine feasibility and technical approaches, evaluating requirements
against system constraints in information systems development.
C5 Create flowcharts and UML diagrams to visualize system processes, data flows, and interactions between
com
p
onents in software desi
g
n.
C6 Plan software tests to verify functionality and validate that information systems meet requirements, developing
com
p
rehensive test cases and scenarios.
C7 Program computer systems by implementing designs into functional code, translating UML models into
working software components.
C8 Write project documentation that clearly explains system architecture, design decisions, and implementation
details for information system stakeholders.
Table 4 shows the relationship between the course
competences and the assessment items.
Table 4: Assessment items and their relation with the course
competences.
ASSESSMENT ITEM
RELATED
COMPETENCES
(CODE)
Use Case Exa
m
C1, C2
Domain Model Exa
m
C2, C3
Anal
y
sis and Desi
g
n Exa
m
C4, C5
Extended Use Cases Practice C1, C2
Domain Model Practice C2, C3
Test Plan Practice C6
Communication Diagrams
Practice
C4, C5
Class Diagram and Relational
Schema Practice
C3, C4
Se
q
uence Dia
g
rams Practice C4, C5
Final Practice and
Documentation
C3, C5, C8
Im
p
lementation Practice C7
Test Im
p
lementation Practice C6
Next, the assessment data of the 60 students
enrolled in the course was collected from Moodle and
formatted according to the defined ontology.
Figure
3 shows an extract of the graphical
representation of some of the information related to
the student with id 006.
All the structured information was then used to
populate the prompt template before submitting it to
the GenAI. The data was structured into JSON-LD
format to assure its readability and scalability.
Figure 3: Extract of student 006 assessment data.
3.2 Methodology
To analyse the utility and alignment of the
conclusions and recommendations provided by the
GenAI with those of the educators, teachers
participating in the study were invited to assess the
reliability and appropriateness of the results for a
sample of the group.
Since the opinions of the teachers are subjective
and depend on their own perceptions, this analysis
was approached as a qualitative study. Therefore, the
students selected to be part of the sample were
purposefully chosen based on the variety they
contributed to the study, as recommended by the
literature (Abrams, 2010; Shaw & Holland, 2014).
To that end, and with the collaboration of the
course teachers, the different situations that could
arise among the students of the course were defined.
Data Storytelling in Learning Analytics: AI-Driven Competence Assessment
539

The situations described next were identified by the
teachers, who considered various potential scenarios
that could occur in the course:
1. No data at all.
2. Missing some data.
3. All competences acquired.
4. Not all competences acquired
Next, students were distributed among the
situations considering their assessment data. From
each situation, as many students as necessary were
randomly selected to maintain the percentage of
representativeness of each situation in the sample,
which size was decided to be of 15 students (25% of
the population) aligning with recommendations in
research literature for studies employing random
sampling techniques (Boddy, 2016).
Table 5 shows the percentage of students that met
the criteria to be assigned into each situation defined
by the teachers, the number of students to be selected
from those in each situation and the id of the
randomly selected students.
Table 5: Distribution of students among the different
situations and selected students for the sample.
Situation
Percentage
of students
Number of
students
selected
Selected
students
(id)
1 1.7% 1 014
2 15% 2 038 049
3 55% 8
003 020
004 023
006 043
016 052
4 28.3% 4
013 039
035 058
4 RESULTS
With the students for the sample selected, the prompt
template was used with the assessment data of each
of these students. Then, the teachers participating in
the study were asked to indicate on a Likert-scale of
1 to 5 their level of alignment with the narrative
generated by the GenAI. With 1 being the lowest
level of alignment and 5 indicating that they strongly
agreed with the recommendations and conclusions
obtained. They also had an open-ended question to
include other comments.
When evaluating the results for the students in
situation number 4 (not all competences acquired),
teachers stated that the narratives generated by the
GenAI were not adequate.
As shown in Table 6, the AI highlights some
inconsistencies such as the student achieving
significantly different results in assessment items that
assess the same competence.
Table 6: First version of generated conclusions and
recommendations.
Conclusions and Recommendations for Student
006
The student demonstrates a notably better
performance in practical activities (average of 7.5)
than in theoretical exams (average of 5.1),
suggesting a greater aptitude for practical
application of knowledge rather than theoretical
conceptualization.
The student particularly excels in competencies
related to software testing planning (8.9) and
technical diagram development (8.2-8.5), showing
strengths in technical and design aspects.
However, there is a significant weakness in the
"create data models" competency, evidenced by
the low score in the Domain Model Exam (3.2),
although paradoxically the student obtains good
results in the corresponding practical work (7.2).
Recommendations:
1. Strengthen theoretical understanding of
domain models and their conceptualization,
possibly through study techniques that better
connect theory with the practical skills already
mastered.
2. Work on the "identify client requirements"
competency, where the student shows
disparate results between exams and practical
work.
3. Maintain the good performance in design and
documentation competencies, which
constitute the student's strengths.
4. Implement study strategies that allow
transferring evident practical capability to the
theoretical domain, possibly through self-
assessment exercises or exam simulations.
Discussions with the teachers participating in the
study revealed that this inconsistency was due to the
fact that the assessment item “Domain Model Exam”
was carried out individually, while the “practical
work” was carried out in groups.
The distinction between whether an assessment
item is conducted individually or in groups is crucial
in this case. A student who scores very low on
individual components but very high on group
components may be benefiting from the work of their
peers, indicating that competency acquisition may not
be occurring adequately, despite student’s average
grades concealing this fact.
DATA 2025 - 14th International Conference on Data Science, Technology and Applications
540

Following the analysis of the initial test, the
ontology, and therefore, the JSON-LD were updated
to include information on the categorisation of each
assessment item as either individual or in-group and
a new analysis was requested to the GenAI using the
same prompt template as before.
Table 7 shows the main differences among the
conclusions and recommendations for the same
student including the new information.
Table 7: Extract from generated conclusions and
recommendations.
Conclusions and recommendations for student
006
The student shows contrasting performance
between individual and group assessments.
….
This difference suggests possible difficulties in
applying theoretical knowledge individually or
problems with exam pressure.
Recommendations:
1. Strengthen individual study ….
2. Practice more individual domain
modeling exercises ....
3. Develop strategies to transfer skills
demonstrated in group work to individual
assessment contexts.
…
The student has demonstrated potential in
practical environments but needs to consolidate
their autonomy in applying theoretical concepts to
improve their overall per
f
ormance.
In this occasion, the GenAI suggests that the
student should engage in additional individual study
and practical exercises to consolidate knowledge. The
GenAI also indicates the possibility that the student
may experience challenges in managing the pressure
of an exam.
As this GenAI generated narrative was considered
more adequate by the teachers, the study was
replicated and completed using the adjusted ontology
and JSON-LD to populate the prompt template for all
the students in the sample. Next, teachers evaluated
their alignment with the new narratives.
Table 8 shows, for each situation and for each
student selected, the average value of teachers’
alignment with the GenAI provided narrative.
Table 8: Alignment measure for the sample.
Situation
Student
(id)
Ali
g
nment
score
(average
among
teachers
)
Ali
g
nment
score
(average
for the
situation
)
1 014 5 5
2
038 2
2.25
049 2.5
3
003 5
4.38
004 3.5
006 4
016 3.5
020 4.5
023 5
043 4.5
052 5
4
013 5
4.38
035 4.5
039 4
058 4
5 DISCUSSION
The analysis of the generated narratives reveals that
the information generated by the AI references
specific competences such as 'create data models'
which helps in better understanding which are the
student’s strengths and weaknesses. This finding
directly addresses our first research question (RQ1).
When providing curriculum design information, the
results show that GenAI provides more insightful
conclusions and recommendations. This represents a
significant enhancement of the generated narratives
and facilitates teachers identifying the precise
competences in which students need specific support.
Addressing our second research question —
examining the extent to which GenAI-driven analysis
aligns with teachers' pedagogical intentions and
expectations— we analysed data in Table 8. The
results demonstrate high alignment across most
situations what positively answers RQ2. However,
for situation number 2 the agreement with the GenAI
generated narrative for all of its students (049 and
038) was considerably lower. This situation
represents cases in which some of the data is missing
because the students have not completed some of the
assessment items. In these cases, the GenAI
highlighted low scores in one of the exams but failed
to mention that the student had not completed the
other two exams, leaving out critical missing data.
Data Storytelling in Learning Analytics: AI-Driven Competence Assessment
541

As these omissions are important from an
educational perspective, the prompt should be refined
to include specific instructions for addressing
incomplete student assessment data.
Despite this limitation, the overall high alignment
suggests that, when provided with appropriate
curriculum design information, GenAI tools can
produce insights that closely correspond to what
experienced educators would identify as
pedagogically relevant. This alignment between
teachers’ expectations and generated narratives
affirmatively answers our second research question
(RQ2) whilst identifying specific areas for the
improvement.
6 CONCLUSIONS
Learning analytics dashboards are very popular but
present many problems to users. One of the main ones
is related to the difficulties users face to interpret data
shown on dashboards. To reduce this problem several
authors have proposed the enhancement of those
dashboards with narratives. This has shown positive
results but generating the narratives is a complex
process with a great workload. In this paper, we have
presented a proposal that enhances dashboards with
narratives automatically generated by GenAI tools.
The presented proposal has been validated in a course
with two participating teachers and the data of 60
students.
Populating the prompts with a context that defines
the course curriculum design to align the narratives
with them is very promising and significantly
enhances their relevance and usefulness for
educators. By incorporating course context into the
prompts, the generated conclusions are more detailed
and aligned with pedagogical goals, providing
actionable recommendations for teachers (RQ1).
The generated narratives were evaluated by
teachers and found to closely align with their own
interpretations of student performance, as evidenced
by a high average alignment score higher than 4 on a
1 to 5 Likert scale (RQ2).
Although the study was conducted with a
relatively small sample, the results are encouraging,
and the outcomes point to significant potential. This
emphasizes the value of including the curriculum
design of the course on the prompts. Therefore, we
plan to continue the proposal validation process with
a larger participant base, conducting further
experiments across different courses and areas of
knowledge to test its potential generalization.
The results have also shown some aspects that can
be improved that we next point as future work.
Learning Management systems do not often
include the option to define the curriculum design and
relate assessment items to it using a systematic
approach. Therefore, in the near future we plan to
create a way to facilitate the definition of the
curriculum design of the course and to relate it to the
learning assessment items. We plan to start doing this
for Moodle as it is one of the most used Learning
Management System in higher education settings
(García-Murillo et al., 2020).
We also plan to improve the domain and student
data ontologies using educational standards and
semantic web techniques in order to ensure its
flexibility and applicability.
Some limitations were also identified. For
example, the GenAI occasionally omitted references
to assessment items not completed by students, which
impacted the comprehensiveness of its conclusions.
Addressing such omissions will require refining the
prompts to account for incomplete data scenarios.
Finally, it is important to address the ethical
concerns associated with the use of GenAI in
generating educational recommendations. Our
approach is designed to support, not replace, the
teachers’ role. The GenAI generated narratives are
intended to be supplementary, providing additional
insights based on the data available. To safeguard the
accuracy and integrity of the educational process, we,
as other authors (Chiu, 2024), propose
comprehensive training for the teachers. This training
will ensure teachers are aware of the limitations and
ethical considerations of using GenAI, thereby
maintaining their essential role in the decision-
making processes.
ACKNOWLEDGEMENTS
This work was partially funded by the Department of
Education, Universities and Research of the Basque
Government (ADIAN, IT-1437-22) and grant
RED2022-134284-T.
REFERENCES
Abrams, L. S. (2010). Sampling ‘Hard to Reach’
Populations in Qualitative Research: The Case of
Incarcerated Youth. Qualitative Social Work, 9(4), 536-
550. https://doi.org/10.1177/1473325010367821
Aleven, V., Rowe, J., Huang, Y., & Mitrovic, A. (2023).
Domain modeling for AIED systems with connections
DATA 2025 - 14th International Conference on Data Science, Technology and Applications
542

to modeling student knowledge: A review. En B. Du
Boulay, A. Mitrovic, & K. Yacef (Eds.), Handbook of
Artificial Intelligence in Education (pp. 127-169).
Edward Elgar Publishing. https://doi.org/10.4337/
b9781800375413.00017
Alvarez, A., Villamañe, M., & Ibargutxi, L. (2020).
Helping Teachers to Identify Students at Risk and
Analyze their Learning Process. Eighth International
Conference on Technological Ecosystems for
Enhancing Multiculturality, 747-751. https://doi.org/
10. 1145/3434780.3436645
Boddy, C. R. (2016). Sample size for qualitative research.
Qualitative Market Research: An International
Journal, 19(4), 426-432. https://doi.org/10.1108/QMR-
06-2016-0053
Chiu, T. K. F. (2024). The impact of Generative AI (GenAI)
on practices, policies and research direction in
education: A case of ChatGPT and Midjourney.
Interactive Learning Environments, 32(10), 6187-
6203. https://doi.org/10.1080/10494820.2023.2253861
Fernandez Nieto, G. M., Kitto, K., Buckingham Shum, S.,
& Martinez-Maldonado, R. (2022). Beyond the
Learning Analytics Dashboard: Alternative Ways to
Communicate Student Data Insights Combining
Visualisation, Narrative and Storytelling. LAK22: 12th
International Learning Analytics and Knowledge
Conference, 219-229. https://doi.org/10.114
5/3506860.3506895
Fernandez-Nieto, G. M., Martinez-Maldonado, R.,
Echeverria, V., Kitto, K., Gašević, D., & Buckingham
Shum, S. (2024). Data Storytelling Editor: A Teacher-
Centred Tool for Customising Learning Analytics
Dashboard Narratives. Proceedings of the 14th
Learning Analytics and Knowledge Conference, 678-
689. https://doi.org/10.1145/3636555.3636930
García-Murillo, G., Novoa-Hernández, P., & Rodríguez, R.
S. (2020). Technological Satisfaction About Moodle in
Higher Education—A Meta-Analysis. IEEE Revista
Iberoamericana de Tecnologias del Aprendizaje, 15(4),
281-290. IEEE Revista Iberoamericana de Tecnologias
del Aprendizaje. https://doi.org/10.1109/RITA.20
20.3033201
Idrissi, M. K., Hnida, M., & Bennani, S. (2017).
Competency-Based Assessment: From Conceptual
Model to Operational Tool. En E. Cano & G. Ion (Eds.),
Innovative Practices for Higher Education Assessment
and Measurement. https://doi.org/10.4018/978-1-5225-
0531-0.ch004
Li, H., Wang, Y., & Qu, H. (2024). Where Are We So Far?
Understanding Data Storytelling Tools from the
Perspective of Human-AI Collaboration. Proceedings
of the 2024 CHI Conference on Human Factors in
Computing Systems, 1-19.
https://doi.org/10.1145/3613904.3642726
Pelánek, R. (2022). Adaptive, Intelligent, and Personalized:
Navigating the Terminological Maze Behind
Educational Technology. International Journal of
Artificial Intelligence in Education, 32(1), 151-173.
https://doi.org/10.1007/s40593-021-00251-5
Pinargote, A., Calderón, E., Cevallos, K., Carrillo, G.,
Chiluiza, K., & Echeverria, V. (2024). Automating data
narratives in Learning Analytics Dashboards using
GenAI. 2024 Joint of International Conference on
Learning Analytics and Knowledge Workshops, 150-
161. https://research.monash.edu/en/publications/
automating-data-narratives-in-learning-analytics-
dashboards-using
Pozdniakov, S., Martinez-Maldonado, R., Tsai, Y.-S.,
Echeverria, V., Swiecki, Z., & Gasevic, D. (2025).
Investigating the Effect of Visualization Literacy and
Guidance on Teachers’ Dashboard Interpretation.
Journal of Learning Analytics, 1-25. https://doi.org/
10.18608/jla.2024.8471
Samuelsen, J., Chen, W., & Wasson, B. (2019). Integrating
multiple data sources for learning analytics—Review of
literature. Research and Practice in Technology
Enhanced Learning, 14(1), 11. https://doi.org /10.1186
/s41039-019-0105-4
Schwendimann, B. A., Rodríguez-Triana, M. J., Vozniuk,
A., Prieto, L. P., Boroujeni, M. S., Holzer, A., Gillet,
D., & Dillenbourg, P. (2017). Perceiving Learning at a
Glance: A Systematic Literature Review of Learning
Dashboard Research. IEEE Transactions on Learning
Technologies, 10(1), 30-41. IEEE Transactions on
Learning Technologies. https://doi.org/10.1109/TLT
.2016.2599522
Shaw, I., & Holland, S. (2014). Doing Qualitative Research
in Social Work. SAGE Publications, Ltd.
https://doi.org/10.4135/9781473906006
Sottilare, R. A., Graesser, A., Hu, X., Olney, A., Nye, B.
D., & Sinatra, A. (2016). Design Recommendations for
Intelligent Tutoring Systems: Volume 4-Domain
Modeling (Vol. 4). US Army Research Laboratory.
https://www.semanticscholar.org/paper/Design-Reco
mmendations-for-Intelligent-Tutoring-Sottilare-Grae
sser/745d7f28e1718ed095c9d934aa4342a4be6fc3e3
Villamañe, M., Alvarez, A., & Larranaga, M. (2018, abril).
Supporting competence-based learning with visual
learning analytics and recommendations. 2018 IEEE
Global Engineering Education Conference
(EDUCON). https://doi.org/10.1109/educon.2018
.8363421
Villamañe, Mikel, Renobales-Irusta, Aitor, & Alvarez,
Ainhoa. (2025). A Preliminary Study on the Use of
Generative Artificial Intelligence to Enrich
Dashboards. Proceedings of Csedu 2025. 17th
International Conference on Computer Supported
Education, Porto, Portugal.
Data Storytelling in Learning Analytics: AI-Driven Competence Assessment
543
