
Containerizing the PowerAPI Architecture to Estimate Energy
Consumption of Software Applications
Daniel Guam
´
an
1 a
, Alejandra Barco-Blanca
2
, Vanessa Rodr
´
ıguez-Horcajo
2 b
and Jennifer P
´
erez
2 c
1
Universidad T
´
ecnica Particular de Loja, Loja, Ecuador
2
Universidad Polit
´
ecnica de Madrid, Madrid, Spain
Keywords:
Software Engineering, PowerAPI, RAPL, Energy Consumption, Sustainability, Software Containerization.
Abstract:
The widespread adoption of cloud architectures and the use of information technologies have a significant im-
pact on software sustainability, particularly in terms of energy consumption. PowerAPI is a toolkit designed
to estimate the energy consumption of software applications. It integrates hardware performance counters
(HWPC) and SmartWatts formulas to analyze energy usage at different abstraction levels, providing enough
accurate estimation metrics to drive an energy-efficient software design. However, its configuration deploy-
ment may be complex. In this work, we aim to extend its use by facilitating its deployment. To that end, we
present a study that explores the containerization of PowerAPI in two different measurement contexts. From
the results of this study, a middleware solution to estimate the energy consumption of software applications,
called PowerAPIDocker-Cloud, has been constructed. PowerAPIDocker-Cloud implements a scalable and re-
producible energy consumption monitoring process in two different contexts: (i) Java Model-View-Controller
(MVC) desktop monolithic applications and (ii) containerized microservices MVC applications written in dif-
ferent programming languages. The experimentation carried out during the study demonstrates the feasible
measurement of 29 applications in the first context and 4 applications in the second context. The set of ex-
periments show that PowerAPIDocker-Cloud is a reusable mechanism to easily and effectively estimate the
energy consumption of MVC software applications using PowerAPI. In addition, the experiments contribute
insights into how to design energy-efficient architectures and to identify resource-efficient programming tech-
niques that can contribute to reduce the environmental impact of MVC software applications in containerized
environments.
1 INTRODUCTION
The adoption of cloud architectures and the
widespread use of information technologies play a
key role in the sustainability of software, influencing
its development and use (Kocak, 2013). Indus-
tries, organizations, and individuals using cloud
software and services contribute significantly to
energy consumption, posing challenges in software
sustainability. Energy efficiency, as a key aspect of
sustainable development, seeks to optimize energy
consumption throughout the entire lifecycle of
software, from design to implementation, making re-
quirements specification a critical factor in improving
software energy performance (Agarwal et al., 2012).
In the context of energy efficiency, Green IT and
a
https://orcid.org/0000-0002-2681-565X
b
https://orcid.org/0009-0007-6401-6078
c
https://orcid.org/0000-0003-3192-7995
Green Software establish practices, frameworks and
metrics to promote sustainability in the development
and evolution of software products (Bozzelli et al.,
2013). These approaches seek to reduce software
complexity by optimizing its quality, performance
and energy consumption at different levels of abstrac-
tion, such as architecture, source code, instructions
and deployment platforms, both on-premise and in the
cloud (Pazowski et al., 2015).
Research on monitoring, evaluation and manage-
ment of energy consumption in software and infras-
tructure has led to the definition of sustainability prin-
ciples applicable to software engineering and archi-
tecture, as well as energy metrics and measurement
tools, such as jRAPL, (Liu et al., 2015), RAPL (David
et al., 2010) and PowerAPI (Fieni et al., 2024). Eval-
uating the energy efficiency of software is a key as-
pect in sustainability, since operating costs are con-
sidered to mitigate the environmental impact and re-
Guamán, D., Barco-Blanca, A., Rodríguez-Horcajo, V., Pérez and J.
Containerizing the PowerAPI Architecture to Estimate Energy Consumption of Software Applications.
DOI: 10.5220/0013560100003964
In Proceedings of the 20th International Conference on Software Technologies (ICSOFT 2025), pages 327-335
ISBN: 978-989-758-757-3; ISSN: 2184-2833
Copyright © 2025 by Paper published under CC license (CC BY-NC-ND 4.0)
327

duce the carbon footprint of software products. How-
ever, despite the advances in Green Software and soft-
ware sustainability, a challenge within the field is to
measure, analyze and optimize energy consumption
through standardized tools that could be used in dif-
ferent contexts. Setting up and using these measure-
ment tools is not a simple task. Therefore, in this
work, PowerAPIDocker-Cloud is presented as a con-
tainerized middleware to effectively collect the en-
ergy data in different environments using PowerAPI
and allow software engineers to make informed de-
cisions for dealing with energy-efficient software de-
sign. Configuring and deploying PowerAPI in a con-
tainerized environment addresses the need for a scal-
able and reproducible energy consumption monitor-
ing infrastructure independently of the kind of soft-
ware under measurement. To evaluate the effective-
ness of PowerAPIDocker-Cloud and its versatility, it
has been validated in two different contexts: (i) mono-
lithic desktop Java applications built with the MVC
architectural pattern, and (ii) containerized MVC ap-
plications built with microservices and programmed
in different languages (Torvekar and Pravin, 2019).
This paper is organized as follows: Section 2 de-
scribes the required background about PowerAPI and
its toolkit. Section 3 presents the construction of
PowerAPIDocker-Cloud. Section 4 details the experi-
mentation and evaluation of PowerAPIDocker-Cloud.
Section 5 discusses the results obtained from the
study execution. Finally, the conclusions and future
work are presented in Section 6.
2 PowerAPI
Grant et al. (Grant et al., 2016) describe PowerAPI
as a middleware able to measure energy consump-
tion at different levels: system components, software
process and user usage, providing a complete set of
energy metrics. PowerAPI’s power consumption esti-
mation relies on the configuration of user-defined sen-
sors that collect raw data and process it using a Power
Model, i.e. an energy consumption model that en-
ables power consumption estimation in software sys-
tems (Fieni et al., 2024).
Figure 1 shows the software power consumption
estimation process that PowerAPI implements. This
process consists of 5 steps: (1) A sensor collects raw
metrics from the computer where the software appli-
cations under energy consumption monitoring are be-
ing executed, being incompatible its use in a virtual
machine. (2) Metrics (power, cpu usage) are stored in
a database to be used by the software power consump-
tion estimation model. (3) The Power Estimation
Model uses machine learning techniques to estimate
the power consumption of software applications us-
ing the collected raw data measurements. This model
is auto-calibrated when it is necessary. (4) The en-
ergy consumption estimated values that are generated
by the Power Estimation Model are stored in another
database. (5) Finally, these values are used to op-
timize the software applications under measurement
from an energy consumption standpoint.
The software power meter of PowerAPI is com-
posed of two components: the HWPC sensor and the
formulas (see Figure 1). (a) The HWPC sensor gener-
ates detailed low-level metrics that can be controlled
directly from the processor based on the RAPL tech-
nology. The RAPL interface formula obtains the con-
sumption of the entire CPU, the information from the
system registers (MSR) about the energy consump-
tion and the SmartWatts formula processes the data
of each system process individually. The SmartWatts
formula defines a power estimation model based on a
linear regression model of the sckit-learn library (Pe-
dregosa et al., 2011), which is self-calibrated by using
appropriate performance counters and an error thresh-
old provided by the power meter.
3 PowerAPIDocker-Cloud: A
CONTAINERIZED SOLUTION
FOR MEASURING ENERGY
CONSUMPTION USING
PowerAPI
3.1 Deploying PowerAPI in a
Containerized Environment
PowerAPIDocker-Cloud implements the PowerAPI
architecture in a containerized environment (see Fig-
ure 1). The containerization is carried out through the
installation and configuration of the sensor and for-
mula, the integration of each component and the con-
figuration of the platforms Docker (Rad et al., 2017),
Docker Compose and Docker Engine. This container-
ized environment allows for collecting metrics of soft-
ware applications energy consumption, independently
of their development technology. In order to validate
its feasibility, in this work we have deployed it in two
different contexts that allow to measure MVC appli-
cations: (i) Context 1: Monolithic applications, and
(ii) Context 2: Containerized microservices applica-
tions.
The goal of PowerAPIDocker-Cloud is to be a
reproducible deployment model,independently of the
ICSOFT 2025 - 20th International Conference on Software Technologies
328
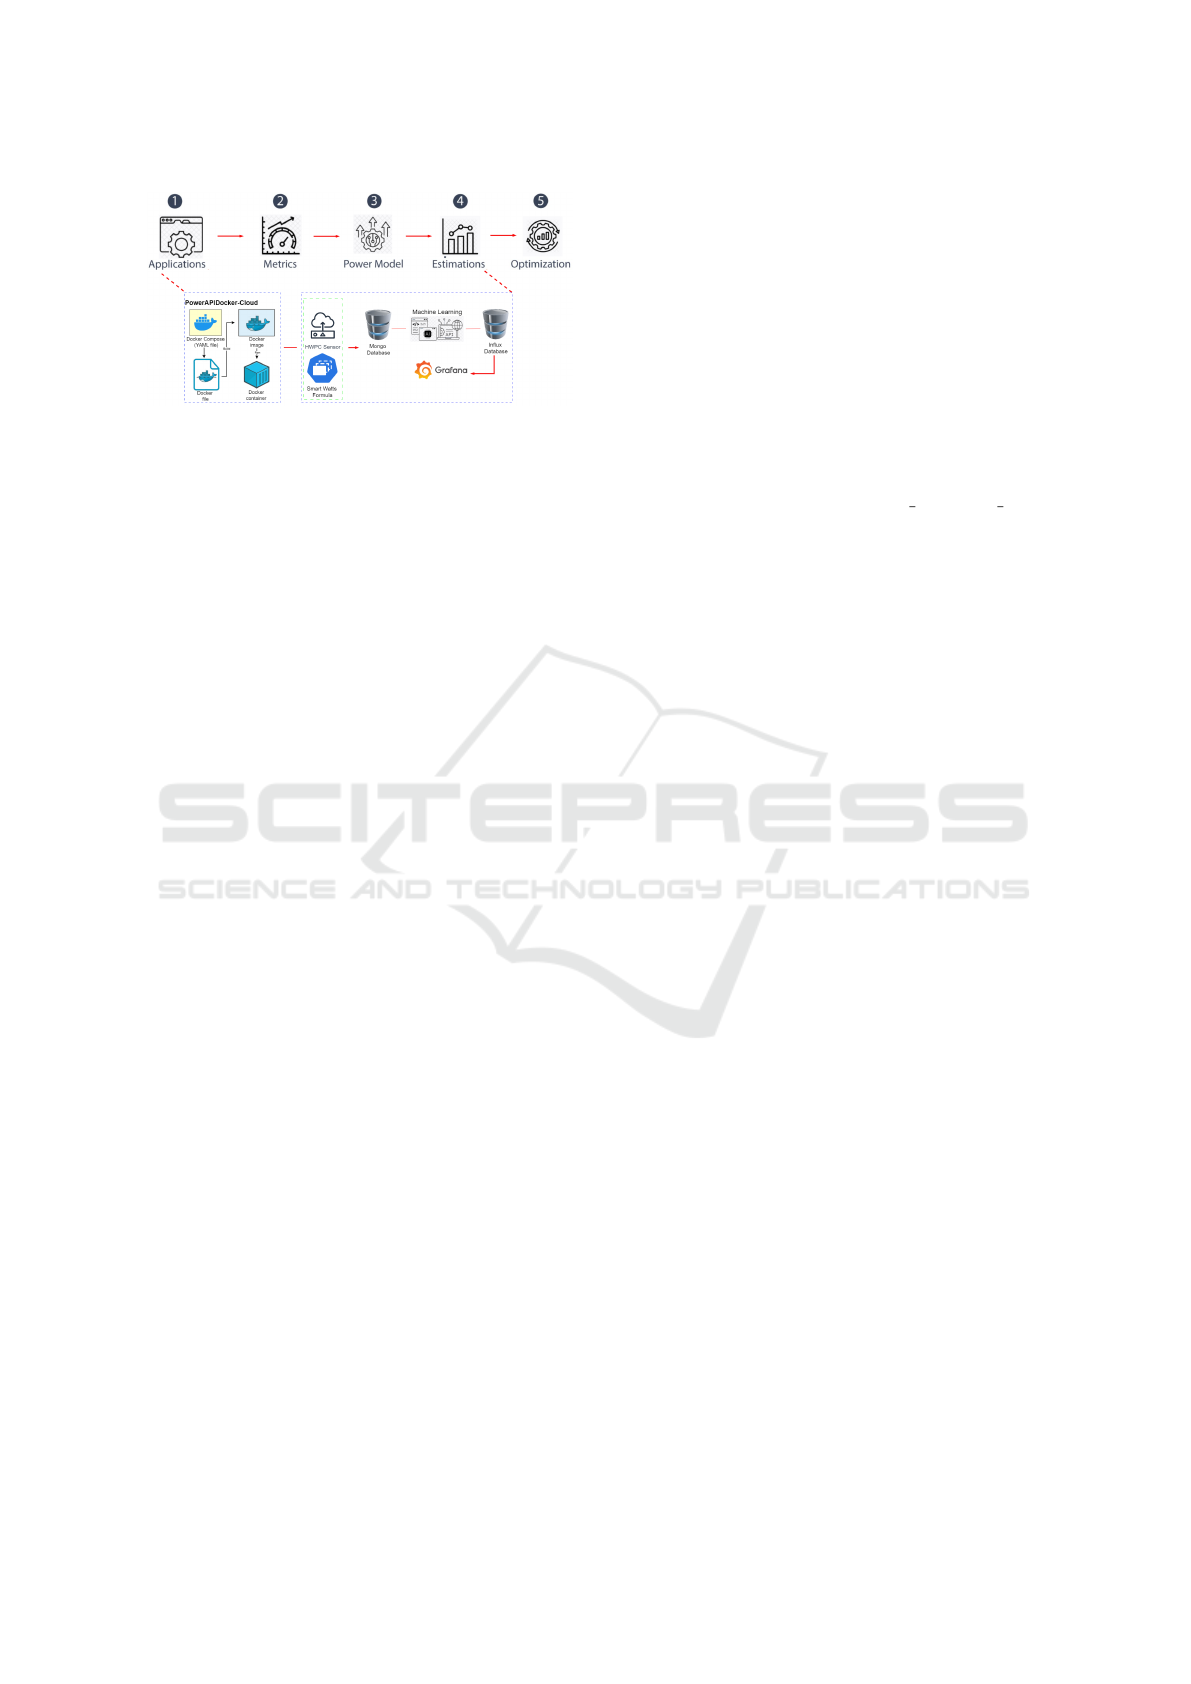
Figure 1: PowerAPIDocker-Cloud Architecture.
kind of software under measurement, which serves as
a guide and support for researchers who require col-
lecting energy consumption measurements. In both
contexts, PowerAPIDocker-Cloud requires the cloud
images of the Mongo and Influx Databases for stor-
ing the data and estimations, as well as the com-
mon sensor and the configurations. However, the ef-
fective containerization of PowerAPI in each context
presents several differences and technical considera-
tions that are detailed as follows:
Context 1: The MVC applications under measure-
ment are programmed in Java. For their power con-
sumption measurement, PowerAPI and its compo-
nents are installed in PowerAPIDocker-Cloud in a
Docker Container. To run each application under
measurement, a NetBeans image is installed into the
Docker Container of PowerAPIDocker-Cloud. In this
way, the installation will allow consistency, reuse and
portability of the Docker Container.
Context 2: The MVC applications are programmed
with different programming languages implementing
a microservices software architecture. In this context,
unlike the previous scenario, several Docker Con-
tainers are required in PowerAPIDocker-Cloud, since
each application has its own configurations. The ca-
pabilities offered by Docker allow for rapid code de-
livery, testing, and deployment, thus significantly re-
ducing the time between code creation and deploy-
ment.
3.2 PowerAPIDocker-Cloud
Configuration
PowerAPIDocker-Cloud is a guidance for software
engineers and architectures about how to use Power-
API in a containerized way in order to be reusable
and replicable in different settings. In particular, this
work addresses two different contexts of deployment.
To that end, a set of common configurations must be
performed. They are detailed as follows.
PowerAPI- HWPC Sensor: There are different op-
tions for using the HWPC sensor, which also uses
the RAPL technology for monitoring the power con-
sumption of the CPU or RAM. In this work, since
we seek to monitor the power consumption of the
container of the application under measurement, the
CORE option is selected.
PowerAPI-SmartWatts Formula: This formula re-
ceives the metrics provided by the HWPC sensor to
estimate the software’s energy consumption. Each
time the CPU error threshold is reached (cpu-error-
threshold), it will learn a new Power Model from pre-
vious reports. It is important to determine the CPU
frequency of the hardware used for the measurement,
since the formula uses this information to calculate
energy consumption.The configuration for estimating
the power consumption uses RAPL ENERGY PKG
of RAPL (Running Average Power) and the TSC,
APERF and MPERF events from the MSR (Model
Specific Register) as components that allow access to
a processor’s energy meters.
Mongo and Influx Database: In these two contexts,
MongoDB and InfluxDB are used to store the values
of the measurements, that are processed by the Power
Model through the PowerAPI Machine Learning pro-
cess and then visualized by the Grafana’s Power Re-
port. The selected configuration uses MongoDB for
storing the measurements, whereas InfluxDB is used
for storing the energy consumption estimations.
Grafana: The measurement data stored in Influx
Database, which are the energy estimation data cal-
culated by the SmartWatts formula, are displayed in
Grafana and then its dashboard is configured for pre-
senting the energy consumption data in real time.
Dashboard to Visualize Data: To visualize en-
ergy monitoring data, a query must be configured in
Grafana by selecting the data source, in this case, In-
fluxDB previously configured. In our case, for real-
time monitoring, a display range of the last 10 min-
utes is configured, and the dashboard is updated ev-
ery 5 seconds, allowing for dynamic and continuous
monitoring.
4 EXPERIMENTATION AND
EVALUATION OF
PowerAPIDocker-Cloud
The experimental study conducted in this work to
evaluate the containerized PowerAPI environment
(PowerAPIDocker-Cloud) has a twofold objective: (i)
to prove that it is feasible to measure and estimate
the power consumption of applications in both con-
texts and (ii) to use these estimations to extract knowl-
edge about the energy consumption behaviors of the
kind of applications under measurement. In particu-
Containerizing the PowerAPI Architecture to Estimate Energy Consumption of Software Applications
329
lar, three research questions were formulated to ad-
dress these two objectives. RQ1 answers the first
objective, whereas RQ2 and RQ3 answer the second
one:
• RQ1: Is it possible to measure the energy con-
sumption of software applications programmed
with different software architectures and pro-
gramming languages using a containerized Pow-
erAPI environment?
• RQ2: Does the execution time of a functionality
influence in the energy consumption or CPU val-
ues measured by PowerAPIDocker-Cloud?
• RQ3: Does the type of CRUD (Create-Read-
Update-Delete) operation of an application in-
fluence in the energy consumption? What kind
of operation (Create-Read-Update-Delete) has the
highest energy consumption?
To rigorously address the experimental study, an ex-
ecution context was established and a set of experi-
ments were designed to measure the energy consump-
tion of the software applications in both contexts.
To suitably measure the energy consumption of
the applications using the PowerAPIDocker-Cloud in
the two defined contexts, the configuration of the en-
vironment and the definition of the parameters used
for the sensor and formula were defined. The activ-
ities of this process are detailed following: (1) Cre-
ate the configuration file, (2) Start and run contain-
ers. In the first context, the NetBeans 8.2 IDE must
be deployed, whereas in the second context, the con-
tainer images and configurations for each application
will be downloaded from GitHub. (3) Store the initial
data generated by the measuring equipment prior to
the measurement. (4) Start and run Grafana, (5) Ex-
ecute the application to be monitored from the con-
tainer that holds the application to be measured. The
application is executed, and its modules and function-
alities begin to be used for a specific period of time,
ensuring that all the main functionalities are tested
at least once and all applications are executed during
the same time (Mancebo et al., 2021). (6) Measure
the application, when the Docker containers and the
HWPC Sensor services are started, the databases and
the formula for obtaining energy consumption data in
each container are also initiated. However, data mea-
surement is saved in the Influx Database once the ap-
plication is running. (7) With the data saved in Influx
Database in real time, graphs are displayed in Grafana
showing these data. To do this, we introduce the query
that shows the last two minutes of the container’s ex-
ecution, while the output is exported in .CSV format
from Grafana with the consumption data of each ap-
plication with an interval of 1 second. It should be
noted that, although we can modify parameters in the
dashboard display, it will be the query that responds
to the exported file, for later analysis and comparison.
These steps of the process are executed as many times
as applications we need to measure.
4.1 Measurements in Context 1
The Context 1 is characterized for measuring a dataset
of 29 desktop MVC applications implemented in
Java. This dataset is obtained from the previous stud-
ies of Guaman et al. (Guam
´
an et al., 2023)(Guam
´
an
et al., 2022). The measurement procedure and the re-
sults obtained are detailed as follows.
Measurement: The 29 characterized applications
were measured in this experimentation. To determine
the required execution time to evaluate all applica-
tions for the same duration without bias, we selected
the ones with the most functionalities. This allows us
to define a time period that covers the testing of all
their features. From this execution we determine that
2 minutes was enough to execute all the functionali-
ties at least once. Therefore, each of the 29 applica-
tions were measured during a period of 2 minutes by
executing the query “query time > now - 2m”. The
energy consumption data is collected in an interval of
1 second each data, obtaining the energy consumption
in Watts per second (W/s) during the 2 minutes of ex-
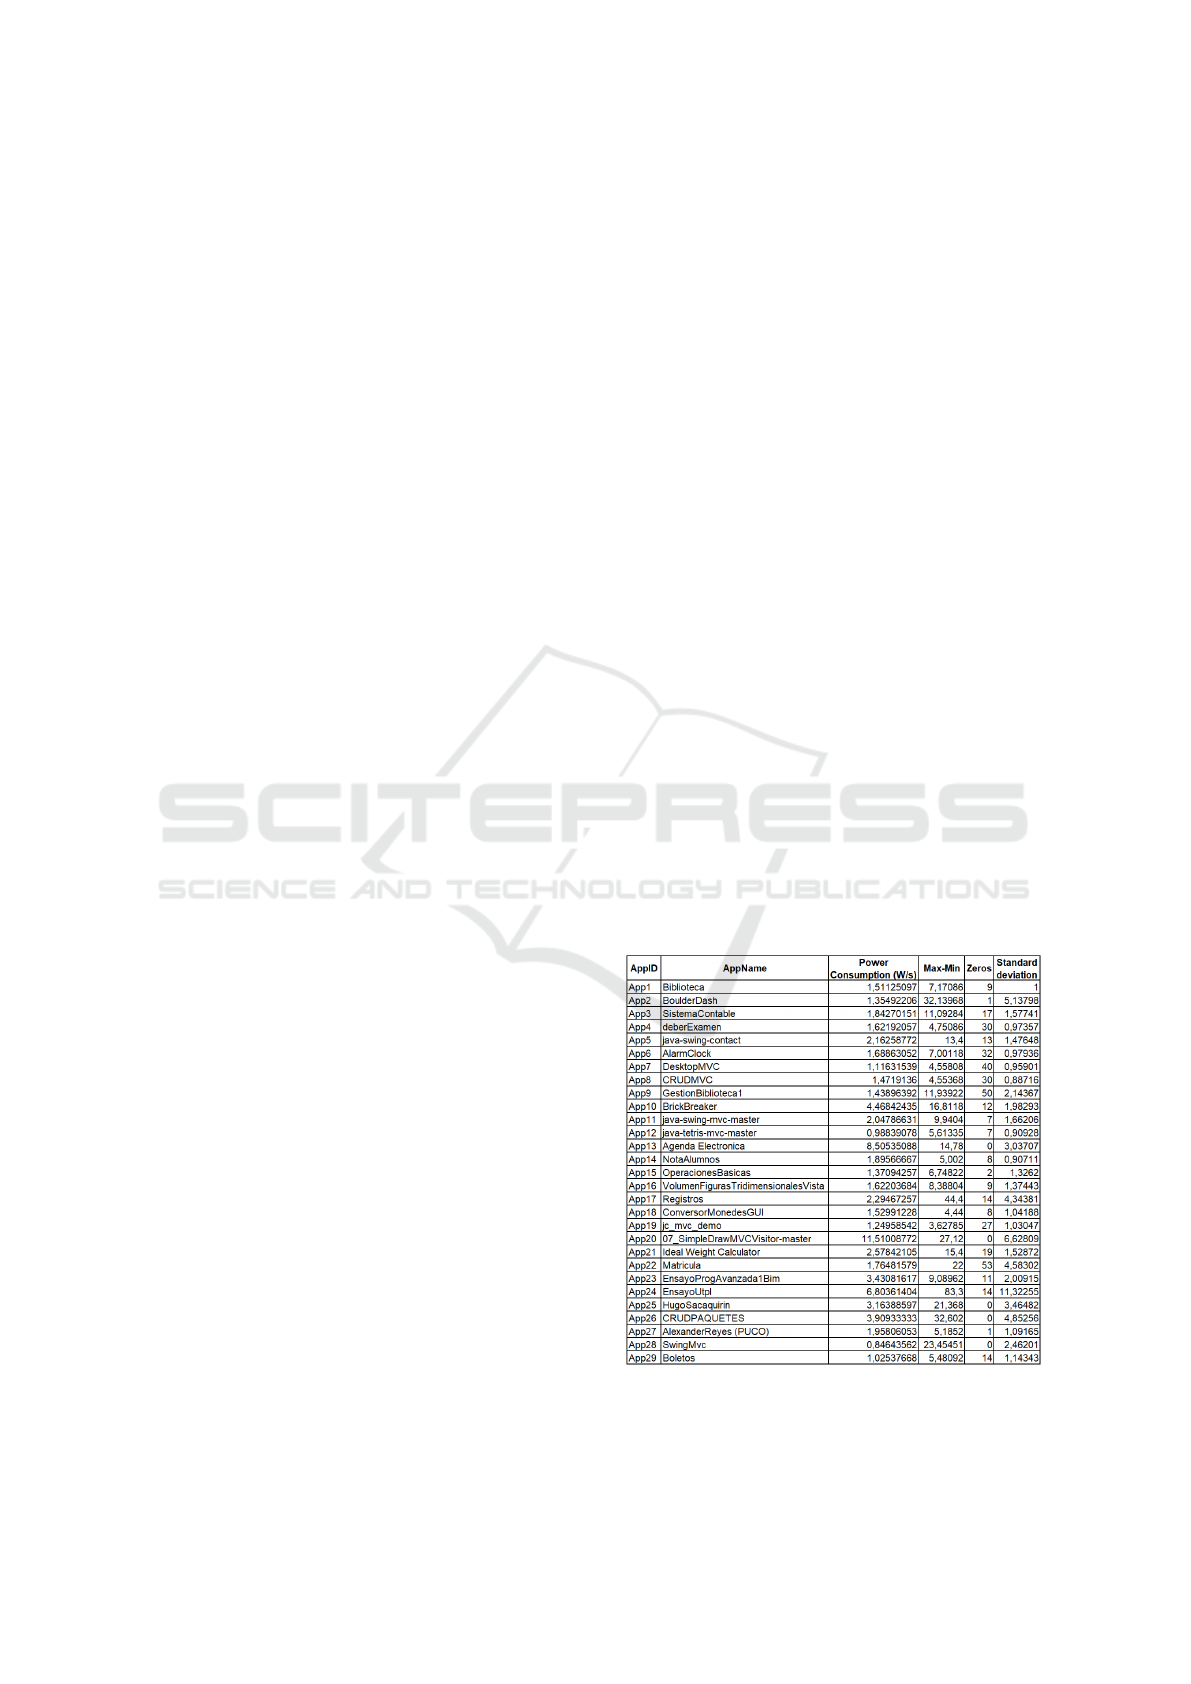
ecution. The average energy consumption in W/s is
detailed in Table 1.
Table 1: Java MVC applications monitored with PowerAPI
energy consumption metrics.
Results and Analysis of Experiments: The 29 ap-
plications were effectively measured during the 2
ICSOFT 2025 - 20th International Conference on Software Technologies
330
minutes of execution using PowerAPIDocker-Cloud
to search for power consumption behavioral patterns
that could help software engineers better understand
the power consumption behavior of software MVC
applications. From this analysis, the first finding that
we identified is that the power consumption measure-
ments of the 29 applications reveal high energy con-
sumption peaks when the application is started. This
shows that the launch of NetBeans 8.2 within the con-
tainer increases the energy consumption of the con-
tainer. In addition to the power consumption average,
Table 1 presents the standard deviation of each appli-
cation.
A high standard deviation indicates greater vari-
ability in the data, which could suggest that there are
consumption peaks or significant fluctuations in the
application; whereas, a low standard deviation indi-
cates less variability and, therefore, a more balanced
and regular consumption. Based on the standard de-
viation results, we have classified the applications
into 3 groups of applications: (a) Balanced Group
(x<1.5): those applications that have a standard devi-
ation below 1.5 W/s. (b) Moderate Variable Group
(1.5<x<3.5): those applications that have a stan-
dard deviation between 1.5 W/s and 3.5W/s. (c)
High Variable Group (x>3.5): those applications
that show a standard deviation above 3.5 W/s.
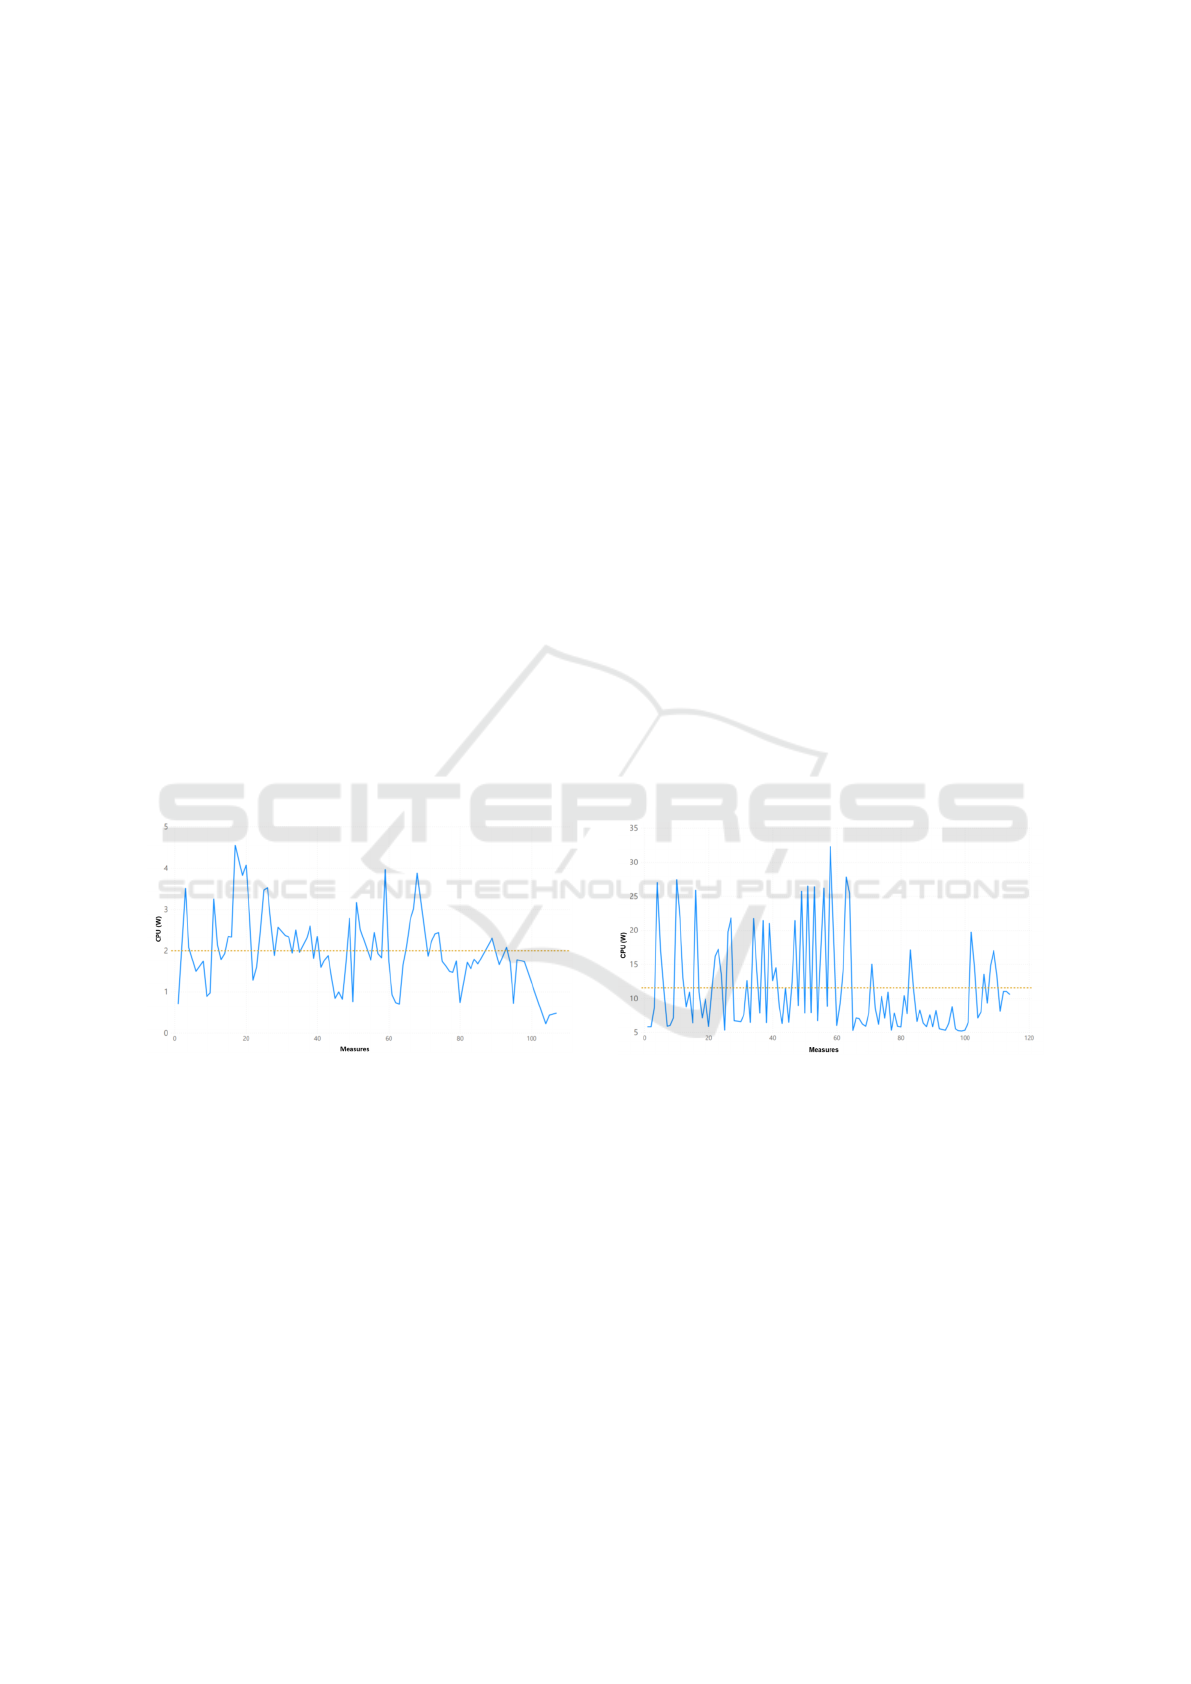
Figure 2: Example Group A: Balanced App8.
As a result, 14 of the 29 applications analyzed be-
long to Group a: Balanced, since the measurement
values are close to the average and their consump-
tion patterns show that they consumption behaviors
are relatively stable. Figure 1 shows the energy con-
sumption data of the App8 CRUDMVC, where at first
glance it seems like an application with various fluctu-
ations. However, the results vary between 0.5 W/s and
4.5 W/s, and most of these measurements are close
to the total average of the application (2 W/s), so it
follows a stable and balanced consumption flow (see
Figure 2).
On the other hand, 9 applications are categorized
within Group b: Moderate Variable, since the en-
ergy consumption values of each application range
between 1.5 W/s and 3.5 W/s, around the average of
each application. Finally, it has been determined that
6 applications are characterized in Group c: Variable
high due to the very disparate records in their execu-
tion exhibiting a typical deviation above 3.5 W/s in
their energy consumption. This is shown in Figure
3, which shows fluctuations throughout the monitor-
ing, varying up to 27 W/s from maximum to mini-
mum consumption. In this Group c, there is also ev-
idence of high consumption in the applications, since
the average of 7.13 W/s exceeds the average of all the
groups by more than 3.69 W/s of the total set. There-
fore, applications, that comply with a High Variabil-
ity flow, present an energy consumption significantly
higher than the average energy consumption of the
applications of the rest of the patterns and the aver-
age of the total set.
This is mainly because two of the most power-
consuming applications belong to this group, App20
- 11.51008772 W/s and App2 - 13.66912519 W/s.
Furthermore, the fourth application that consumes
the most energy is also found in this group App24 -
7.75612 W/s, with App22 and App17 being the only
ones in this subset with energy consumption values
below the total consumption average, although they
are ranked eighth and eleventh in the order of those
that consume the most.
Figure 3: Example Group C: High Variability App20.
The quality of the source code of software appli-
cations is a factor that directly influences energy con-
sumption (Guam
´
an et al., 2023). Therefore, metrics
such as Source Lines of Code (SLOC), Cyclomatic
Complexity, Duplicated Lines and Code Smells have
been extracted from each of the applications classi-
fied in the 3 groups using SonarQube as a static anal-
ysis tool. The objective of analyzing the metrics ex-
tracted with SonarQube is to determine whether these
3 groups could be aligned with more than just energy
consumption and code quality. As a result, applica-
tions in Group a have a high variability in the qual-
ity of their code. Applications belonging to groups a
and c show optimal quality parameters, while those in
Group b present inefficient quality values.
Containerizing the PowerAPI Architecture to Estimate Energy Consumption of Software Applications
331
Finally, from the analysis of the 3 groups from the
point of view of energy consumption, it is possible to
conclude that Group a contains the applications that
consume the lowest energy, while Group c character-
izes those applications that consume the most, which
shows that applications with a balanced consumption
pattern are generally those that consume the lowest
energy, while those that show high variability fluctu-
ations belong to the set of applications that consume
the most.
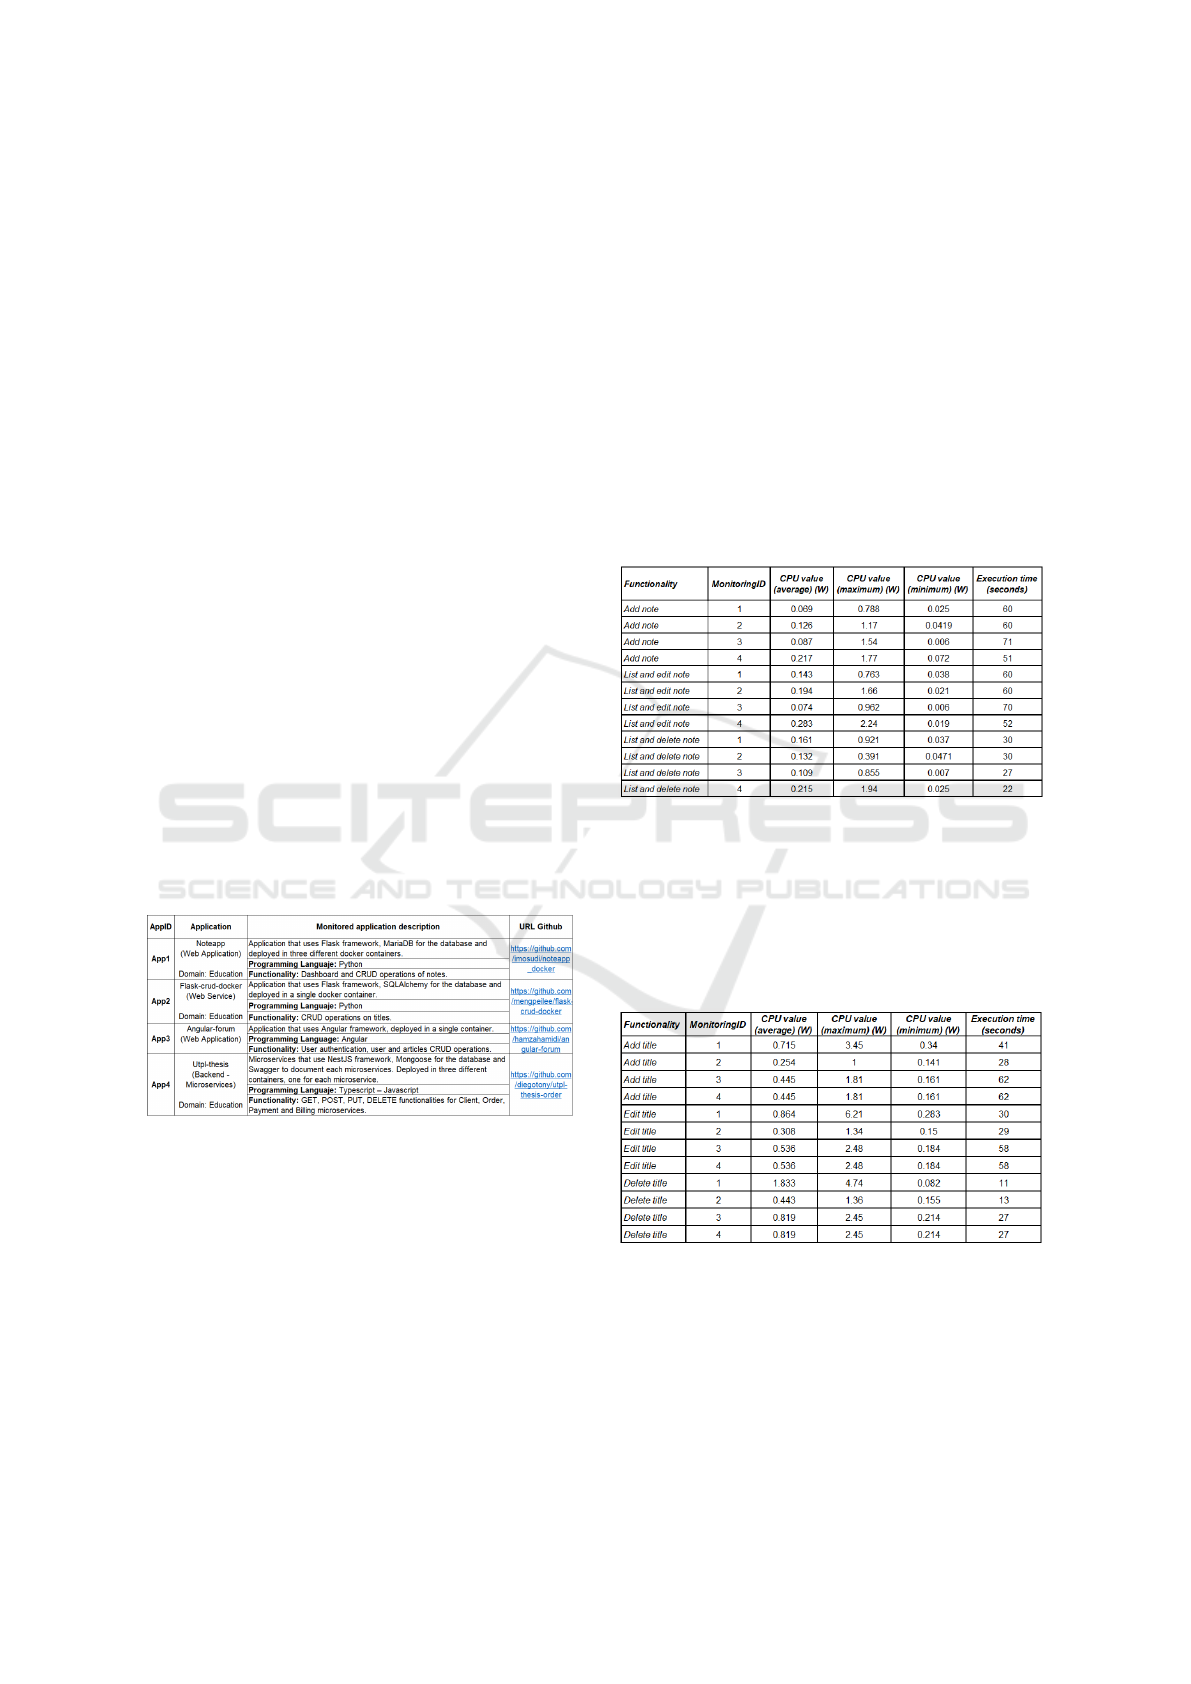
4.2 Measurements in Context 2
The applications to be monitored are obtained from
the GitHub repository. In this case, applications that
are already “dockerized” have been selected, that is,
those that contain the file called Dockerfile to deploy
their container. To run an application from a reposi-
tory on GitHub, it is necessary to clone the repository
into your local machine and navigate to the root of the
project using the terminal. It should be used Docker
and Docker Compose to create and run the containers.
Measurement: To extract the metrics and energy
consumption values of the 4 applications within this
context, 4 experiments are performed for each appli-
cation where different functionalities are executed or
the application is stressed for each container that con-
tains the application. In all cases, the functionalities
used are CRUD operations.
Table 2: Experimental scenarios.
The objective of carrying out the 4 experiments
for each application is: (i) to evaluate the quality of
the power estimates by running manual load tests for
all containers, including the deployment and each ap-
plication and the number of containers within it, and
(ii) to analyze the accuracy and stability of the Power-
API power model by running the different workloads
or stresses of the application monitored in our experi-
ments (see Table 2). To monitor and extract data from
each experiment, each application is evaluated using
the functionality operation, keeping the same times
and workloads. The measurement values are calcu-
lated as averages of different execution times for our
containers to be monitored with the metrics of each
container configured in our formula. In this case, it
is used the CPU consumption, since the estimation
of the DRAM component (RAM memory) is not yet
enabled for use. The results of the measurements ob-
tained in the experiments are presented as follows.
First Experiment: The energy consumption of the
”NoteApp application” that was run at various time
intervals In this experiment, the functionalities con-
tained in the application are executed: add, list, edit
and delete notes, the CPU power value measured in
Watts/second has been extracted on average, maxi-
mum, minimum and the time interval of the function-
ality’s execution.
Table 3: NoteApp Container Monitoring.
Second Experiment: The results obtained by mon-
itoring the ”FlaskApp” are presented in the table,
where the energy consumption is shown at differ-
ent time intervals in which the application is running
and the average, maximum and minimum energy con-
sumption values were saved.
Table 4: FlaskApp Container Monitoring.
Third Experiment: The results obtained from moni-
toring the ”Angular-forum” application are presented
in Table 5. During each time interval, several itera-
tions are performed for the various pages of the appli-
cation’s Frontend. For each functionality, the average,
maximum and minimum values of energy consump-
tion are extracted during the period in which the ap-
plication was used.
ICSOFT 2025 - 20th International Conference on Software Technologies
332
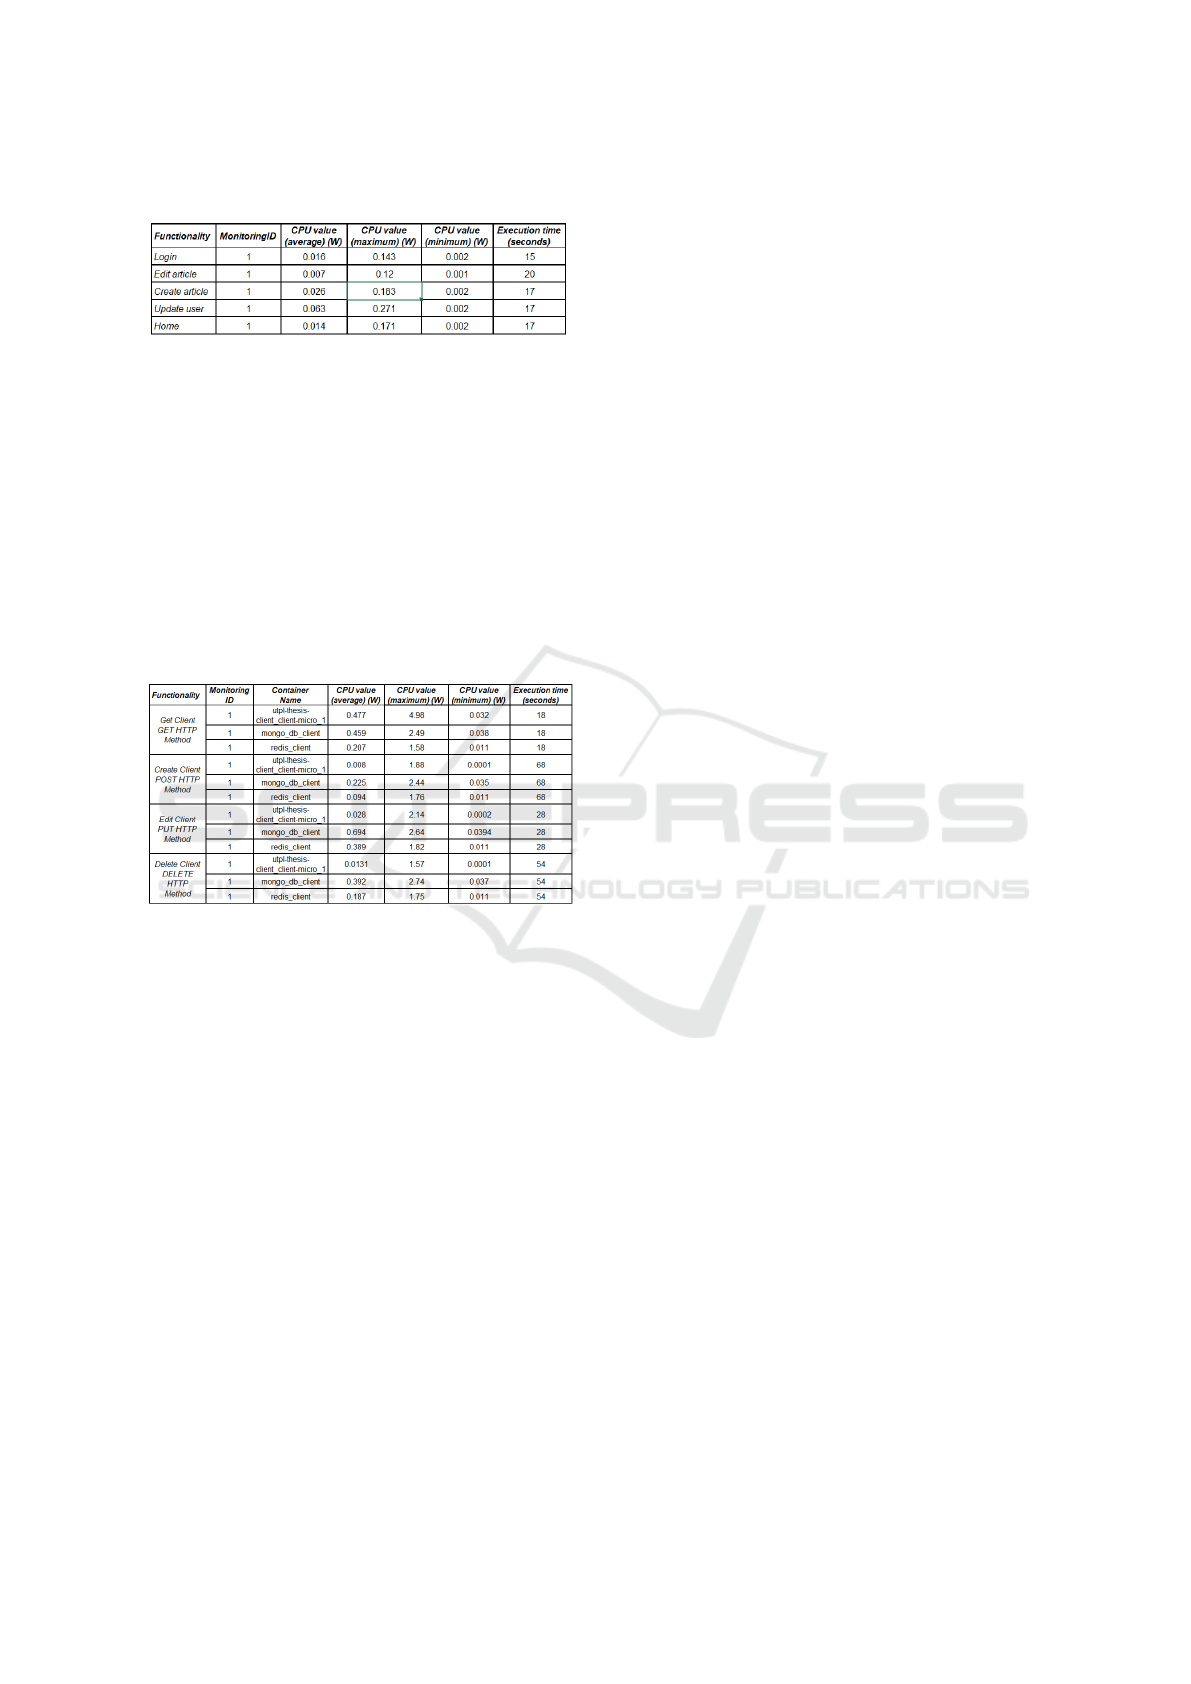
Table 5: Angular-forum Container Monitoring.
Fourth Experiment: The “Utpl-Thesis” application
has a particularity with regard to the other 3 applica-
tions executed in this Context 2, since it is built under
the microservices architecture running each microser-
vice (Client, Order, Payment and Billing service) in a
container independent of the rest of the application.
The results of monitoring are presented in Table 6.
Each time interval corresponds to a different func-
tionality within the application, considering each mi-
croservice that contributes to the overall structure of
the application. This is valid regardless of the number
of containers that make up each microservice.
Table 6: Client Microservice monitoring in Containers.
Results and Analysis of Experiments: Based on the
experiments for each scenario, the implementation of
PowerAPIDocker-Cloud, the use of the HWPC sen-
sor and the SmartWatts formula are validated. The
experiments show the behavior of the applications and
how the energy consumption of each container affects
different scenarios. It is also shown that PowerAPI
adapts to evaluate different types of applications and
how it responds to variations in workload. The energy
consumption analysis of the experiments shows sig-
nificant variations in CPU usage and execution times
for different applications and their specific function-
alities. In the NoteApp Container, CRUD operations
generate various power consumption values (see Ta-
ble 3). The add note operation generates average CPU
consumption values ranging from 0.069 W/s to 0.217
W/s, with maximum peaks reaching up to 2.24 W/s.
The execution time for these operations varies be-
tween 22 and 71 seconds, which shows notable dif-
ferences in energy efficiency and processing time re-
quired for each operation. The FlaskApp exhibits high
energy consumption values compared to the other ap-
plications analyzed. The operations for adding, edit-
ing and deleting titles have average CPU consumption
values ranging from 0.254 W/s to 1.833 W/s, with
maximum peaks reaching up to 6.21 W/s. Despite
the high energy consumption, execution times are rel-
atively short, ranging from 11 to 62 seconds. This
high consumption can be attributed to the application
deployment and processing load during CRUD oper-
ations, suggesting a higher resource intensity. The
client service of the Utpl-Thesis application, the en-
ergy consumption values vary considerably (see Ta-
ble 6). In client service, average CPU values range
from 0.008 W/s to 1.601 W/s, with maximum peaks
reaching up to 4.98 W/s. This data indicates that
the microservices architecture of Utpl-Thesis involves
considerable energy consumption, reflecting the com-
plexity and interaction between the different compo-
nents of the system. It can be concluded that the ap-
plications under measurement that have an implemen-
tation of CRUD operations and the implementation
of services have a significant impact on CPU usage
and execution times. In contrast, more complex and
processing-intensive applications such as FlaskApp
and Utpl-Thesis show higher power consumption and
varied execution times. These findings highlight the
importance of optimizing application design and im-
plementation to improve energy efficiency and reduce
environmental impact.
5 DISCUSSION
Based on the results presented in Section 4, it is pos-
sible to answer the research questions.
RQ1: Is it possible to measure the energy consump-
tion of software applications programmed with dif-
ferent software architectures and programming lan-
guages using a containerized PowerAPI environment?
Based on the collected data using PowerAPIDocker-
Cloud from the measurements of the 2 contexts of
the experiment, it can be stated that it is possible to
measure the energy consumption of applications that
are built with different software architectures and de-
ployed in Docker containers. However, the efficiency
and accuracy of these measurements can vary depend-
ing on several factors related to: the software architec-
ture of application, the quality and use of good pro-
gramming practices, the implementation of the con-
tainers, and the configuration of the measurement en-
vironment. PowerAPIDocker-Cloud is a suitable tool
for measuring the energy consumption of applications
regardless of the architecture used, since it obtains
metrics and data that allow comparing the energy
impact generated by the application and monitoring
Containerizing the PowerAPI Architecture to Estimate Energy Consumption of Software Applications
333

them to identify areas of optimization and improve-
ment in the design and construction of software and
the resource management. Another advantage of us-
ing PowerAPIDocker-Cloud is that it can be config-
ured to monitor various applications and services de-
ployed in Docker containers, allowing its use in het-
erogeneous and dynamic environments. Based on the
results obtained, PowerAPIDocker-Cloud is a config-
urable and parametrizable environment that can be re-
produced by organizations or engineers who use mul-
tiple technologies and diverse architectures for their
applications, although it is important to keep in mind
that application measurements will depend on the
workload generated by each functionality, the system
configuration and other external factors such as code
quality, programming languages and technologies.
RQ2: Does the execution time of a functionality in-
fluence in the energy consumption or CPU values
measured by PowerAPIDocker-Cloud? Based on the
data obtained with PowerAPIDocker-Cloud, it is ev-
idenced that the execution times of the functional-
ities of the applications significantly influences in
the energy consumption and CPU value. The ex-
ecution time of a functionality (i.e. Create, Read,
Update or Delate in the case of CRUD systems un-
der analysis) in a software application is directly re-
lated to the energy consumption and CPU usage val-
ues measured by PowerAPIDocker-Cloud. For ex-
ample, in the NoteApp WEB application, operations
with longer execution times, such as adding notes, can
take up to 71 seconds. These operations tend to have
higher average and maximum CPU values compared
to faster operations such as listing and deleting notes,
which take between 22 and 30 seconds. This example
shows that power consumption is an important per-
formance measure like processing time, and although
power consumption and execution time do not always
have a linear relationship, generally, a longer execu-
tion time implies a higher power consumption due
to the prolonged activity of the processor and other
system components. In addition, from the results, it
has been observed that running the add a note func-
tionality can consume an average CPU value of up
to 0.217 W/s, while deleting a note has an average
consumption of 0.215 W/s. The monitoring results of
FlaskApp show a pattern of execution times of less
than 10 seconds when the operation involves deleting
data. They have lower average and maximum CPU
values compared to adding or editing titles, which can
take up to 62 seconds. For example, removing a title
has an average CPU value of 0.443 W/s, while adding
a title can reach 0.715 W/s. This suggests that longer
and possibly more complex operations consume more
power than those that take less time. As a result, it is
possible to conclude that when applications include
operations or methods that require more execution
time, they commonly consume more energy due to the
longer duration of computational resource usage. The
complexity and duration of the operation also have
a direct impact on energy consumption. Applications
and services with efficient implementations optimized
for fast operations tend to have lower power consump-
tion, highlighting the importance of optimizing both
code and infrastructure to improve energy efficiency.
RQ3: Does the type of CRUD (Create-Read-Update-
Delete) operation of an application influence the en-
ergy consumption? What kind of operation (Create-
Read-Update-Delete) has the highest energy con-
sumption? In addition, it has been individually ana-
lyzed the different kind of CRUD operations, i.e. cre-
ate, read, update, and delete, to determine to what
extent they affect power consumption in a different
way. From the results obtained, it is possible to deter-
mine that the data entry and editing operations, i.e.,
create and update, tend to have higher power con-
sumption than the list and delete operations due to
factors such as database operations, inclusion of busi-
ness rules, memory usage, and transactions. When
performing database operations, there is a higher in-
put/output load, since when data are inserted or up-
dated, the system must write to disk or the database,
which is more energy-intensive than just reading in-
formation. In the case of web applications and mi-
croservices, before adding or modifying a record, val-
idations (format, uniqueness, referential integrity) are
performed, which requires additional processing in
CPU and memory. Similarly, in the case of appli-
cations that use microservices, data must be trans-
formed from a JSON to a data structure in our exam-
ple, which implies an extra computational expense.In
addition, both web applications and microservices re-
quire transactions to ensure consistency, which im-
plies temporary storage and extra processing in the
database engine. Furthermore, in the case of appli-
cations with microservice architecture, microservices
also require coordination processes that also increase
the energy consumption. Therefore, it is possible to
conclude that the kind of operation and the architec-
ture of the application have a high influence in the
power consumption.
6 CONCLUSIONS
This paper presents the containerization of PowerAPI
in an environment called PowerAPIDocker-Cloud,
which makes it possible to measure and evaluate the
energy consumption generated by software applica-
ICSOFT 2025 - 20th International Conference on Software Technologies
334

tions. Key concepts, features and functionalities of
PowerAPIDocker-Cloud related to the measurement
and estimation of energy consumption of software
applications in real time were identified, since the
HWPC sensor and the Smartwatts formula are config-
ured as part of its architecture, in addition to the Mon-
goDB, influxDB and Grafana services. To validate the
architecture proposed by PowerAPIDocker-Cloud, 33
experiments were designed for two different contexts
to demonstrate that it is able to measure effectively
different MVC applications programmed in different
languages and deployed in a different way: deskop,
web, web service and microservices. In addition, this
paper analyzes in detail the power consumption pat-
terns of the application under measurement, provid-
ing relevant findings to software engineers about the
IDEs’ consumption, the kind of CRUD operation and
the execution times that can be applied during soft-
ware development.
The features and functionalities identified in Pow-
erAPI are numerous; however, they are not yet fully
developed in relation to the measurement and estima-
tion of energy consumption in real time. This will al-
low future research to achieve a deeper understanding
of the capabilities of PowerAPI and take advantage
of its potential to optimize the energy consumption
of microservices. To replicate the PowerAPIDocker-
Cloud setup for estimating microservices power con-
sumption, it is suggested to carefully study the in-
formation related to the middleware, which provides
a solid foundation for understanding the importance
and implications of using PowerAPI, which can help
make informed decisions about its implementation
and utilization.
ACKNOWLEDGEMENTS
This work is partially supported by Universi-
dad T
´
ecnica Particular de Loja (Computer Sci-
ence Department) and the Spanish Ministry of Sci-
ence and Innovation (MICINN) through “SIoTCom:
Sustainability-Aware IoT Systems Driven by Social
Communities” (PID2020-118969RB-I00).
REFERENCES
Agarwal, S., Nath, A., and Chowdhury, D. (2012). Sustain-
able approaches and good practices in green software
engineering. International Journal of Research and
Reviews in Computer Science, 3(1):1425.
Bozzelli, P., Gu, Q., and Lago, P. (2013). A systematic
literature review on green software metrics. VU Uni-
versity, Amsterdam.
David, H., Gorbatov, E., Hanebutte, U. R., Khanna, R., and
Le, C. (2010). Rapl: Memory power estimation and
capping. In Proceedings of the 16th ACM/IEEE in-
ternational symposium on Low power electronics and
design, pages 189–194.
Fieni, G., Acero, D. R., Rust, P., and Rouvoy, R. (2024).
Powerapi: A python framework for building software-
defined power meters. Journal of Open Source Soft-
ware, 9(98):6670.
Grant, R. E., Levenhagen, M., Olivier, S. L., DeBonis,
D., Pedretti, K., and Laros, J. H. (2016). Over-
coming challenges in scalable power monitoring with
the power api. In 2016 IEEE International Paral-
lel and Distributed Processing Symposium Workshops
(IPDPSW), pages 1094–1097. IEEE.
Guam
´
an, D., P
´
erez, J., D
´
ıaz, P. V., and Canas, N. (2022).
Estimating the energy consumption of software com-
ponents from size, complexity and code smells met-
rics. In Hong, J., Bures, M., Park, J. W., and Cern
´
y,
T., editors, SAC ’22: The 37th ACM/SIGAPP Sympo-
sium on Applied Computing, Virtual Event, April 25 -
29, 2022, pages 1456–1459. ACM.
Guam
´
an, D., P
´
erez, J., and Valdiviezo-Diaz, P. (2023).
Estimating the energy consumption of model-view-
controller applications. The Journal of Supercomput-
ing, 79(12):13766–13793.
Kocak, S. A. (2013). Green software development and de-
sign for environmental sustainability. In 11th Inter-
national Doctoral Symposium an Empirical Software
Engineering (IDOESE 2013). Baltimore, Maryland,
volume 9.
Liu, K., Pinto, G., and Liu, Y. D. (2015). Data-oriented
characterization of application-level energy optimiza-
tion. In Fundamental Approaches to Software Engi-
neering: 18th International Conference, FASE 2015,
Held as Part of the European Joint Conferences on
Theory and Practice of Software, ETAPS 2015, Lon-
don, UK, April 11-18, 2015, Proceedings 18, pages
316–331. Springer.
Mancebo, J., Garcia, F., and Calero, C. (2021). A process
for analysing the energy efficiency of software. Infor-
mation and Software Technology, 134:106560.
Pazowski, P. et al. (2015). Green computing: latest practices
and technologies for ict sustainability. In managing
intellectual capital and innovation for sustainable and
inclusive society, joint international conference, Bari,
Italy, pages 1853–1860.
Pedregosa, F., Varoquaux, G., Gramfort, A., Michel, V.,
Thirion, B., Grisel, O., Blondel, M., Prettenhofer, P.,
Weiss, R., Dubourg, V., et al. (2011). Scikit-learn:
Machine learning in python. the Journal of machine
Learning research, 12:2825–2830.
Rad, B. B., Bhatti, H. J., and Ahmadi, M. (2017). An in-
troduction to docker and analysis of its performance.
International Journal of Computer Science and Net-
work Security (IJCSNS), 17(3):228.
Torvekar, N. and Pravin, S. G. (2019). Microservices and
it’s applications: An overview. International Jour-
nal of Computer Sciences and Engineering, 7(4):803–
809.
Containerizing the PowerAPI Architecture to Estimate Energy Consumption of Software Applications
335
