
Validating the Optimization of a Building Occupancy Monitoring
Software System
Jalil Boudjadar and Simon Thrane Hansen
Department of Electrical and Computer Engineering, Aarhus University, Denmark
Keywords:
Buildings Occupancy Analysis, State Estimation, Monitoring Software, Formal Verification.
Abstract:
Real-time occupancy information is key to track and optimize the resource usage in buildings. With the ulti-
mate goal to reduce energy consumption and improve indoor environment quality, different occupancy mon-
itoring solutions have been introduced in the literature. However, these solutions can be part of the original
problem due to its high energy consumption. This paper proposes the design and validation of a knowledge-
driven energy-efficient system to monitor and analyze buildings occupancy. Such a system is in fact an op-
timization of the actual software solution (Office Master 3000) used to monitor buildings occupancy in an
academic institution. The key contributions are: 1) Optimization of the actual solution: using the knowledge
about the activity expected to take place, our system proactively identifies the minimal sensors data relevant
to the actual state to confirm/deny such an activity by which non-substantial sensors are operated with loos-
ened frequency; 2) Formal validation: using UPPAAL model checker we prove that the original functional
and non-functional properties are maintained post-optimization. The proposed system is implemented in C++,
tested and validated. The results demonstrate that our optimization reduces sensors energy consumption by up
to 31% while maintaining high accuracy (84%) in identifying the occupancy states and activities.
1 INTRODUCTION
With the ever increasing buildings energy demand and
cost, it is paramount to monitor and optimize the en-
ergy consumption of the different loads and comput-
ing components embedded in buildings (Lasla et al.,
2019; Boudjadar et al., 2014). To conduct such an op-
timization, a highly reliable tracking of the actual oc-
cupancy state of building spaces is needed. The build-
ing state refers to the activities, events and potentially
the number of people occupying a building space at
a given time point. Building occupancy monitoring
systems (BOMS) enable to track the state of build-
ing spaces in real-time (Azimi and O’Brien, 2022;
Elkhoukhi et al., 2018; Shokrollahi et al., 2024; Baer-
entzen et al., 2023; Tien et al., 2022). The knowledge
generated by BOMS provides a solid and informative
ground for buildings management to identify when
and where resource utilization can be reduced, so that
to achieve a better space allocation and efficient re-
sources usage (Salimi and Hammad, 2019; Jabirullah
et al., 2021).
Commonly, state of the art BOMS rely on Big
Data analysis where massive quantities of sensor data
(video, audio, step panels, etc.) need to be collected
and run through classification, prediction and opti-
mization engines (Zhang et al., 2019) (Jiang and Yin,
2015). It is expensive to maintain the real-time aspect
of such a brute-force approach to occupancy analysis
(Elkhoukhi et al., 2018), due to massive data process-
ing, and can result in relatively low accuracy, particu-
larly if the input data blinds out the data related to the
cases with a strong potential to optimization (Salimi
and Hammad, 2020; Pan et al., 2014). Moreover, it
can end up with high energy consumption due to the
cost of collecting and processing massive data (Coste-
naro and Duer, 2012).
Different attempts to optimize the energy con-
sumption of BOMS and improve its decision mak-
ing have been proposed in the literature (Lou et al.,
2017; Rai et al., 2015; McKenna et al., 2015; Dai
et al., 2020; Ahmad et al., 2021; Zhang et al., 2022;
Jiang et al., 2022). However, different challenges
have emerged: 1) it is not trivial to design high fi-
delity models to enable systematic state computation
(Austin et al., 2020); 2) an automated semantics-
driven occupancy analysis delivering high confidence
decisions in real-time is expensive computation-wise;
3) optimizing the performance and energy efficiency
of a BOMS can lead to violate safety properties and
degrade reliability metrics given that such metrics
can be conflicting with the performance (Teng et al.,
2021).
This paper proposes the optimization of a state of
Boudjadar, J., Hansen and S. T.
Validating the Optimization of a Building Occupancy Monitoring Software System.
DOI: 10.5220/0013559400003964
In Proceedings of the 20th International Conference on Software Technologies (ICSOFT 2025), pages 155-166
ISBN: 978-989-758-757-3; ISSN: 2184-2833
Copyright © 2025 by Paper published under CC license (CC BY-NC-ND 4.0)
155

the art BOMS, Office Master 3000, to reduce the data
samples required and the underlying energy consump-
tion, for both data gathering and processing, while
maintaining high accuracy for the occupancy state es-
timation. The resulting optimized BOMS relies on
an intelligent knowledge-driven occupancy estima-
tion so that it proactively identifies which high-level
symbolic facts are needed to change the current state
into an actual event. These facts are run through a se-
mantically well-defined occupancy model to identify
which minimal combination of non-intrusive sensors
can supply data to confirm or contradict these facts,
rather than blindly collect massive data from all sen-
sors post-hoc to recognize ongoing activities. This en-
ables to reduce the sensors frequency, and potentially
switching sensors off for considerable time durations.
To validate the proposed optimization, we have
modeled the optimized BOM in UPPAAL and used
model checking to verify that the original non-
functional properties (correctness, response time, per-
formance and energy consumption) of the Office Mas-
ter BOMS are still maintained post-optimization. Fur-
thermore, the optimized BOMS is implemented in
C++ where we analyzed the underlying performance
and energy, and compare it to the original Office Mas-
ter BOMS and to other state of the art BOMS algo-
rithms.
The rest of the paper is structured as follows: Sec-
tion 2 presents a background about BOMS and UP-
PAAL. Section 3 cites relevant related work. Sec-
tion 4 presents the mathematical modeling and opti-
mization of the proposed BOMS. Section 5 describes
the specification and verification using UPPAAL. Im-
plementation analysis and validation results are dis-
cussed in Section 6. Finally, Section 7 concludes the
paper.
2 BACKGROUND
This section presents the background related to occu-
pancy analysis, optimization and UPPAAL environ-
ment for formal verification and validation.
2.1 Occupancy State Estimation
Occupancy monitoring amounts to observe a specific
area within a building to detect human presence and
recognize occupancy activities (Ahmad et al., 2021).
This typically entails gathering data from sensors that
capture various features associated with human pres-
ence, such as breathing, movement and noise. The
facts obtained from the sensors are then combined
through an inference process to estimate the occu-
pancy state (Yang et al., 2016).
For building management systems (BOMS) to ef-
fectively utilize this knowledge, real-time data is es-
sential. This allows for timely actions to be taken
based on the current occupancy state, thereby mini-
mizing resource wastage and enhancing indoor com-
fort (Seghezzi et al., 2021; Sun et al., 2020).
With recent advancements enabling the deploy-
ment of BOMS on embedded devices using battery-
powered sensors, optimizing the computational costs
and energy consumption has become crucial. While
reducing data sampling can serve as a means of op-
timization, it may compromise the accuracy of oc-
cupancy estimation (Yang et al., 2016). Hence, it
is imperative to conduct post-optimization validation
to ensure BOMS systems consistency and reliability
(Boudjadar and Tomko, 2022).
2.2 BOMS Optimization
A BOMS optimization is the process of enhancing
different performance metrics such as response time,
resource utilization, and energy consumption (Mi-
noli et al., 2017). The optimization can be achieved
through a variety of techniques, including heuris-
tics, mathematical solvers, and machine learning al-
gorithms. However, it is crucial to ensure that improv-
ing one performance metric does not significantly de-
grade others or violate functional and non-functional
properties (Boudjadar and Khooban, 2020; Boudjadar
and Tomko, 2022). In the context of buildings, the
need for optimization arises from their multifunc-
tional nature, where individual spaces may serve dif-
ferent purposes. Therefore, tailoring a building space
to its current activity is essential. For BOMS, op-
timization aims to reduce energy consumption and
computational costs associated with data gathering
and processing. The key objective of our optimiza-
tion is to achieve real-time knowledge of the occu-
pancy state, enabling dynamic adjustment of sensor
frequencies based on the required data to confirm or
deny an activity (Rault et al., 2014).
2.3 UPPAAL Model Checking
Model checking (E. M. Clarke et al., 1999; Baier
and Katoen, 2008) is a widely used automated ver-
ification technique for examining complex reactive
systems, including hardware components, embed-
ded controllers, and network protocols. The method
works by expressing the specifications of a system
behavior in a semantically well-defined language and
formalize the properties to look for in logical formu-
ICSOFT 2025 - 20th International Conference on Software Technologies
156

las such as LTL or CTL (Baier and Katoen, 2008),
and then check whether the system behavior satisfies
the expected qualities. We use UPPAAL (Boudjadar
et al., 2013) for the post-optimization validation due
to its expressiveness and ability to verify real-time
systems.
UPPAAL is based on Timed Automata the-
ory (Alur and Dill, 1994). As such, each UPPAAL
template (timed automaton) is characterized by the
following:
• A finite set of locations, with one designated as
the initial location;
• A finite set of transitions connecting locations;
• A finite set of variables;
• A finite set of actions performed on the variables
when executing a transition;
• A finite set of predicates, called guards allowing
the execution of a transition:
• A finite set of synchronization channels.
A sequence of transitions represents the evolution of
the specification. Each transition may be labeled with
one or more actions, a guard and a synchronization.
The state of a specification is given by the current lo-
cation and the actual valuation of the variables. A
specification in UPPAAL relies on combining multi-
ple templates (network of timed automata) to create
complex and modular systems. The composition can
be synchronous where two transitions, one from each
timed automaton, labeled with the same synchroniza-
tion channel can be executed simultaneously.
3 RELATED WORK
Buildings occupancy monitoring has been thoroughly
explored in the recent years where different monitor-
ing models, analysis processes and optimizations are
proposed (Lou et al., 2017; Rai et al., 2015; McKenna
et al., 2015; Dai et al., 2020; Ahmad et al., 2021;
Zhang et al., 2022; Jiang et al., 2022). The ultimate
goal is to deliver highly accurate occupancy state esti-
mation while optimizing the resources to deploy in or-
der to achieve that mission such as energy consump-
tion, accuracy and response time (Lasla et al., 2019;
Trivedi and Badarla, 2020).
Lasla et al (Lasla et al., 2019) proposed an energy-
efficient monitoring system for buildings using in-
frared sensors. The energy optimization comes from
the optimal placing of sensors identified through a
design exploration formulated as mixed integer lin-
ear problem. However, according to the authors, the
accuracy of these experiments is dependent on the
amount of data to be collected. The authors of (Nien-
aber et al., 2020) proposed the validation and tuning
of different occupancy detection algorithms for multi-
person offices where different abstraction models are
considered, and the underlying impact of the decision
accuracy is analyzed. Improvements of the algorithms
have been conducted to achieve a trade-off between
the granularity of the occupancy model, the assump-
tions to make and the decision accuracy. However,
relying only on the CO
2
emission sensors has been
proven to be less accurate as it depends on the physi-
cal state of the occupants. The authors of (Lou et al.,
2017; Rai et al., 2015) proposed an agent-based oc-
cupancy analysis, that amounts to track the individual
occupants rather than measuring the impact made by
occupants on their surroundings. Although this alter-
native can enable accurate occupancy of the individu-
als, it can suffer from the scalability and the compu-
tation cost.
A state-based occupancy model has been pro-
posed in (McKenna et al., 2015). It consists in creat-
ing stochastic data in terms of how probable an occu-
pancy state will occur. This process enables to infer
the location of occupants and their activities. How-
ever, the bottleneck can be related to the massive data
gathering which drains sensor batteries and computa-
tion resources. Similarly, the authors of (Jiang et al.,
2022) proposed a semantic (trust-based) model for oc-
cupancy analysis where the sensors triggering order
and data are fed to a sequence matching scheme to
estimate the occupancy state. The sequence matching
scheme relies on known human activity sequences,
which may lead to uncertainty when partial states or
unknown scenarios are encountered.
Machine learning-based occupancy monitoring
has also been explored. The authors of (Tien et al.,
2022) proposed an occupancy monitoring model us-
ing convolutional neural networks and cameras to
sample the building spaces. Although this approach
achieves high accuracy, it requires massive data and
may suffer from computation cost and privacy con-
cerns.
Alternatively, a knowledge-based occupancy anal-
ysis has been proposed in (Ahmad et al., 2021). It
consists in designing a domain-specific model encod-
ing the activities to be carried out in the building and
run the actual data through such a model to identify
the occupancy state. In (Cala et al., 2015), the au-
thors presented the evaluation and validation of an oc-
cupancy detection system based on the concentration
of CO
2
in the indoor air. The validation amounted
to check the similarity between the proposed BOMS
outputs and the actual occupancy state reported by the
occupants.
Validating the Optimization of a Building Occupancy Monitoring Software System
157

In this paper, we propose a knowledge-driven
proactive BOMS system to analyze the actual occu-
pancy state and identify the minimal data to collect in
order to infer the ongoing activity in real-time, as an
optimization of the actual Office Master 3000 BOMS.
We analyze the proposed BOMS post-optimization to
examine the performance improvement and confirm
that the original functional and non-functional prop-
erties are maintained.
4 OPTIMIZED OCCUPANCY
MONITORING
This section presents the proposed occupancy analy-
sis model and optimization.
4.1 Occupancy State Specification
The original BOMS we consider monitor building
spaces (classrooms, meeting rooms, etc) using CO
2
sensors, motion sensors, noise sensors and light sen-
sors. The sensors are installed in different room ends,
where each location contains a sensor from each cate-
gory. The non-intrusive sensors are quantitative: light
sensors in lux, CO
2
in parts per million (ppm), audio
in decibels (dB), and motion in four levels: none (0),
low (1), medium (2), and active (3).
Following the building functionality and sensors,
we define the following language grammar L allow-
ing to describe the different occupancy activities.
L ≜ E
1
|E
2
|...|E
n
E ≜ (F,c)|(F,c) ∧ E
F ≜ S|S ∧ F
S ≜ v ∈ [a,b]
c ≜ H|M|L
The language specifies each potential occupancy
event E through a set of features F, each of which
is recognizable through a subset of sensors S if the
value v of each sensor is within certain range [a,b].
The confidence level c states how much a feature is
able to identify an event and can have values high (H),
medium (M) or low (L). One can see that different
events can have different features, which in turn can
have different numbers of sensors associated.
We define a semantics function ||e|| : E → P (S )×
P (c) to infer for each event the sensors and confi-
dence levels from the event features, according to L .
E is the set of events, whereas S represents the set of
sensors and P () is the power set (set of all subsets).
Thanks to language L describing all potential events
and features in a structured manner, we will be able to
automate a thorough analysis of the occupancy state
in real-time. This in fact will be done by projecting
the sensor readings to identify the features present at
the given time point. The features in turn enable to
recognize the candidate events. An example of a fea-
ture is ”one or few people present in the front of class-
room”. This feature will be identified if the values of
sensor S
i
and S
j
are within these respective ranges:
v
S
i
∈ [410,700ppm] ∧ v
S
j
∈ [2,3]. Accordingly, we
specify the lecture event E
1
as follows:
E
1
≜
⟨
F
1
,H
⟩
∧
⟨
F
2
,H
⟩
∧
⟨
F
4
,M
⟩
∧
⟨
F
7
,M
⟩
∧
⟨
F
10
,L
⟩
∧
⟨
F
18
,L
⟩
The confidence level indicates how critical a sen-
sor can contribute in recognizing an event. Nomi-
nally, the sensors of features having low confidence
for a given event e can be discarded while e is being
confirmed through high confidence features. The cal-
culation and optimization of sensors frequency will
be defined in the next section.
We define a valuation function V[S
i
](t) to return
the value of a given sensor S
i
at time point t. A state
of the proposed BOMS s at time t is given by the
readings (V[S
i
](t)) from each of the sensors sampled
at time t.
s(t) = ⟨V [S
1
](t),V [S
2
](t), . . . ,V [S
n
](t)⟩
For the sake of notation, we use s to refer to the actual
state, i.e. having the latest sensor readings. V returns
the value of any sensor for any time point.
4.2 Knowledge-Driven Optimized
Occupancy Analysis
The proposed BOMS optimization amounts to infer
the sensors to use in order to recognize the expected
event ε.The expected event can initially be obtained
from the schedule of the monitored space. Alterna-
tively, it can be set through a brute force data sampling
by activating all sensors with the highest frequency,
then the event recognized will be set to be the ex-
pected one. The optimization algorithm changes the
expected event dynamically at runtime following the
features recognized through occupancy analysis, as
one can see in Algorithm 1. The sensors are planned
on-the-fly where a sliding of the frequencies is cal-
culated and applied following the expected event and
the actual occupancy state.
Sensing Plan. A sensing plan R specifies the sen-
sors and the frequency for each to sample oc-
cupancy data. Namely, R is given by R =
⟨(S
x
,r
x
),(S
y
,r
y
),(S
z
,r
z
),...⟩, where S
i
are sensors
ICSOFT 2025 - 20th International Conference on Software Technologies
158

and r
i
are frequencies. For the sake of notation, we
omit to specify time points as part of the sensing plans
given that the knowledge expected for the occupancy
state defines what sensors to operate and how often
rather than the actual values of sensors. We simply
write R to refer to the actual sensing plan.
Given that a sensor can be utilized to recognize
different features of a given event, such a sensor runs
the same (highest) frequency for the different features
of the event but with respective reading ranges for
each of the features.
Our occupancy analysis is carried out by combin-
ing the sensor readings and comparing the inferred
occupancy state to the features of the expected event,
or any other event of the language L, in case the ex-
pected event cannot be approved. This results in 3
different cases: 1) good matching; 2) no matching; 3)
partial matching.
Good Matching. This corresponds to the case when
the actual occupancy state (sensor readings) matches
a single event e. This results in updating ε to e, where
a sensing plan is computed as follows:
R = ⟨(S
1
,r
1
),..,(S
n
,r
n
) | ∀i ∃c
j
(S
i
,c
j
) ∈ ||e|| ∧
r
i
=
2 if c
j
= H
4 if c
j
= M
8 if c
j
= L
⟩
For the frequency calculation of each sensor, we
associate frequencies of 2, 4 and 8 minutes respec-
tively for sensors having high (H), medium (M) and
low (L) confidence levels respectively. Those fre-
quencies are analyzed empirically and proven to be
sufficient to capture the occupancy features using the
underlying confidence levels. Hence, an event be-
ing confirmed through few consecutive sampling it-
erations leads to an optimization of the sensing plan
where sensors with the lowest confidence are dis-
carded from the sensing plan as follows:
R = R/{(S
i
,r
i
) | (S
i
,r
i
) ∈ ||e||∧ r
i
= 8}
Discarding a sensor from the sensing plan
amounts to operating the sensor with the lowest fre-
quency or switching off the sensor if it has already
been operating at the lowest frequency for many con-
secutive iterations. Further elaboration on the opti-
mization of sensing plans is provided in Section 4.3.
No Matching. No-match situation emerges when
the outcomes from the actual sensing plan does not
match any event of the language L . To resolve such
a problem, the sensing plan is expanded to include all
sensors with high frequency (2 minutes) to be able to
get a starting point so that either a good matching or
a partial matching of an event occurs.
R = ⟨(S
1
,2),(S
2
,2),...,(S
n
,2)⟩
In fact, the occurrence of a no-match case can be
interpreted as a rejection or disapproval of the ex-
pected event ε.
Partial Matching. This case occurs when the actual
occupancy state partially matches one or more events.
To calibrate the sensing plan efficiently, we need to
distinguish how many events partially match the ac-
tual state.
In case of a partial matching of the actual state to
a single event e, we compute a new sensing plan as an
update of the actual sensing plan R where all the sen-
sors belonging to the features with high confidence in
event e are included. Such sensors will run with high-
est frequency since they are given high confidence H.
The new sensing plan is calculated as follows:
R = R ∪ {(S
i
,r
i
)|(S
i
,r
i
) ∈ ||e||∧ r
i
= 2}
In case this is insufficient to conclusively con-
firm the event that partially matches the actual state,
the sensing plan will undergo an upgrade by incor-
porating sensors associated with features that exhibit
medium confidence in event e. These sensors will
operate at a medium frequency of 4 minutes, corre-
sponding to their assigned medium confidence level
M.
R = R ∪ {(S
i
,r
i
)|(S
i
,r
i
) ∈ ||e||∧ r
i
= 4}
In case the partial matching persists, the sensing
plan will be expanded further to include all the sensor,
being Off, belonging to the features with low confi-
dence in event e. This will lead to either confirm the
actual event e (good matching case), or disapprove it
(no-match case). Accordingly, the update of the sens-
ing plan R is made as follows:
R = R ∪ {(S
i
,r
i
)|(S
i
,r
i
) ∈ ||e||∧ r
i
= 8}
When facing partial matches to multiple events, it
becomes crucial to pinpoint the ongoing event with-
out engaging all sensors. To accomplish this, we be-
gin by determining the semantic differences between
the candidate events. For instance, if two events e
k
and e
l
exhibit partial alignment with the current state,
we compute the set of distinguishing features between
them, denoted as D = ||e
k
|| − ||e
l
||. The sensing plan
is then updated as follows: R = R ∪ D. This enables
to decide which of the events is actually ongoing.
Validating the Optimization of a Building Occupancy Monitoring Software System
159

4.3 Sensing Plans Optimization
Our BOMS optimization is achieved through mini-
mizing the real-time sensing plan to involve less sen-
sors in tracking the actual occupancy state. It consists
of tracking the actual occupancy state and matches it
to the events defined in L, so that our BOMS always
ends with a good match case. Following the actual
state, the optimization algorithm alternates between
the different cases (good, partial, and no-match) with
the lowest number of sensors active.
A sketch of the optimization algorithm is shown in
Algorithm. 1. The optimization results from the case
an event occurrence is consistently confirmed across
consecutive iterations, resulting in a reduction in the
number of sensors required to track the event.
Upon initial identification (good match) of an
event, no optimization takes place. However, upon the
second consecutive confirmation, all sensors assigned
to features with low confidence are deactivated.
Similarly, with further consecutive confirmations
of the expected event, sensors assigned to features
with medium confidence are deactivated. Beyond this
point, no further optimization occurs as the sensing
plan comprises only a few high-confidence sensors
that are sufficient to track and identify the ongoing
occupancy event.
Algorithm 1: Controller Strategy.
1: E
Expected
∈ Events ▷ Select an event to be
monitored.
2: AdjustSensors(E
Expected
) ▷ Sensors for the event.
3: Monitor(E
Expected
) ▷ Monitor the event.
4: switch MonitorStatus(E
Expected
) : ▷ Status of
event.
5: case eventOccurred: ▷ The event has occurred.
6: OptimizeSensors(E
Expected
)
7: Go to step 3 break.
8: case otherEventOccurred: ▷ Other event has
occurred.
9: E
Expected
← E
Other
▷ Select other event.
10: AddSensors(E
Expected
) ▷ Add sensors for the
event.
11: Go to step 3. break.
12: case eventMaybeOccurred: ▷ Event may have
occurred.
13: Go to step 2. break. ▷ Monitor the event
again.
14: case default: ▷ Unexpected event.
15: TurnOnSensors() ▷ Gather more information
using more sensors.
16: Go to step 3. break. ▷ Monitor the system.
5 FORMAL VERIFICATION AND
VALIDATION
To conduct formal verification and validation of the
proposed optimization, we modeled our BOMS in
UPPAAL and specified the properties to look for
in CTL logic. The model specification is modular
and consists of three components (templates), a Con-
troller, a Sensor and an Environment. The templates
can be instantiated with different parameters to create
different system architectures and configurations, and
integrate new sensors, events and environments. The
model is available here.
5.1 Model of the BOMS Control
The Controller process monitors the environment us-
ing Sensor instances, while the Environment simu-
lates the occupancy events. The Controller template
is illustrated in Figure 1, and summarized functional-
ity of the Controller is depicted in Algorithm 1. The
Controller recognizes occupancy events while mini-
mizing the energy consumption of the Sensors. This
is achieved by activating and deactivating the Sen-
sor instances according to the occupancy current state
using the turn on and turn off channels, respectively
(which correspond to the functions AddSensors() and
OptimizeSensors() in the algorithm) and by adjusting
the sampling rate of the Sensors using the global vari-
able sample frequency (which corresponds to Adjust-
Sensors() in the algorithm) since the energy consump-
tion of a sensor depends on its sampling rate and the
time duration it is active. The Controller only mon-
itors one event at a time (E
Expected
) and switches be-
tween the different events to monitor based on the oc-
cupancy state. In Algorithm 1, line 5 corresponds to a
good matching to the expected event, line 8 describes
no matching to the expected event but another event
is recognized. Line 12 is a partial matching of the ex-
pected event, while line 12 describes no matching to
any of the events in L.
5.2 Sensors Modeling
The Sensor template, depicted in Figure 2, com-
prises two locations: On and Off. It samples the
Environment and reports the sampled value to the
Controller when active. The sensor value is read
from the global array environment state, that con-
tains the current state of the Environment and is up-
dated by the Environment template, through func-
tion read() which corresponds to Monitor() in the
algorithm. The periodic sensing, according to the
frequency sensor f requency[id], is modeled using a
ICSOFT 2025 - 20th International Conference on Software Technologies
160
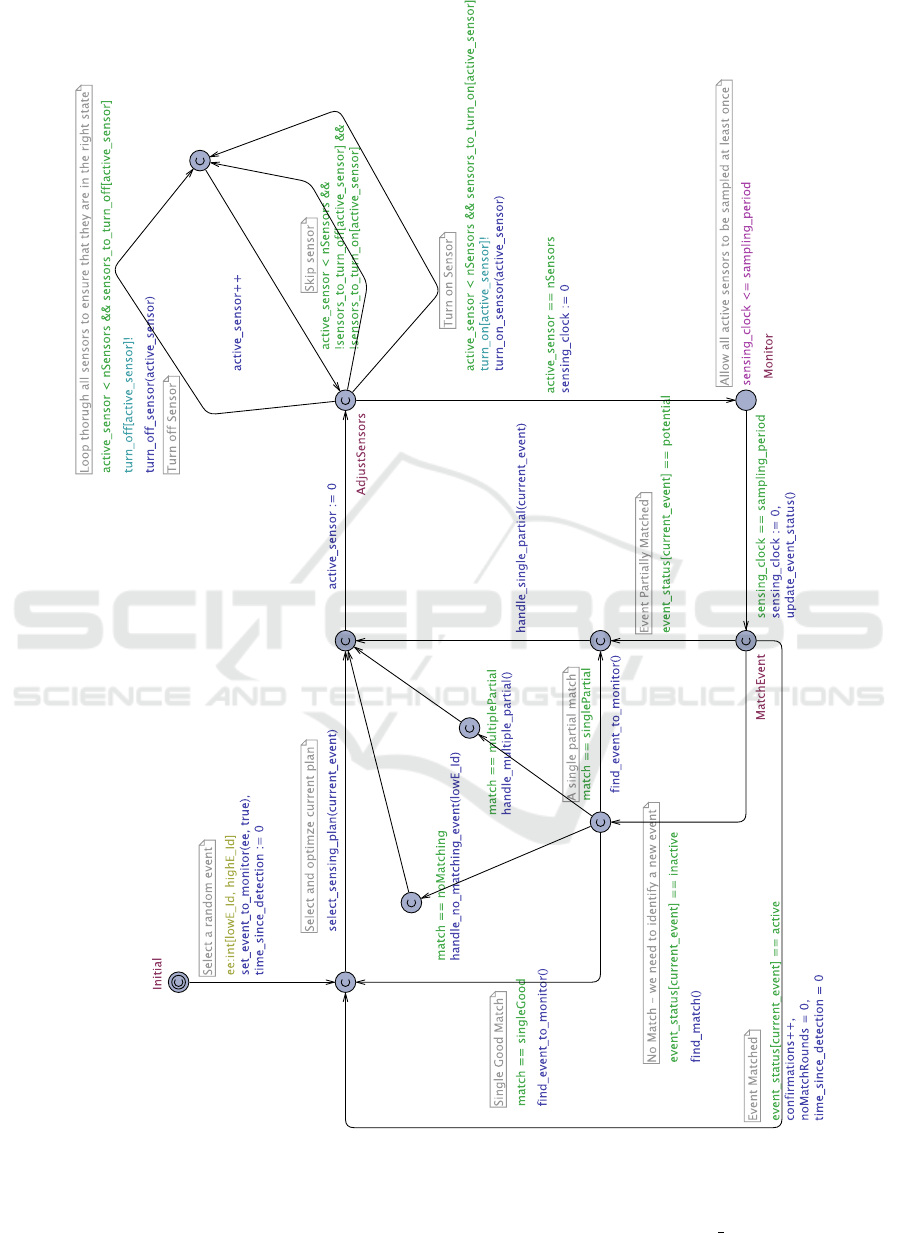
Figure 1: The Controller template.
state invariant in the On location and a clock con-
straint on transition performing the sampling based
on the sampling rate of the Sensor (frequency) and
its local clock variable sample clock. The Controller
Validating the Optimization of a Building Occupancy Monitoring Software System
161

adjusts the sampling frequency by updating the ar-
ray sensor f requency[id], with which each sensor
synchronizes using its Id. Furthermore, each sensor
keeps track of its energy consumption by accounting
for the number of samples taken and the number of
time units spent in the location On through a global
variable energy consumption.
Figure 2: The Sensor template.
5.3 Environment Modeling
The Environment template, depicted in Figure 3,
comprises two locations and periodically generates
occupancy events. The events are generated non-
deterministically upon which a global variable repre-
senting the current occupancy state is updated. Such a
variable is read by the function read() of the different
sensors. The periodic behavior of the Environment
is modeled using a clock constraint on the transition
that generates the new events based on the global vari-
able event period that determines the time between
two events. The event period has to be much larger
than sampling period to ensure that the Controller has
time to detect the event. The Environment is made fi-
nite by constraining the number of events generated
before the Environment goes into an Off state.
5.4 Validation Properties
We specified and verified the following properties for
the optimized BOMS using UPPAAL. The queries are
given in the formulas 1, 2, 3, 4, 5 and also available
here:
• Correctness: The Controller should be able to rec-
ognize all the events generated by Environment.
• Energy Consumption: The energy consumption of
the system should be less than certain threshold.
• Response Time: The response time of the system,
defined as the time it takes for the Controller to
detect an event, should be less than certain thresh-
old.
• Resilience: The system should exhibit resilience,
ensuring that the Controller is always able to de-
vise a strategy to monitor the occupancy, even if
the system is in an unexpected state.
• Accuracy: Each event recognized by the Con-
troller must match the corresponding event gen-
erated by the Environment.
• Performance: The total number of accumulated
sensor samples is always less than or equal to cer-
tain threshold.
Such properties are specified as follows:
Correctness ≜ Env.Execute → (Ctrl.event = Env.event)
(1)
Energy ≜ A□ energyConsumption ≤ E
max
(2)
Response time ≜ A□ ctrl.timeSinceDetection ≤ R
max
(3)
Resilience ≜ A□ not deadlock (4)
Performance ≜ A□ active sensor ≤ X (5)
For the readers who are not familiar with the UP-
PAAL syntax, it should be noted that p → q corre-
sponds to A[](p => A <> q) in CTL.
The response time of the system is monitored us-
ing the clock variable timeSinceDetection that is reset
every time the Controller detects an event. The re-
sponse time property ensures that the Controller will
always detect an event within certain time period (3
sampling periods in our case: 2, 4 and 8 minutes). The
resilience property ensure liveness of the optimized
BOMS system, by which the Controller can always
derive a strategy and evolve following the occupancy
state. The energy consumption property is simply the
sum of the energy consumption of each Sensor, and
is verified by ensuring that the energy consumption
of the system is less than a certain threshold obtained
from the proactivation algorithm. Finally, the correct-
ness property is verified to ensure that any event that
occurs in the BOMS will eventually be detected by
the Controller.
Our formal verification demonstrates that the
aforementioned properties of the original state of the
art BOMS are satisfied by our proactivation BOMS,
that is an optimization of the Office Master 3000
BOMS.
ICSOFT 2025 - 20th International Conference on Software Technologies
162
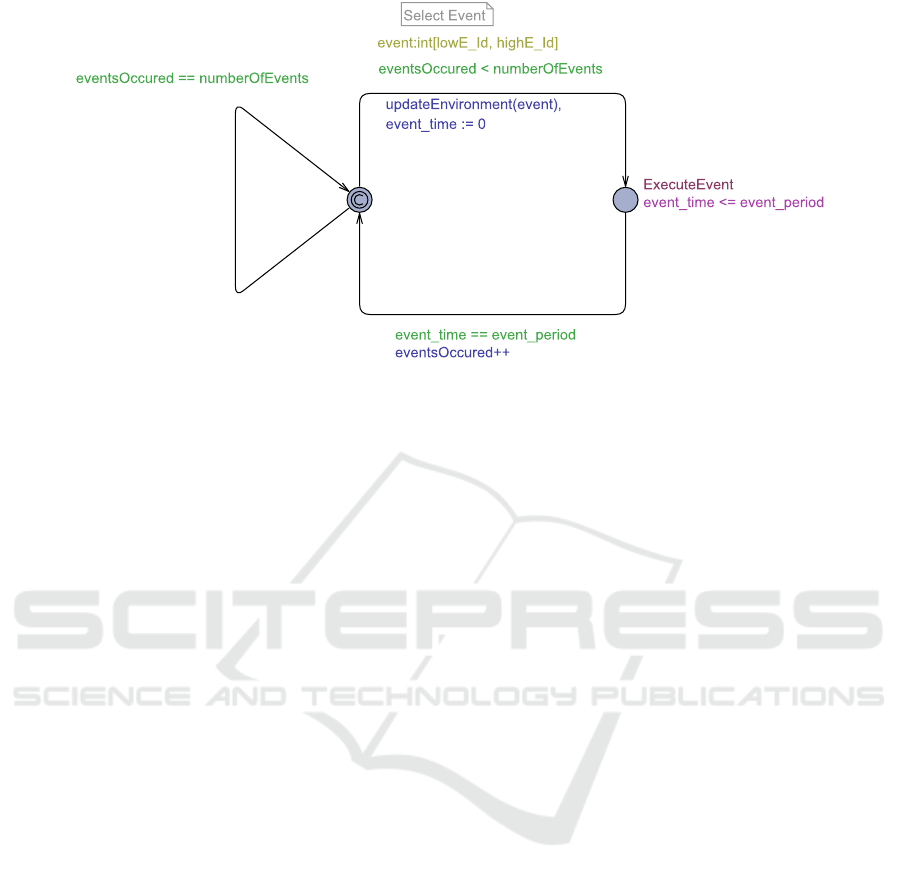
Figure 3: The Environment template.
6 IMPLEMENTATION AND
EXPERIMENTAL VALIDATION
The proposed BOMS system and optimized occu-
pancy tracking algorithm have been implemented in
C++. The implementation is made modular as an in-
tegration of the three components (sensors, environ-
ments and controllers) so that new sensors, events and
environments can be integrated and monitored in a
straightforward manner. For reproducibility, the soft-
ware implementation and data are available here.
We carried out an experiment of a 12-hour period
to evaluate the performance and energy saving of our
optimized BOMS system. To this end, we considered
only one environment (building space) together with
the corresponding controller and 2 hubs of sensors
each of which is composed of 4 sensors (CO
2
, mo-
tion, noise, light).
The key metrics we considered in the evaluation
are the decision accuracy, the percentage of spared
sensor samples and the energy saved due to hav-
ing sensors turned off and/or operating with low fre-
quency. The number of sensors being active at run-
time is depicted in Figure 4. One can see that the sens-
ing plan of our optimized BOMS rarely operates all of
the eight sensors thanks to the knowledge-driven anal-
ysis. The number of active sensors fluctuates from
3 to 6 in the first 500 minutes due to different fea-
tures and occupancy states detected. After 500 min-
utes, the monitored building space is mostly empty
where the only event recognized is Empty, this is why
the number of active sensors is reduced and fluctuates
between 2 and 4.
As a result, the accumulated number of sensor
samples collected by our optimized BOMS for 12
hours is 4212. The total number of samples needed
for the original Office Master 3000 BOMS, where all
the sensors run regularly with the same 2-minutes fre-
quency would be 6480. Thus, our BOMS enables to
save 35% of the data sampling compared to the Of-
fice Master 3000 BOMS and also the state to the art
algorithms (Ortiz Perez et al., 2018; Abraham and Li,
2014) where sensors are permanently active, while
achieving the same accuracy and state knowledge.
As for energy consumption, for a 12-hours opera-
tion our optimized BOMS enables a saving of 9.75kw,
(6480-4212)*0.0043 (Vafamand et al., 2020), com-
pared to the original Office Master 300s that would
need 27.8kw, which represents a saving of 35%.
The accuracy analysis is depicted in Figure 5. It
refers to the matching of the occupancy events iden-
tified by our BOMS algorithm and the actual oc-
cupancy events. The achieved accuracy fluctuates
mostly between 40% and 100% with an average mean
of 84%. This means that in 84% of the experi-
ment time, the expected event (computed according
to the optimized sensing plan) matches the actual
event, whereas no-matching cases (lowest value for
blue line) represent 3.7% of the experiment time, and
partial-matching pattern is 12.3%.
Furthermore, one can see that there is a correla-
tion of the accuracy analysis with the optimized sens-
ing plan. The lower the number of sensors and the
higher the state dynamics are, the lower the accuracy
is. However, upon each low accuracy a new sensing
plan is computed by integrating more sensor samples
incrementally to solve the partial-matching and no-
matching cases. This led to shorten the time periods
Validating the Optimization of a Building Occupancy Monitoring Software System
163
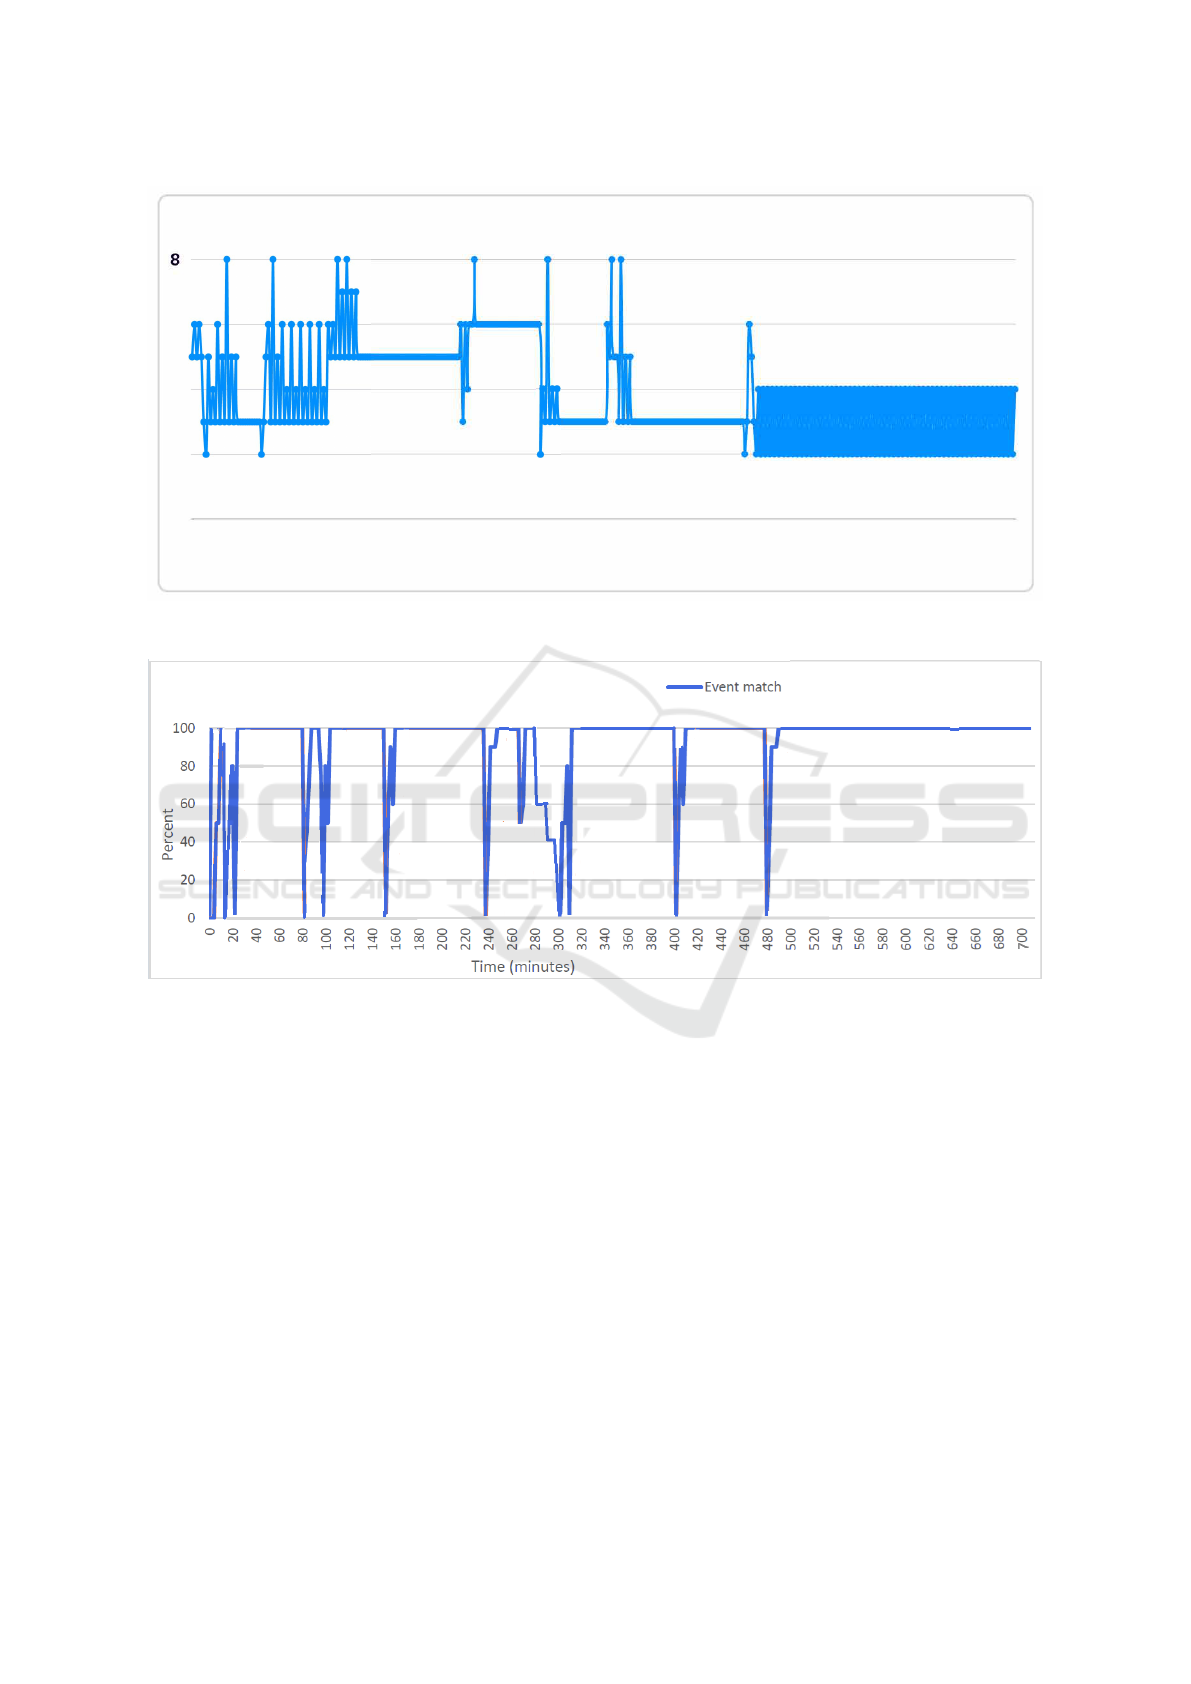
2
■ Active sensors
1
Time (minutes)
Figure 4: Number of sensors active at runtime.
Figure 5: Accuracy of the optimized sensing plan.
for each accuracy drop. In average, each accuracy
drop does not last more than 4-6 minutes.
A partial matching case is depicted in Figure 6
where the occupancy state recognized matches par-
tially the features from 3 different events. As an ex-
ample to solve this inconclusive situation would be
to operate much more sensors to confirm/deny one of
the features so that to exclude either the first 2 op-
tions (Lecture, Meeting) or the last option (Exercise
session).
The outcomes resulting from the software experi-
ment match the verification results conducted on the
model using UPPAAL such as the maximum duration
to recognize an event and the accumulated number of
sensors for the same data set is always below 4300.
7 CONCLUSION
This paper proposed an intelligent knowledge-driven
real-time occupancy monitoring solution (BOMS) as
an optimization of the actual Office Master 3000
BOMS. The proposed analysis enables tuning the fre-
quency of the sensors on-the-fly to reduce data sam-
pling and energy consumption. Rather than collecting
large amounts of sensor data to perform occupancy
analysis post hoc; we proactively identify the minimal
data relevant to the actual state following the seman-
tics of the expected activities.
The proposed BOMS is mechanized in UPPAAL
to perform formal verification and validation of the
non-functional properties of the original BOMS post-
optimization. An early proof-of-concept prototype
has been implemented in C++. Furthermore, our so-
ICSOFT 2025 - 20th International Conference on Software Technologies
164

Figure 6: Partial matching to multiple events.
lution has been tested and compared to baseline occu-
pancy analysis. The experiment results showed that,
while achieving a considerable reduction in computa-
tion cost (up to 35%) and energy consumption (up to
31%), it maintains high accuracy for the occupancy
tracking (up to 84%).
As future work, we plan to integrate much more
features and events to achieve a real-world occupancy
state catalog. Moreover, we will also conduct a thor-
ough analysis and validation of the proactivation on
different case studies and compare the optimization
results to those of machine-learning techniques.
REFERENCES
Abraham, S. and Li, X. (2014). A cost-effective wireless
sensor network system for indoor air quality monitor-
ing applications. Procedia Computer Science, 14(34).
Ahmad, J., Larijani, H., Emmanuel, R., Mannion, M.,
and Javed, A. (2021). Occupancy detection in non-
residential buildings – a survey and novel privacy pre-
served occupancy monitoring solution. Applied Com-
puting and Informatics, 17(2).
Alur, R. and Dill, D. L. (1994). A theory of timed automata.
Theoretical Computer Science, 126(2).
Austin, M., Delgoshaei, P., Coelho, M., and Heidarine-
jad, M. (2020). Architecting smart city digital twins:
Combined semantic model and machine learning ap-
proach. Journal of Management in Engineering,
36(4).
Azimi, S. and O’Brien, W. (2022). Fit-for-purpose: Measur-
ing occupancy to support commercial building opera-
tions: A review. Building and Environment Journal,
22(212).
Baerentzen, M. U., Boudjadar, J., ul Islam, S., and Schultz,
C. P. L. (2023). A knowledge-based proactive intel-
ligent system for buildings occupancy monitoring. In
ICSOFT, pages 680–687.
Baier, C. and Katoen, J.-P. (2008). Principles of Model
Checking. The MIT Press.
Boudjadar, A., Vaandrager, F., Bodeveix, J.-P., and Filali,
M. (2013). Extending uppaal for the modeling and
verification of dynamic real-time systems. In Arbab,
F. and Sirjani, M., editors, Fundamentals of Software
Engineering. Springer Berlin Heidelberg.
Boudjadar, J., David, A., Kim, J. H., Larsen, K. G., Nyman,
U., and Skou, A. (2014). Schedulability and energy
efficiency for multi-core hierarchical scheduling sys-
tems. In International Embedded Real-time Systems
Sysmposium ERTS2.
Boudjadar, J. and Khooban, M. (2020). A safety-driven cost
optimization for the real-time operation of a hybrid
energy system. In Proceedings of the 27th Interna-
tional Conference on Systems Engineering (ICSEng).
Boudjadar, J. and Tomko, M. (2022). A digital twin setup
for safety-aware optimization of a cyber-physical sys-
tem. In Proceedings of the 19th International Con-
ference on Informatics in Control, Automation and
Robotics.
Cala, D., Matthes, P., Huchtemann, K., Streblow, R., and
M
¨
uller, D. (2015). Co
2
based occupancy detection
algorithm: Experimental analysis and validation for
office and residential buildings. Building and Envi-
ronment Journal, 86.
Costenaro, D. and Duer, A. (2012). The megawatts be-
hind your megabytes: Going from data-center to desk-
top. In ACEEE Summer Study on Energy Efficiency in
Buildings.
Dai, X., Liu, J., and Zhang, X. (2020). A review of stud-
ies applying machine learning models to predict occu-
pancy and window-opening behaviours in smart build-
ings. Energy and Buildings, 20(223).
E. M. Clarke, J., Grumberg, O., and Peled, D. A. (1999).
Model Checking. MIT Press.
Elkhoukhi, H., NaitMalek, Y., Berouine, A., Bakhouya, M.,
Elouadghiri, D., and Essaaidi, M. (2018). Towards
a real-time occupancy detection approach for smart
buildings. Procedia Computer Science, 18(134).
Jabirullah, M., Khan, A., Ali, M., Wajih, S., and Hussain,
M. (2021). Iot-based occupancy monitoring tech-
niques for energy efficient smart buildings. Turkish
Online Journal of Qualitative Inquiry, 21(12).
Jiang, J., Wang, C., Roth, T., and Nguyen, C. (2022).
Residential house occupancy detection: Trust-based
scheme using economic and privacy-aware sensors.
IEEE Internet of Things Journal, 9(3).
Jiang, W. and Yin, Z. (2015). Human activity recognition
using wearable sensors by deep convolutional neural
networks. In Proceedings of the 23rd ACM Interna-
tional Conference on Multimedia.
Lasla, N., Doudou, M., Djenouri, D., Ouadjaout, A., and Zi-
zoua, C. (2019). Wireless energy efficient occupancy-
monitoring system for smart buildings. Pervasive and
Mobile Computing Journal, 19(59).
Lou, X., Lam, K. P., Chen, Y., and Hong, T. (2017). Perfor-
mance evaluation of an agent-based occupancy simu-
Validating the Optimization of a Building Occupancy Monitoring Software System
165

lation model. Technical report, School of Architec-
ture, Carnegie Mellon University.
McKenna, E., Krawczynski, M., and Thomson, M. (2015).
Four-state domestic building occupancy model for en-
ergy demand simulations. Energy and Buildings,
15(96).
Minoli, D., Sohraby, K., and Occhiogrosso, B. (2017).
Iot considerations, requirements, and architectures
for smart buildings - energy optimization and next-
generation building management systems. IEEE In-
ternet of Things Journal, 4(1).
Nienaber, F., Wolf, S., Wesseling, M., Cal
`
ı, D., Muller,
D., and Madsen, H. (2020). Validation, optimisation
and comparison of carbon dioxide-based occupancy
estimation algorithms. Indoor and Built Environment
Journal, 29(6).
Ortiz Perez, A., Bierer, B., Scholz, L., Wollenstein, J., and
Palzer, S. (2018). A wireless gas sensor network to
monitor indoor environmental quality in schools. Sen-
sors Journal, 18(12).
Pan, S., Bonde, A., Jing, J., Zhang, L., Zhang, P., and Noh,
H. Y. (2014). Boes: Building occupancy estimation
system using sparse ambient vibration monitoring. In
Proceedings of Sensors and Smart Structures Tech-
nologies for Civil, Mechanical, and Aerospace Sys-
tems SPIE.
Rai, S., Wang, M., and Hu, X. (2015). A graph-based
agent-oriented model for building occupancy simu-
lation. In Proceedings of the Symposium on Agent-
Directed Simulation.
Rault, T., Bouabdallah, A., and Challal, Y. (2014). Energy
efficiency in wireless sensor networks: A top-down
survey. Computer Networks, 14(67).
Salimi, S. and Hammad, A. (2019). Critical review and re-
search roadmap of office building energy management
based on occupancy monitoring. Energy and Build-
ings, 19(182).
Salimi, S. and Hammad, A. (2020). Sensitivity analysis
of probabilistic occupancy prediction model using big
data. Building and Environment, 20(172).
Seghezzi, E., Locatelli, M., Pellegrini, L., Pattini, G.,
Di Giuda, G. M., Tagliabue, L. C., and Boella, G.
(2021). Towards an occupancy-oriented digital twin
for facility management: Test campaign and sensors
assessment. Applied Sciences, 11(7).
Shokrollahi, A., Persson, J. A., Malekian, R., Sarkheyli-
H
¨
agele, A., and Karlsson, F. (2024). Passive infrared
sensor-based occupancy monitoring in smart build-
ings: A review of methodologies and machine learn-
ing approaches. Sensors Journal, 24(5).
Sun, K., Zhao, Q., and Zou, J. (2020). A review of building
occupancy measurement systems. Energy and Build-
ings, 20(216).
Teng, S. Y., Tou
ˇ
s, M., Leong, W. D., How, B. S., Lam,
H. L., and Masa, V. (2021). Recent advances on in-
dustrial data-driven energy savings: Digital twins and
infrastructures. Renewable and Sustainable Energy
Reviews, 21(135).
Tien, P. W., Wei, S., Calautit, J. K., Darkwa, J., and Wood,
C. (2022). Real-time monitoring of occupancy activ-
ities and window opening within buildings using an
integrated deep learning-based approach for reducing
energy demand. Applied Energy, 22(308).
Trivedi, D. and Badarla, V. (2020). Occupancy detection
systems for indoor environments: A survey of ap-
proaches and methods. Indoor and Built Environment
Journal, 29(8).
Vafamand, N., Boudjadar, J., and Khooban, M. H. (2020).
Model predictive energy management in hybrid ferry
grids. Energy Reports, 6:550–557.
Yang, J., Santamouris, M., and Lee, S. L. (2016). Review
of occupancy sensing systems and occupancy model-
ing methodologies for the application in institutional
buildings. Energy and Buildings, 16(121).
Zhang, H.-B., Zhang, Y.-X., Zhong, B., Lei, Q., Yang, L.,
Du, J.-X., and Chen, D.-S. (2019). A comprehen-
sive survey of vision-based human action recognition
methods. Sensors Journal, 19(5).
Zhang, W., Wu, Y., and Calautit, J. K. (2022). A review
on occupancy prediction through machine learning for
enhancing energy efficiency, air quality and thermal
comfort in the built environment. Renewable and Sus-
tainable Energy Reviews, 22(167).
ICSOFT 2025 - 20th International Conference on Software Technologies
166
