
ClustSize: An Algorithmic Framework for Size-Constrained
Clustering
Diego Vallejo-Huanga
1,2 a
and C
`
esar Ferri
2
and Fernando Mart
´
ınez-Plumed
2
1
IDEIAGEOCA Research Group, Universidad Polit
´
ecnica Salesiana, Quito, Ecuador
2
VRAIN, Universitat Polit
`
ecnica de Val
`
encia, Valencia, Spain
Keywords:
Size-Constrained Clustering, K-MedoidsSC, CSCLP, Interactive Web Application, R Shiny, User Experience.
Abstract:
Size-constrained clustering addresses a fundamental need in many real-world applications by ensuring that
clusters adhere to user-specified size limits, whether to balance groups or to satisfy domain-specific require-
ments. In this paper, we present ClustSize, an interactive web platform that implements two advanced
algorithms: K-MedoidsSC and CSCLP, to perform real-time clustering of tabular data under strict size con-
straints. Developed in R Studio using the Shiny framework and deployed on Shinyapps.io, ClustSize not
only enforces precise cluster cardinalities, but also facilitates dynamic parameter tuning and visualisation for
enhanced user exploration. We comprehensive validate its performance through comprehensive benchmark-
ing, also evaluating runtime, RAM usage, load, and stress conditions, and gather usability insights via user
surveys. Post-deployment evaluations confirm that both algorithms consistently produce clusters that exactly
meet the specified size limits, and that the system reliably supports up to 50 concurrent users and maintains
functionality under stress, processing approximately 90 requests in 5 seconds. These results highlight the
potential of integrating advanced size-constrained clustering into interactive web platforms for practical data
analysis.
1 INTRODUCTION
Clustering techniques (Celebi and Aydin, 2016; Sax-
ena et al., 2017) are a cornerstone of unsupervised
learning, widely employed to uncover hidden struc-
tures in complex datasets across diverse domains such
as healthcare, finance, and natural sciences (Jain,
2010). In traditional clustering, however, little at-
tention is paid to a crucial practical constraint: en-
suring that clusters adhere to predetermined size lim-
its. In many real-world scenarios, balancing the num-
ber of elements in each cluster is crucial, not only
to improve the interpretability of results but also to
prevent imbalanced partitions that can skew subse-
quent analyses. Motivated by these concerns, size-
constrained clustering methods (Wagstaff et al., 2001)
have recently emerged as a promising solution, en-
abling more robust and representative groupings.
In this paper, we adapt and extend two state-
of-the-art size-constrained clustering algorithms,
K-MedoidsSC and CSCLP (Vallejo-Huanga et al.,
2017), originally developed for clustering documents,
a
https://orcid.org/0000-0002-2704-3858
to robustly and accurately handle structured tabular
data. To underpin these extensions, we introduce a
formal mathematical notation that rigorously defines
our problem—partitioning a dataset into clusters that
must satisfy exact size requirements—and the asso-
ciated algorithms. We aim that our methods are not
only theoretically sound, but also reproducible.
Equally importantly, we implement the extended
algorithms efficiently and effectively within a user-
friendly web application for real-time data explo-
ration and visualization: ClustSize aiming to
bridge the gap between algorithmic innovation and
usability. Developed in R (R Core Team, 2024) and
deployed via the Shiny framework (Beeley, 2016),
this application provides an interface where users
can upload datasets, configure clustering parameters,
and instantly visualize results. Our implementation
emphasizes efficient resource management and fast
execution, which is particularly important for real-
time data exploration in resource-constrained envi-
ronments such as Shinyapps.io
1
.
The decision to develop both clustering algo-
1
https://www.shinyapps.io/
Vallejo-Huanga, D., Ferri, C., Martínez-Plumed and F.
ClustSize: An Algorithmic Framework for Size-Constrained Clustering.
DOI: 10.5220/0013558900003967
In Proceedings of the 14th International Conference on Data Science, Technology and Applications (DATA 2025), pages 481-490
ISBN: 978-989-758-758-0; ISSN: 2184-285X
Copyright © 2025 by Paper published under CC license (CC BY-NC-ND 4.0)
481

rithms is driven by their complementary strengths.
K-MedoidsSC, an extension of the conventional
K-Medoids method, is designed for speed and re-
source efficiency, making it well-suited for larger
datasets and interactive applications. In contrast,
CSCLP employs a linear programming formulation
that enforces size constraints even under complex data
distributions. By incorporating both methods, our
platform offers users a choice based on dataset char-
acteristics and performance requirements, also en-
abling side-by-side comparisons of the tradeoffs in-
herent in each approach.
To validate both the algorithms and the web ap-
plication, we conducted comprehensive evaluations
on 15 representative datasets from OpenML (Van-
schoren et al., 2014), spanning small to large vol-
umes and various domains. We analyzed execution
time and memory consumption, and performed load
and stress tests to determine system resilience under
increasing user concurrency. Complementing these
technical analyses, we also perform usability evalua-
tions via structured surveys to confirm that our plat-
form is intuitive and accessible to both experts and
non-experts. Notably, our experiments reveal that the
K-MedoidsSC algorithm not only executes faster and
uses less memory than CSCLP, but it also supports
larger datasets—an important consideration given the
limitations of resource-constrained environments like
Shinyapps.io’s free tier.
The primary contributions of this work are as fol-
lows:
• We extend and rigorously formalize two state-of-
the-art size-constrained clustering algorithms for
structured tabular data, ensuring compliance with
explicit cluster size limits.
• We design and implement an efficient, interactive
web platform (ClustSize) that seamlessly inte-
grates these algorithms to provide real-time clus-
tering with dynamic parameter tuning and visual-
ization.
• We present a comprehensive evaluation of al-
gorithmic performance—including performance,
runtime, memory usage, and scalability under
load—and complement this with practical usabil-
ity assessments.
• We offer valuable insights into integrating ad-
vanced clustering methodologies within web en-
vironments, addressing challenges related to re-
source limitations and multi-user access.
The rest of the paper is organized as follows. Sec-
tion2 reviews related work in size-constrained clus-
tering. Sections 3 and 4 describe our methodology
and details the development of the web platform, in-
cluding adaptations to the K-MedoidsSC and CSCLP
algorithms. Section 5 presents our experimental re-
sults, and Section 6 concludes the paper and outlines
future work.
2 RELATED WORKS
Over the past decade, researchers have increasingly
recognized that traditional clustering techniques often
fall short when practical constraints—especially those
related to cluster size—are imposed by real-world ap-
plications. This realization has spurred a range of
studies aimed at integrating size restrictions into clus-
tering algorithms while preserving or even enhancing
clustering quality.
For instance, (Zhu et al., 2010) highlights the im-
portance of incorporating size constraints into tra-
ditional clustering algorithms to improve clustering
accuracy and avoid the formation of outlier clus-
ters. They propose a heuristic algorithm that converts
size-constrained clustering problems into integer lin-
ear programming problems, offering an approach to
handle approximate size range constraints instead of
exact cluster size constraints. Building on similar
ideas, (Zhang et al., 2014) proposed a unified frame-
work that simultaneously incorporates size and pair-
wise constraints. Their method minimizes the dis-
crepancy between the ground truth distribution and
the clustering output, a strategy that has been vali-
dated across both balanced and imbalanced datasets
using metrics such as Normalized Mutual Informa-
tion (NMI) (Strehl and Ghosh, 2002) and a new mea-
sure called Alignment Score (AS). Also, (Tang et al.,
2019) proposed the Balanced Clustering Algorithm
(BCA). This method uses Integer Linear Program-
ming (ILP) to achieve balanced clustering. Compared
to other methods, experimental tests were performed
using synthetic and real datasets to evaluate the al-
gorithm’s performance. The results of the proposed
method show better performance in terms of MSE and
runtime compared with two other balanced clustering
algorithms (Malinen and Fr
¨
anti, 2014) (Zhu et al.,
2010).
Parallel to these ILP-based and heuristic ap-
proaches, researchers have also explored direct mod-
ifications to classical algorithms. (Ganganath et al.,
2014) modified the K-Means algorithm itself by inte-
grating explicit size constraints in the clustering pro-
cess. Their empirical studies with multidimensional
datasets modified the K-Means algorithm itself by
integrating explicit size constraints in the clustering
process.
DATA 2025 - 14th International Conference on Data Science, Technology and Applications
482

In addition to these centralized formulations, re-
cent work has expanded the scope of size-constrained
clustering to distributed systems. (Bassil et al., 2023),
for example, presented the SC-Clust algorithm—a de-
centralized approach designed for modular robotics.
By leveraging local information from individual mod-
ules, their distributed framework efficiently manages
large-scale clustering tasks while respecting size con-
straints, highlighting the benefits of applying these
techniques in resource-constrained, distributed envi-
ronments.
Most pertinent to our work, (Vallejo-Huanga
et al., 2017) introduced two semi-supervised
clustering algorithms—K-MedoidsSC and CSCLP
(Clustering with Size Constraints with Linear
Programming)—that integrate size constraints within
the clustering process. Originally applied to cluster
scientific papers using natural language processing
techniques and textual embeddings, these algorithms
demonstrated how domain-specific information
could be harnessed to guide clustering outcomes in
a manner that respects predefined size limits. This
approach underscored the potential of combining
traditional clustering paradigms with domain-relevant
constraints and has provided a strong foundation
for further extensions, including the adaptation to
structured tabular data as explored in our current
study.
Together, these lines of work offer a broad per-
spective on how size constraints can be effectively
incorporated into clustering methods. They moti-
vate our research objective: to extend and adapt the
K-MedoidsSC and CSCLP algorithms so that they can
process structured tabular data in a real-time, web-
based environment.
3 METHODS
We implemented a systematic methodology that en-
compasses dataset selection, algorithm development,
web application design, and multi-faceted perfor-
mance evaluation. Our approach, summarized in Fig-
ure 1, follows a waterfall model (Royce, 1987) in se-
quential and interlinked phases.
3.1 Data Selection and Preprocessing
A diverse collection of a subset of 15 tabular datasets
from OpenML (Vanschoren et al., 2014) (study
100 (Bischl et al., 2017)), was chosen to evaluate the
effect of cluster size constraints across various do-
mains. These datasets, as detailed in Table 1, were
chosen to span different scales (small: up to 2120 in-
stances, medium: from 2121 to 4000 instances, and
large: from 4001 to 6500 instances), variable counts,
and subject areas ranging from natural sciences to so-
cial sciences.
Table 1: Metadata for the 15 structured test datasets used
in our evaluations: identifier (ID), dataset name, the total
number of instances, the number of variables, the relevant
field of knowledge, and the empirical taxonomy categoriz-
ing the dataset by size.
ID Name #Instances #Variables Knowledge Field Taxonomy
1 Iris 150 3 Natural Sciences Small
2 Heart Disease 1025 14 Health Sciences Small
3 Obesity Levels 2111 17 Health Sciences Small
4 Glass Identification 214 9 Natural Sciences Small
5 Breast Cancer Wisconsin 568 30 Health Sciences Small
6 Engineering Graduate Salary 2998 34 Finance Medium
7 Water Probability 3276 10 Natural Sciences Medium
8 Cure The Princess 2338 14 Multimedia Medium
9 AIDS Clinical 2139 24 Health Sciences Medium
10 Migration from Mexico to USA 2443 10 Social Sciences Medium
11 Bank Loan Approval 5000 14 Finance Large
12 Wine Quality 6497 13 Enology Large
13 Clustering of cycling 4435 11 Sports Analysis Large
14 Turkiye-student-evaluation 5820 33 Mathematical Sci. Large
15 Abalone 4177 8 Natural Sciences Large
In addition to the dataset metadata such as the
number of instances and variables, each dataset was
further characterized by its ground truth grouping and
cardinalities (see Table 2), thus serving as baselines
for both algorithm validation and comparative analy-
sis.
Table 2: Group sizes (cardinality) for each dataset in Ta-
ble 1.
ID #Groups
Cluster Size
1 2 3 4 5 6 7 8 9
1 3 50 50 50 – – – – – –
2 2 499 526 – – – – – – –
3 7 272 287 351 297 324 290 290 – –
4 6 70 76 17 13 9 29 – – –
5 2 356 212 – – – – – – –
6 2 226 2772 – – – – – – –
7 2 1998 1278 – – – – – – –
8 2 1177 1161 – – – – – – –
9 2 1618 521 – – – – – – –
10 6 330 593 392 93 162 873 – – –
11 2 4520 480 – – – – – – –
12 7 1599 4898 — – – – – – –
13 9 1399 312 467 356 290 549 503 185 374
14 3 775 1444 3601 – – – – – –
15 3 1307 1342 1528 – – – – – –
3.2 Algorithmic Implementation
Two semi-supervised clustering algorithms were
implemented in the R programming language:
K-MedoidsSC and CSCLP (Clustering with Size Con-
straints and Linear Programming) (Vallejo-Huanga
et al., 2017). Both algorithms are adapted to enforce
explicit size constraints while partitioning tabular
data. Also, both algorithms rely on distance metrics-
Cosine and Euclidean measures-computed over dis-
similarity matrices. These metrics directly inform the
ClustSize: An Algorithmic Framework for Size-Constrained Clustering
483
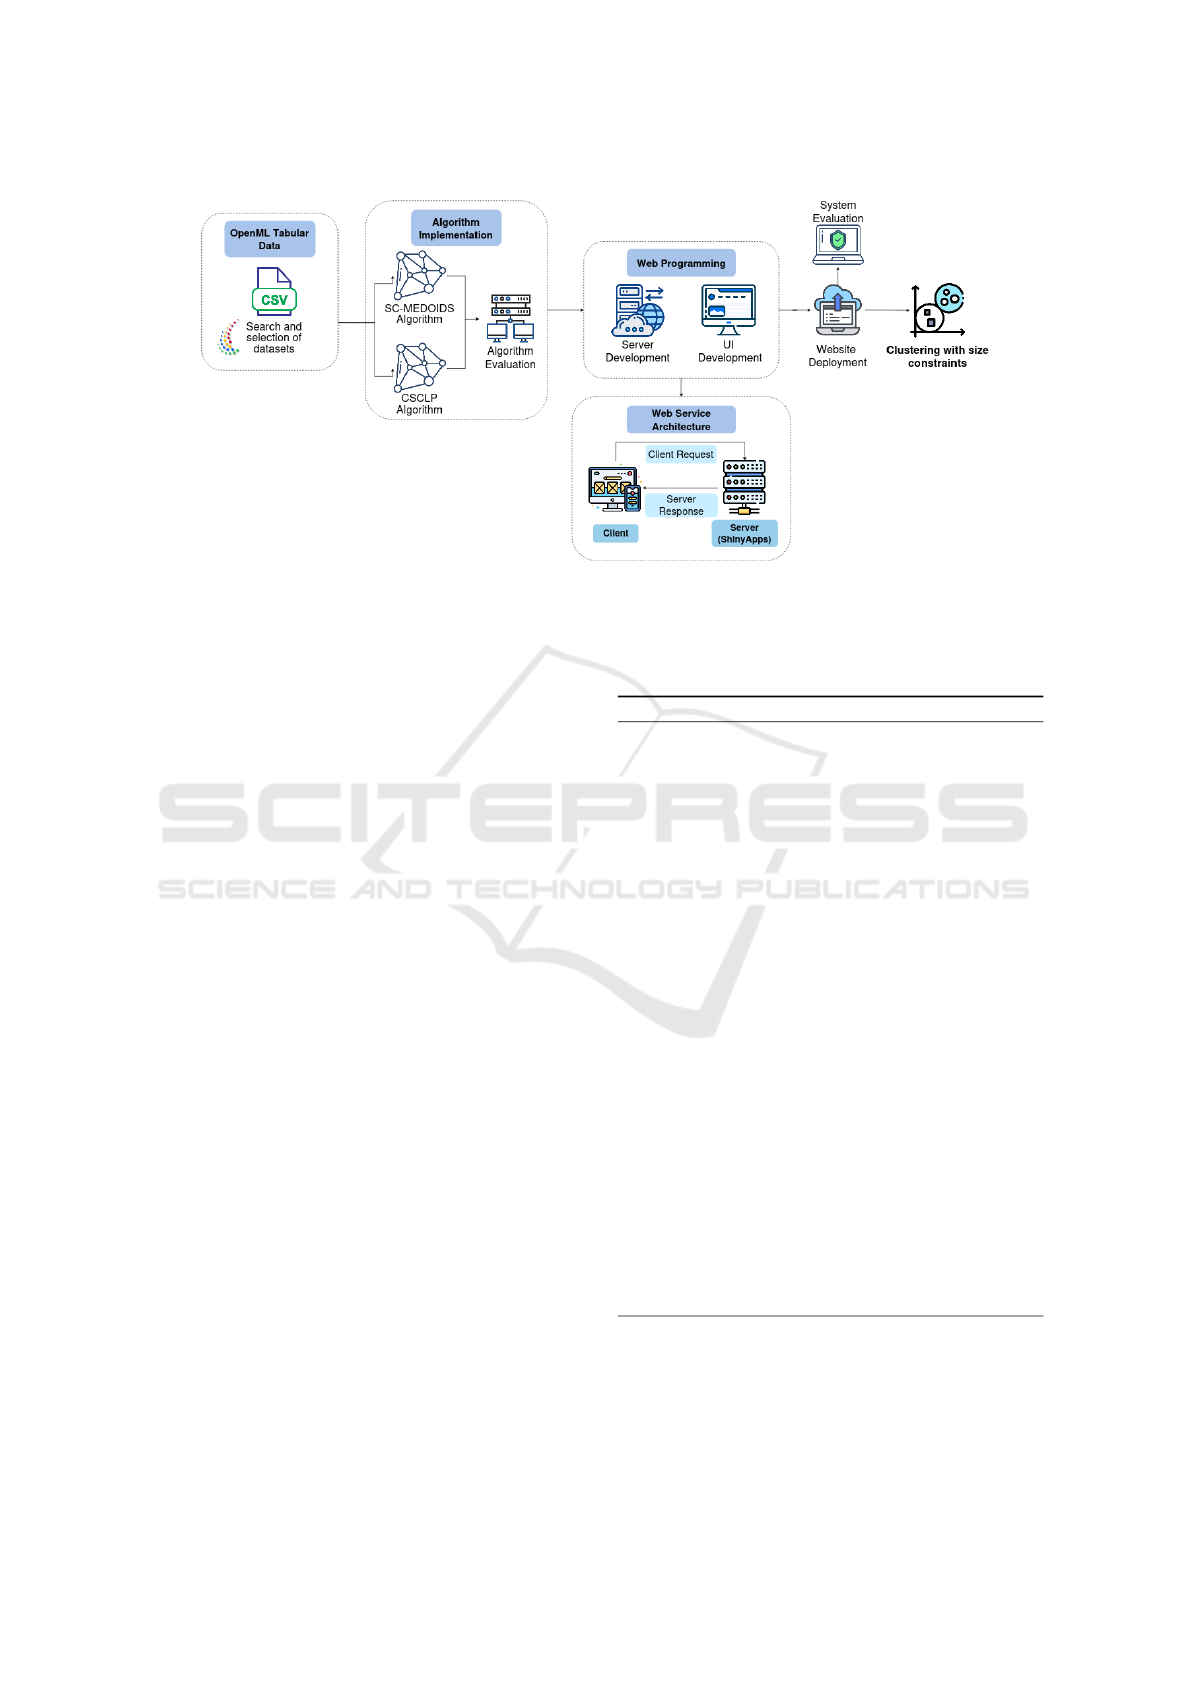
Figure 1: Diagram of the methodological process for implementing and deploying clustering algorithms with size restrictions
in the web application.
instance allocation procedures, ensuring that the fi-
nal clustering solutions are consistent with both the
proximity-based grouping criteria and the external
size restrictions.
In our work, we consider a dataset D =
{x
1
, x
2
, . . . , x
n
} where each x
i
is an observation. We
wish to partition D into k disjoint clusters while im-
posing an exact size constraint on each cluster. The
desired cluster sizes are specified by the vector E =
[E
1
, E
2
, . . . , E
k
], so that for each cluster C
i
, it holds
that |C
i
| = E
i
. In addition, we define a distance func-
tion d(x, c) to quantify the dissimilarity between any
instance x ∈ D and a centroid c.
3.2.1 K-MedoidsSC
K-MedoidsSC extends the conventional K-Medoids
framework by pre-assigning instances to clusters
based on predefined size requirements. Its procedure
involves an initial medoid selection, a distance-based
instance sorting, and a two-stage assignment process
that guarantees each cluster meets its cardinality con-
straint.
The K-MedoidsSC algorithm operates as fol-
lows. If no initial medoids are provided, a set
C = {c
1
, c
2
, . . . , c
k
} ⊂ D is randomly selected. Next,
the algorithm computes the distance d(x, c
i
) between
each instance x and every medoid c
i
. The dataset D is
then sorted in ascending order based on the minimum
distance min
1≤i≤k
d(x, c
i
). For each cluster index
i = 1, 2, . . . , k, the algorithm assigns the first E
i
unas-
signed, closest instances to cluster C
i
. Finally, any
remaining instances are assigned to the cluster that
minimizes d(x, c
i
), i.e., Assign x to C
j
where j =
argmin
1≤i≤k
d(x, c
i
). This procedure guarantees that
the size constraints |C
i
| = E
i
are fulfilled exactly. The
detailed pseudocode for SC-Medoids is presented in
Algorithm 1.
Algorithm 1: K-MedoidsSC Clustering Algorithm.
Require: Data set D = {x
1
, x
2
, . . . , x
n
}, num-
ber of clusters k, desired cluster sizes
E = [E
1
, E
2
, . . . , E
k
],
1: (optional) initial medoids C =
{c
1
, c
2
, . . . , c
k
} ⊂ D
Ensure: Partition {C
1
, C
2
, . . . , C
k
} of D satisfying
|C
i
| = E
i
for i = 1, . . . , k
2: if C not provided then
3: Randomly select k distinct instances from D
as medoids; set C = {c
1
, . . . , c
k
}
4: end if
5: Compute the distance matrix: for every x ∈ D and
each medoid c
i
, calculate d(x, c
i
)
6: Sort D in ascending order according to
min
1≤i≤k
d(x, c
i
)
7: for i = 1, . . . , k do
8: Assign the first E
i
(closest and unassigned) in-
stances from the sorted list to cluster C
i
9: end for
10: for each remaining instance x ∈ D do
11: Assign x to cluster C
j
where
j = arg min
1≤i≤k
d(x, c
i
).
12: end for
13: return Clusters {C
1
, C
2
, . . . , C
k
}
3.2.2 CSCLP
CSCLP integrates linear programming into the cluster-
ing process. Beginning with an initial partition de-
rived from K-Means clustering, the algorithm checks
DATA 2025 - 14th International Conference on Data Science, Technology and Applications
484

whether the resultant clusters satisfy the imposed size
constraints. In cases where the constraints are vio-
lated, the algorithm reformulates the clustering task as
a binary linear programming problem. Here, the ob-
jective function minimizes cluster dissimilarity sub-
ject to equality constraints that enforce the desired
cluster sizes. Regarding their operation, we again
consider the dataset D and the desired cluster-size
vector E = [E
1
, E
2
, . . . , E
k
]. An initial clustering—
obtained, for instance, via K-Means—yields tenta-
tive clusters C
1
, C
2
, . . . , C
k
with corresponding cen-
troids c
1
, c
2
, . . . , c
k
. If these clusters already satisfy
|C
i
| = E
i
for all i, the current assignment is returned.
Otherwise, we reformulate the clustering task as a bi-
nary linear programming (BLP) problem. For each
instance x
j
∈ D and cluster i, we introduce a binary
decision variable
Z
i j
=
(
1, if x
j
is assigned to cluster i,
0, otherwise.
(1)
The objective is to minimize the overall assignment
cost:
min
Z
k
∑
i=1
n
∑
j=1
d(x
j
, c
i
)Z
i j
, (2)
subject to the constraints
k
∑
i=1
Z
i j
= 1, ∀ j = 1, 2, . . . , n, (3)
n
∑
j=1
Z
i j
= E
i
, ∀i = 1, 2, . . . , k, (4)
Z
i j
∈ {0, 1}, ∀i, j. (5)
After solving this binary LP, the optimal assignment
matrix Z
∗
is obtained. The final cluster labeling is
then given by setting
R(x
j
) = i if Z
∗
i j
= 1, j = 1, . . . , n.
A complete pseudocode for CSCLP is provided in Al-
gorithm 2.
4 WEB APPLICATION
Following local validation of the clustering algo-
rithms, a robust web application was developed using
the R Shiny framework
2
to serve as an interactive
platform for real-time clustering analyses. The design
and implementation of ClustSize were driven
by the need to combine computational efficiency
with an intuitive user experience, ensuring that both
2
https://www.shinyapps.io/
Algorithm 2: CSCLP Clustering Algorithm.
Require: Data set D = {x
1
, . . . , x
n
}, desired number
of clusters k, desired cluster sizes E = [E
1
, . . . , E
k
]
Ensure: Cluster assignment R : D → {1, 2, . . . , k}
with |{x : R(x) = i}| = E
i
1: Perform an initial clustering (e.g., using k-means)
to obtain tentative clusters {C
1
, . . . , C
k
} with cen-
troids {c
1
, . . . , c
k
}
2: if for all i, |C
i
| = E
i
then
3: return current cluster assignment R
4: else
5: Define binary variables Z = [Z
i j
] following
Eq. 1
6: Formulate a binary linear programming
problem, minimizing Eq. 2 with the constraints 3
7: Solve the above LP to obtain the optimal as-
signment matrix Z
∗
8: for j = 1, . . . , n do
9: Set R(x
j
) = i such that Z
∗
i j
= 1
10: end for
11: return the updated cluster assignment R
12: end if
expert and non-expert users can easily deploy size-
constrained clustering on their datasets. ClustSize
is publicly accessible, and its services can be used at:
https://clustering-algorithms-with-size-constraints.
shinyapps.io/shinyapps/
4.1 Modular and Reactive Architecture
ClustSize is built on a modular, reactive archi-
tecture that separates user interface (UI) components
from server-side computations. This design lever-
ages Shiny’s reactive programming paradigm to en-
sure that any input parameter change triggers imme-
diate output updates. By encapsulating key function-
alities (such as data upload, parameter configuration,
clustering execution, and visualization) within dis-
crete modules, the application maintains high code
reusability and ease of maintenance. In this client-
server setup, heavy computations (e.g., running the
clustering algorithms and performing principal com-
ponent analysis) are handled server-side, while the
client interface facilitates a seamless, interactive ex-
perience.
Furthermore, to overcome resource constraints
on platforms like Shinyapps.io, the application opti-
mizes computational performance and resource man-
agement by caching results and fine-tuning reactive
expressions to avoid unnecessary recalculations. The
code architecture supports smooth interactivity under
high load by offloading data-heavy tasks to the server
and efficiently managing user sessions.
ClustSize: An Algorithmic Framework for Size-Constrained Clustering
485
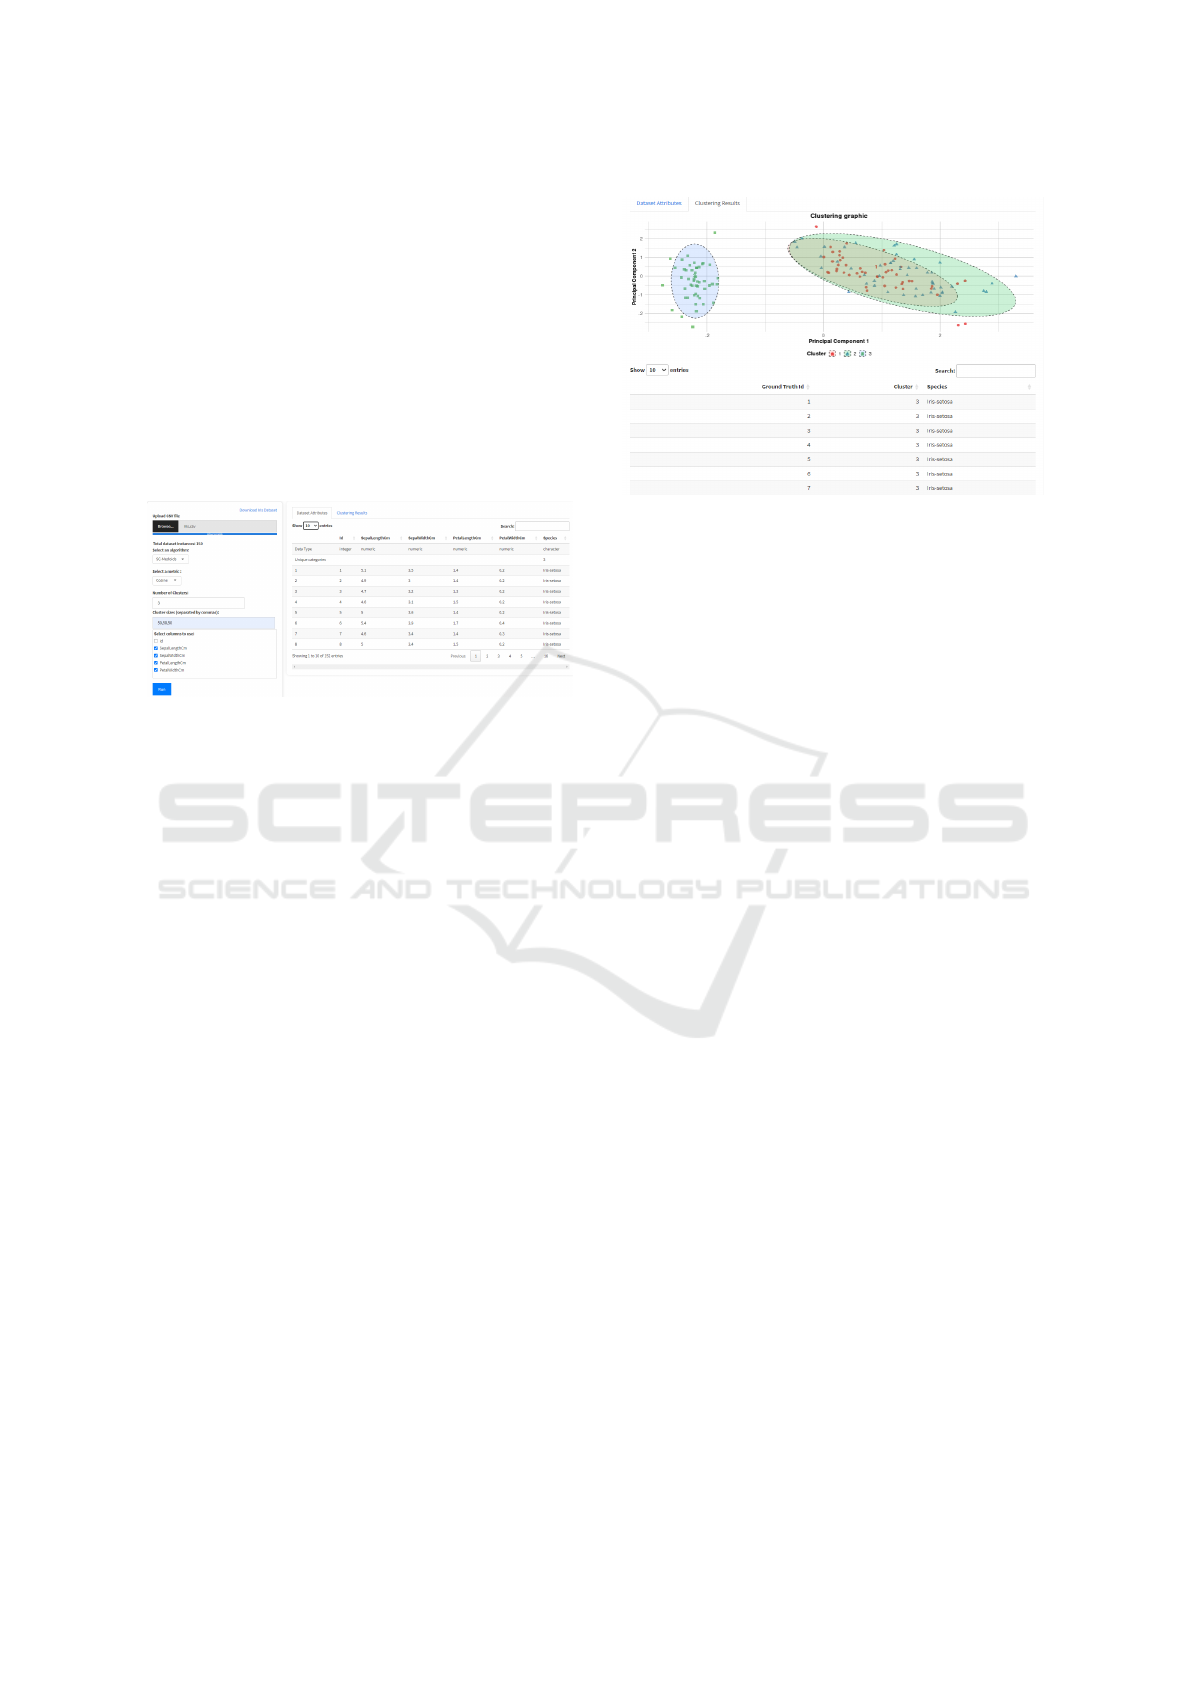
4.2 User Interface and Interaction
ClustSize operates as a single-page interface or-
ganized into clearly defined panels. As shown in Fig-
ure 2, the left-hand sidebar is dedicated to user inputs.
Here, users can upload their datasets (with common
formats such as CSV or Excel), specify clustering pa-
rameters (including the number of clusters, size con-
straints, and choice of distance metrics), and preview
dataset summaries. Tooltips and contextual help links
are embedded throughout the sidebar, providing addi-
tional guidance to ensure that configuring a clustering
run is straightforward and efficient.
Figure 2: Selecting parameters and displaying the dataset in
the UI.
Once the user has configured the desired param-
eters, ClustSize automatically initiates clustering
operations. The results are displayed on a separate
tab designated for output visualization. Figure 3 illus-
trates this results tab, which is subdivided into mul-
tiple sections. The primary visualization is a dy-
namic principal component analysis (PCA) plot that
maps clustered data into a two-dimensional space,
with clusters distinguished by color-coding and inter-
active elements such as hover-over tooltips that dis-
play detailed information regarding cluster member-
ship. In addition to the graphical output, a data ta-
ble presents the clustering results alongside the corre-
sponding ground truth labels, facilitating quantitative
assessments and further exploration of the clustering
quality.
5 EVALUATION AND TESTING
After verifying the functionality and performance of
the clustering algorithms in a controlled, local envi-
ronment, the complete web application was deployed
on Shinyapps.io. This cloud-based hosting platform
ensures immediate and broad access while provid-
ing an integrated environment for R Shiny applica-
tions. However, the inherent resource limitations (no-
tably, a 1GB RAM cap) necessitated further testing
to validate the system’s robustness under realistic us-
Figure 3: Results tab in the UI after a clustering process.
age conditions. Our testing methodology is organized
into multiple components, including clustering per-
formance, time and memory benchmarking, load test-
ing, stress testing, and usability evaluation.
5.1 Clustering Evaluation
To comprehensively assess our proposed
size-constrained clustering methods, we com-
pared CSCLP and K-MedoidsSC against conventional
clustering algorithms that do not explicitly enforce
size restrictions gainst the datasets in Table 1, focus-
ing on cluster sizes, external and internal validation
measures.
For the first evaluation, Table 3 (column ”Clus-
ter Sizes”) compares the cluster sizes obtained by
applying algorithms without explicit size restric-
tions, namely, Agglomerative Hierarchical Cluster-
ing with complete linkage (AHC) (Johnson, 1967)
and standard K-Medoids (Park and Jun, 2009), with
our proposals that enforce cluster sizes (CSCLP and
K-MedoidsSC). We use the same initial cluster points
randomly, keeping the seed. As expected, both the
AHC and standard K-Medoids algorithms fail to meet
the expected cluster sizes since they do not incor-
porate any size restrictions, whereas the proposed
CSCLP and K-MedoidsSC methods perfectly match
the ground truth cluster sizes for all the datasets.
For a broader validation, our focus was to com-
pare the clustering quality and adherence to size con-
straints (Hubert and Arabie, 1985) achieved by the
four methods analyseds. To this end, we computed
several external validation metrics—such as the Ad-
justed Rand Index (ARI), Adjusted Mutual Infor-
mation (AMI), and Normalized Mutual Information
(NMI)—as well as the silhouette coefficient S(i) to
assess internal cohesion and separation. Table 3
also summarizes these validation measures for each
dataset. The results indicate that while both methods
DATA 2025 - 14th International Conference on Data Science, Technology and Applications
486

rigorously enforce the prescribed cluster sizes, there
is variability in clustering quality across datasets. In
several cases, CSCLP exhibits higher external valida-
tion scores (with values closer to 1), suggesting better
alignment with the ground truth partitioning. Con-
versely, for a few datasets, K-MedoidsSC attains com-
petitive or even superior internal cohesion as reflected
in the silhouette coefficient.
Table 3: External and internal clustering validation indices
for OpenML datasets (column ID, see Table1). External in-
dices (ARI, AMI, and NMI) and the Silhouette Coefficient
S(i) are reported for four different clustering algorithms.
Best results in bold.
ID Algorithm #Groups
Cluster Sizes
ARI AMI NMI S(i)
1 2 3 4 5 6 7 8 9
1
AHC 3 50 74 26 0.644 0.714 0.717 0.601
K-Medoids 3 50 62 38 0.730 0.748 0.751 0.540
CSCLP 3 50 50 50 0.813 0.769 0.772 0.631
K-MedoidsSC 3 50 50 50 0.015 0.013 0.025 -0.076
2
AHC 2 801 224 0.028 0.025 0.026 0.509
K-Medoids 2 501 524 0.020 0.014 0.015 0.462
CSCLP 2 499 526 0.149 0.110 0.111 0.325
K-MedoidsSC 2 499 526 0.024 0.018 0.019 0.107
3
AHC 7 1145 301 248 40 366 2 9 0.067 0.146 0.149 0.479
K-Medoids 7 343 332 440 317 179 340160 0.312 0.470 0.472 -0.035
CSCLP 7 272 287 351 297 324 290290 0.133 0.238 0.242 0.269
K-MedoidsSC 7 272 287 351 297 324 290290 0.085 0.134 0.138 -0.206
4
AHC 6 151 25 6 27 3 2 0.285 0.353 0.378 0.718
K-Medoids 6 39 65 60 20 28 2 0.199 0.305 0.332 0.279
CSCLP 6 70 76 17 13 9 29 0.206 0.270 0.302 0.196
K-MedoidsSC 6 70 76 17 13 9 29 0.080 0.135 0.172 -0.147
5
AHC 2 44 524 0.126 0.123 0.124 0.689
K-Medoids 2 139 429 0.533 0.458 0.459 0.556
CSCLP 2 356 212 0.609 0.484 0.484 0.619
K-MedoidsSC 2 356 212 0.066 0.034 0.035 0.230
6
AHC 2 2938 60 -0.029 0.005 0.006 0.869
K-Medoids 2 1664 1334 -0.009 0.026 0.027 0.275
CSCLP 2 226 2772 0.179 0.052 0.053 -0.345
K-MedoidsSC 2 226 2772 -0.036 0.004 0.004 -0.559
7
AHC 2 3274 2 1.23e-04 -2.87e-04 2.26e-05 0.998
K-Medoids 2 1826 1450 0.001 1.25e-04 3.47e-04 0.057
CSCLP 2 1998 1278 0.004 0.001 0.001 -0.022
K-MedoidsSC 2 1998 1278 0.004 6.30e-04 8.58e-04 0.291
8
AHC 2 1868 470 0.023 0.028 0.028 0.072
K-Medoids 2 970 1368 0.004 0.003 0.003 0.075
CSCLP 2 1177 1161 0.049 0.036 0.036 0.187
K-MedoidsSC 2 1177 1161 0.010 0.007 0.008 0.049
9
AHC 2 1952 187 0.083 0.018 0.018 0.479
K-Medoids 2 1433 706 0.044 0.011 0.011 0.513
CSCLP 2 1618 521 -0.067 0.065 0.065 0.210
K-MedoidsSC 2 1618 521 0.097 0.029 0.029 0.285
10
AHC 6 2032 90 110 78 93 40 0.002 0.003 0.007 0.842
K-Medoids 6 48 738 316 1231 11 99 -0.012 0.018 0.022 -0.594
CSCLP 6 330 593 392 93 162 873 0.022 0.033 0.036 -0.067
K-MedoidsSC 6 330 593 392 93 162 873 1.22e-04 0.016 0.020 -0.275
11
AHC 2 4756 244 0.172 0.045 0.045 0.822
K-Medoids 2 2448 2552 -9.59e-05 -1.43e-04 1.35e-06 0.002
CSCLP 2 4520 480 0.294 0.121 0.121 -0.024
K-MedoidsSC 2 4520 480 0.161 0.043 0.044 0.815
12
AHC 2 5743 754 0.445 0.303 0.303 0.846
K-Medoids 2 4175 2322 0.472 0.355 0.355 0.473
CSCLP 2 1599 4898 -0.070 0.116 0.116 -0.156
K-MedoidsSC 2 1599 4898 -0.066 0.068 0.068 -0.216
13
AHC 9 30 7 5 11 42 16 14 4288 22 0.012 0.029 0.033 0.931
K-Medoids 9 567 658 647 615 379 394522 371 282 0.361 0.525 0.527 -0.056
CSCLP 9 1399 312 467 356 290549 503 185 374 0.418 0.438 0.440 0.041
K-MedoidsSC 9 1399 312 467 356 290549 503 185 374 0.095 0.161 0.164 -0.201
14
AHC 3 4242 528 1050 -0.032 0.005 0.005 0.607
K-Medoids 3 2201 25271092 -0.004 0.008 0.009 0.124
CSCLP 3 775 14443601 -0.014 0.002 0.002 0.477
K-MedoidsSC 3 775 14443601 0.041 0.017 0.017 -0.353
15
AHC 3 3087 1088 2 0.125 0.114 0.114 0.775
K-Medoids 3 1373 14991305 0.153 0.164 0.164 0.501
CSCLP 3 1307 13421528 0.166 0.168 0.169 0.522
K-MedoidsSC 3 1307 13421528 0.037 0.034 0.034 -0.095
5.2 Performance Analysis
A series of experiments were performed to com-
pare the computational efficiency of SC-Medoids and
CSCLP across the datasets in Table 1. Using both Co-
sine and Euclidean distance metrics, execution times
and peak RAM consumption were recorded (see Ta-
ble 4). In general, SC-Medoids consistently out-
performed CSCLP, particularly for medium to large
datasets. For example, while SC-Medoids processed
certain datasets in under a second, CSCLP required
several orders of magnitude more time for equivalent
tasks and, in some cases, exceeded the 1GB RAM
threshold imposed by the hosting platform. This dis-
parity underscores the suitability of SC-Medoids for
resource-limited, interactive web applications.
Table 4: Comparison of execution times and peak RAM be-
tween K-MedoidsSC and CSCLP algorithms. The “–” sym-
bol indicates tests that could not be completed due to re-
source constraints or data issues.
ID Distance Time [s] RAM Peak [MB]
K-MedoidsSC CSCLP K-MedoidsSC CSCLP
1
Cosine 0.023 0.011 233.2 239.4
Euclidean 0.028 0.018 235.4 244.5
2
Cosine 0.055 0.492 256.6 272.6
Euclidean 0.256 0.719 256.6 364.4
3
Cosine 0.642 2.04 365.8 1022.1
Euclidean 0.438 1.624 954.4 1030.9
4
Cosine 0.026 0.046 758.1 767.8
Euclidean 0.003 0.307 759.7 760.1
5
Cosine 0.049 0.077 761.1 761.5
Euclidean 0.048 0.120 774.2 762.1
6
Cosine 1.398 2.366 652.4 2084.5
Euclidean 1.425 2.386 588.4 2079.8
7
Cosine 0.644 – 535.3 –
Euclidean 0.863 – 674.6 –
8
Cosine 0.317 1.281 374.8 1126.6
Euclidean 0.320 1.220 877.3 1105.2
9
Cosine 0.350 0.945 657.2 1042.7
Euclidean 0.292 0.984 690.7 1068.8
10
Cosine 0.315 4431 914.3 1187.2
Euclidean 0.326 4606 914.5 1187.3
11
Cosine 1604 6056 1053.6 2521.8
Euclidean 1.220 6249 1044.9 2513.9
12
Cosine 2988 – 3083.1 –
Euclidean 2152 – 1857.5 –
13
Cosine 1254 32319 2048.2 2935.7
Euclidean 0.976 36437 1118.8 2932.0
14
Cosine 3.330 16729 3257.9 5688.0
Euclidean 2.956 15091 1960.6 5777.4
15
Cosine 0.851 6695 4111.9 6911.5
Euclidean 0.821 6391 4112.8 6913.3
5.3 System Load Testing
Load testing is essential to ensure that the sys-
tem works optimally under actual conditions of use
with several users connected simultaneously (Dra-
heim et al., 2006). By simulating different load sce-
narios, such as user peaks or increases in data volume,
we can identify how our system responds and where
performance problems could arise.
Using Apache JMeter, we simulated various lev-
els of concurrent user activity. Three controlled sce-
narios were configured, with 30, 50, and 70 threads
(each representing a simultaneous user) launched
with a ramp-up time of 0 seconds to generate an in-
stantaneous peak load. In each scenario, every thread
executed a single iteration—submitting a clustering
ClustSize: An Algorithmic Framework for Size-Constrained Clustering
487

request—so that the system’s response, throughput,
and error rate could be accurately recorded.
Figure 4: Load test results with different numbers of threads
(simulated concurrent users), showing accepted and failed
HTTP requests.
Figure 4 illustrates the load test results as simu-
lated by JMeter. Under a moderate load of 30 con-
current threads, the application maintained a through-
put of roughly 9.9 requests per second without any
errors. The performance improved when the load
was increased to 50 threads, reaching a throughput
of about 20.7 requests per second with only a mini-
mal error occurrence (approximately 2%). However,
when subjected to a heavier load of 70 threads, the
system’s reliability deteriorated considerably, with an
error rate climbing to 28.6%. This increase in errors
coupled with higher throughput indicates that, despite
good performance under moderate conditions, the ap-
plication approaches its stability limit under high con-
currency.
5.4 Stress Testing
Complementary to load testing, stress tests were de-
signed to evaluate the application’s resilience when
subjected to gradually increasing and sustained de-
mands (
ˇ
Cih
´
ak, 2007). Utilizing also JMeter with
an initial configuration of 10 threads and a ramp-up
period of 5 seconds, the test was executed continu-
ously in an “endless loop” mode. As thread count
increased over the course of testing (reaching up to
132 threads), the system began exhibiting instability.
We observed that the system became unstable beyond
approximately 90 concurrent threads (see Figure 5).
From this point on, persistent “503 Service Unavail-
able” errors were recorded. Even so, the system
showed acceptable tolerance up to that point. This
threshold thus represents the practical upper limit of
the application’s capacity on the Shinyapps.io free
tier.
Figure 5: Stress test results in the range of threads (88 to
111) where transitions between accepted and rejected re-
quests were found.
5.5 Usability Evaluation
In parallel with performance testing, we focus on
users’ experience (UX) and feedback when using
ClustSize. These tests record users’ behavior and
cognitive processes to understand their comfort in the
application (Aziz et al., 2021). In our case, UX was
assessed through a structured usability survey admin-
istered via Google Forms
3
to a sample of 25 users
(university students). The survey captured demo-
graphic data—including gender, age, and education
level—but, as well as detailed feedback on core us-
ability attributes, such as ease of understanding the
app, navigation efficiency, interface intuitiveness, re-
sponse time, clarity of the clustering results, and over-
all satisfaction (see Table 5). In general, the results
from the survey provided qualitative insights critical
for refining the user interface and interaction flows.
Table 5: Questions asked to measure the website’s usability
based on surveys.
ID Question
1 Select your gender.
2 Select your age.
3 Level of formal education.
4 How easy was it to understand how to use the app?
5 How would you rate the ease of navigation of the app?
6 Do you find the user interface intuitive?
7 Which of the following app features did you find confusing or
difficult to use?
8 How fast was the app’s loading time and the interface’s responses?
9 Did you experience any performance issues while using the app?
10 Was the presentation of the clustering results clear and
understandable?
11 How would you rate your overall satisfaction with the application?
12 Would you recommend this application to other users interested in
data analysis and clustering?
Figures 6, 7 and 8 present a summary of the user
responses. Figures 6 displays the demographic break-
down (gender and age), confirming a diverse group
of respondents with adequate technical proficiency.
Figures 7 shows a stacked bar chart correlating re-
spondents’ formal education with perceived ease of
use; users with higher educational backgrounds gen-
erally reported the interface as intuitive and straight-
3
https://forms.gle/14Kb1d92e4ZRNVK28
DATA 2025 - 14th International Conference on Data Science, Technology and Applications
488
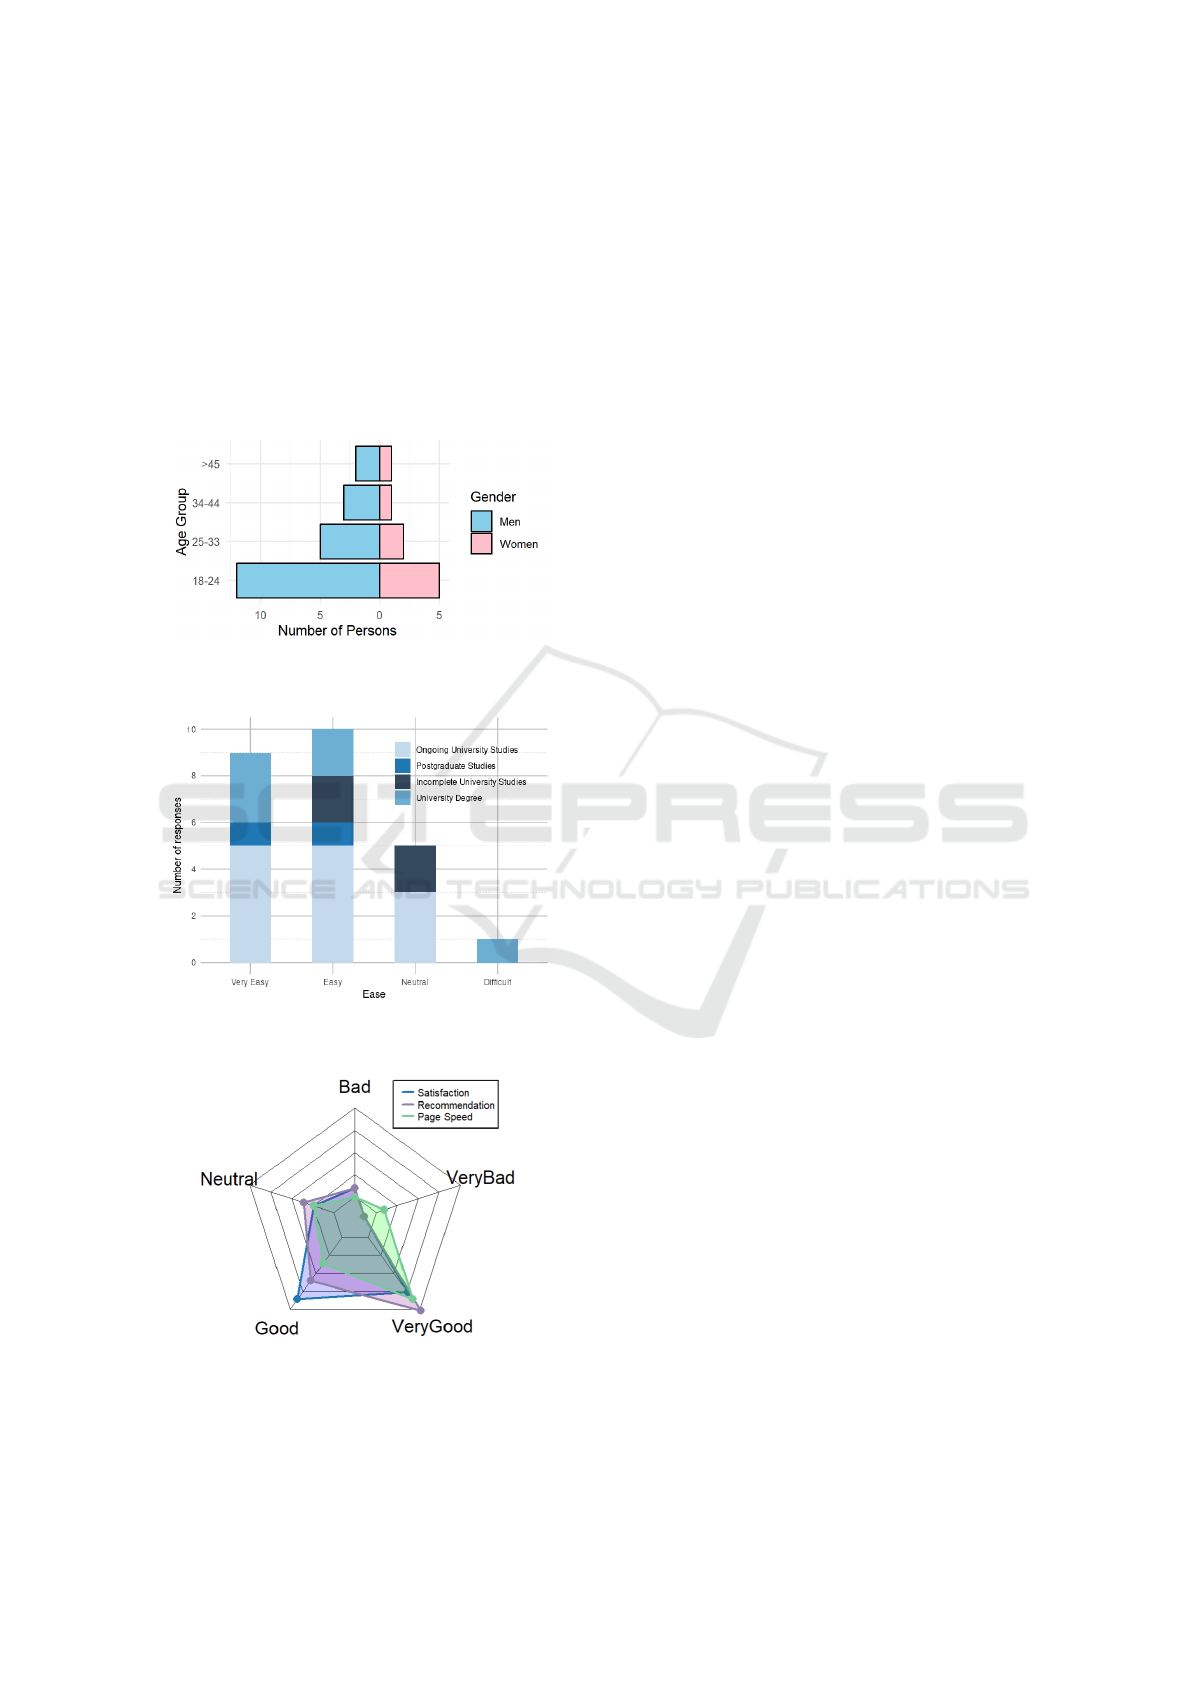
forward. Finally, Figure 8 summarizes key aspects
such as overall satisfaction, perceived response speed,
and willingness to recommend the application. The
majority of responses were positive, with most users
rating the application’s usability as “Good” or “Very
Good.” These results indicate that, despite some per-
formance limitations under extreme load conditions,
the overall user experience is robust and aligns with
the design goals of creating an accessible and interac-
tive data-analysis tool.
Figure 6: Demographic distribution of respondents by gen-
der and age range.
Figure 7: Stacked bar chart comparing respondents’ formal
education and perceived ease of use.
Figure 8: Spider graph of user perception regarding satis-
faction level, recommendation, and page speed.
6 CONCLUSIONS
In this paper, we have shown the practical viabil-
ity of integrating advanced size-constrained cluster-
ing algorithms—K-MedoidsSC and CSCLP—into a
user-friendly web application, ClustSize, built on
R Studio and the Shiny framework. The application
allows users to dynamically adjust parameters and
offers clustering visualizations, including interactive
PCA plots and detailed data tables. This empowers
users to explore complex datasets in real time while
ensuring clusters meet size requirements. Extensive
experimental evaluations confirm that K-MedoidsSC
performs more efficiently than CSCLP in terms of
execution time and memory usage, particularly on
larger datasets, making it more suitable for interac-
tive applications on resource-limited platforms such
as Shinyapps.io.
Through targeted load and stress testing, we estab-
lished that the deployed application reliably supports
up to 50 concurrent users, with performance degrada-
tion and increased error rates observed at higher con-
currency levels due primarily to the inherent limita-
tions of the hosting environment. Furthermore, us-
ability evaluations (collected via structured surveys)
highlighted robust user satisfaction regarding inter-
face clarity, navigation, and response time.
Despite these positive outcomes, several chal-
lenges remain. The 1GB RAM cap on the free
Shinyapps.io tier restricts the processing of larger
datasets, and the CSCLP algorithm, in particular, strug-
gles to operate efficiently within these constraints.
These observations underscore the necessity for fur-
ther improvements in system scalability and resource
management. Exploring solutions like server-side op-
timization, cloud-based scaling, or containerization
might alleviate these constraints in future work. Ex-
tending the tool to handle unstructured data would
further enhance its applicability across various do-
mains.
ACKNOWLEDGEMENTS
This work was supported by IDEIAGEOCA Research
Group of Universidad Polit
´
ecnica Salesiana in Quito,
Ecuador.
REFERENCES
Aziz, N. S., Sulaiman, N. S., Hassan, W. N. I. T. M., Za-
karia, N. L., and Yaacob, A. (2021). A review of web-
site measurement for website usability evaluation. In
ClustSize: An Algorithmic Framework for Size-Constrained Clustering
489

Journal of Physics: Conference Series, volume 1874,
page 012045. IOP Publishing.
Bassil, J., Makhoul, A., Piranda, B., and Bourgeois, J.
(2023). Distributed size-constrained clustering algo-
rithm for modular robot-based programmable matter.
ACM Transactions on Autonomous and Adaptive Sys-
tems, 18(1):1–21.
Beeley, C. (2016). Web application development with R us-
ing Shiny. Packt Publishing Ltd.
Bischl, B., Casalicchio, G., Feurer, M., Hutter, F., Lang,
M., Mantovani, R. G., Van Rijn, J. N., and Van-
schoren, J. (2017). Openml benchmarking suites and
the OpenML100. stat, 1050:11.
Celebi, M. E. and Aydin, K. (2016). Unsupervised learning
algorithms, volume 9. Springer.
ˇ
Cih
´
ak, M. (2007). Introduction to applied stress testing.
IMF Working Paper.
Draheim, D., Grundy, J., Hosking, J., Lutteroth, C., and We-
ber, G. (2006). Realistic load testing of web applica-
tions. In Conference on Software Maintenance and
Reengineering (CSMR’06), pages 11–pp. IEEE.
Ganganath, N., Cheng, C.-T., and Chi, K. T. (2014). Data
clustering with cluster size constraints using a mod-
ified k-means algorithm. In 2014 International Con-
ference on Cyber-Enabled Distributed Computing and
Knowledge Discovery, pages 158–161. IEEE.
Hubert, L. and Arabie, P. (1985). Comparing partitions.
Journal of classification, 2:193–218.
Jain, A. K. (2010). Data clustering: 50 years beyond k-
means. Pattern recognition letters, 31(8):651–666.
Johnson, S. C. (1967). Hierarchical clustering schemes.
Psychometrika, 32(3):241–254.
Malinen, M. I. and Fr
¨
anti, P. (2014). Balanced k-means
for clustering. In Structural, Syntactic, and Statistical
Pattern Recognition: Joint IAPR International Work-
shop, S+ SSPR 2014, Joensuu, Finland, August 20-22,
2014. Proceedings, pages 32–41. Springer.
Park, H.-S. and Jun, C.-H. (2009). A simple and fast algo-
rithm for k-medoids clustering. Expert systems with
applications, 36(2):3336–3341.
R Core Team (2024). R: A Language and Environment for
Statistical Computing. R Foundation for Statistical
Computing, Vienna, Austria.
Royce, W. W. (1987). Managing the development of large
software systems: concepts and techniques. In Pro-
ceedings of the 9th international conference on Soft-
ware Engineering, pages 328–338.
Saxena, A., Prasad, M., Gupta, A., Bharill, N., Patel, O. P.,
Tiwari, A., Er, M. J., Ding, W., and Lin, C.-T. (2017).
A review of clustering techniques and developments.
Neurocomputing, 267:664–681.
Strehl, A. and Ghosh, J. (2002). Cluster ensembles—
a knowledge reuse framework for combining multi-
ple partitions. Journal of machine learning research,
3(Dec):583–617.
Tang, W., Yang, Y., Zeng, L., and Zhan, Y. (2019). Optimiz-
ing mse for clustering with balanced size constraints.
Symmetry, 11(3):338.
Vallejo-Huanga, D., Morillo, P., and Ferri, C. (2017). Semi-
supervised clustering algorithms for grouping scien-
tific articles. Procedia Computer Science, 108:325–
334.
Vanschoren, J., Van Rijn, J. N., Bischl, B., and Torgo,
L. (2014). OpenML: networked science in machine
learning. ACM SIGKDD Explorations Newsletter,
15(2):49–60.
Wagstaff, K., Cardie, C., Rogers, S., Schr
¨
odl, S., et al.
(2001). Constrained k-means clustering with back-
ground knowledge. In Icml, volume 1, pages 577–584.
Zhang, S., Wong, H.-S., and Xie, D. (2014). Semi-
supervised clustering with pairwise and size con-
straints. In 2014 International Joint Conference on
Neural Networks (IJCNN), pages 2450–2457. IEEE.
Zhu, S., Wang, D., and Li, T. (2010). Data cluster-
ing with size constraints. Knowledge-Based Systems,
23(8):883–889.
DATA 2025 - 14th International Conference on Data Science, Technology and Applications
490
