
Metrics in Low-Code Agile Software Development: A Systematic
Literature Review
Renato Domingues
1,2 a
, Iury Monte
1 b
and Marcelo Marinho
1 c
1
Universidade Federal Rural de Pernambuco, Recife, Brazil
2
Axians Low Code Brasil, Recife, Brazil
Keywords:
Low-Code, Software Metrics, Systematic Review.
Abstract:
Low-code development has gained traction, yet the use of metrics in this context remains unclear. This study
conducts a systematic literature review to identify which metrics are most used in low-code development.
Analyzing 17 studies, we found a strong focus on Development Metrics, while Usability Metrics were under-
explored. Most studies adopted quantitative approaches and fell into the Lessons Learned category (58.8%),
suggesting an exploratory phase with little metric standardization. Future work should focus on standardizing
metrics and incorporating qualitative insights for a more comprehensive evaluation.
1 INTRODUCTION
The software industry is experiencing rapid growth,
and IT spending is expected to increase from $5.11
trillion in 2024 to $5.61 trillion in 2025 (Gartner,
2025). However, challenges such as rising complex-
ity, developer shortages, and the demand for faster
deliveries persist alongside this expansion. In ad-
dition, the need for fast deliveries without compro-
mising quality is increasingly important. Faced with
these difficulties, low-code development platforms
(LCDPs) emerged as an alternative to address these
problems. These platforms allow for the creation of
applications through visual interfaces and reusable
components, significantly reducing the need for man-
ual programming. This allows both experienced de-
velopers and users without technical training, com-
monly called citizen developers, to advance in soft-
ware development more quickly and efficiently.
Low-code development is inherently aligned with
agile methodologies, as its visual programming ap-
proach and reusable components enable rapid pro-
totyping, continuous user feedback, and incremen-
tal software delivery, reducing development time
and enhancing adaptability to changing requirements.
The benefits of using LCDPs include flexibility and
agility, fast development time, quick response to mar-
a
https://orcid.org/0009-0003-0455-609X
b
https://orcid.org/0009-0001-7966-3653
c
https://orcid.org/0000-0001-9575-8161
ket demands, reduced bug fixing, lower deployment
effort, and easier maintenance. Hence, the industry of
low-code development is gaining popularity rapidly
(Al Alamin et al., 2021). According to (Gartner,
2021) by 2025, 70% of new applications developed
by organizations will use low-code or no-code tech-
nologies, up from less than 25% in 2020.
Low-code platforms often emphasize speed and
productivity in their marketing materials. For in-
stance, OutSystems claims ”Build better apps – 10x
faster. Your stakeholders will hug you for it”
1
, while
Genio advertises ”Up to 10x faster developing new
projects with 1/10 of resources.”
2
. In both examples
we can see the mention that development is 10x faster,
but just developing faster is not necessarily enough,
other factors such as usability, security, and product
performance are equally important.
This work seeks to better understand how re-
searchers and industry members measure these fac-
tors. To do so, we reviewed the literature with the
following research question: “What metrics are de-
scribed in the literature for the agile low-code soft-
ware development process?”. The rest of this work
follows the following structure: Section 2 introduces
some concepts and related works, Section 3 talks
about the methodology applied in this work, Section
4 shows the results obtained, Section 5 brings a brief
discussion of the results, Section 6 brings threats to
1
https://www.outsystems.com/
2
https://genio.quidgest.com/?lang=en
Domingues, R., Monte, I., Marinho and M.
Metrics in Low-Code Agile Software Development: A Systematic Literature Review.
DOI: 10.5220/0013557900003964
In Proceedings of the 20th International Conference on Software Technologies (ICSOFT 2025), pages 143-154
ISBN: 978-989-758-757-3; ISSN: 2184-2833
Copyright © 2025 by Paper published under CC license (CC BY-NC-ND 4.0)
143

the validity of our work, and finally Section 7 brings
a brief reflection as well as our future works.
2 BACKGROUND
2.1 Agile
Agile methodology was introduced in 2001 by the ag-
ile manifesto (Beck et al., 2001); this methodology
aims at greater flexibility, collaboration, and speed of
delivery. Since then, agile has been increasingly used
among companies in the software development pro-
cess, according to the most recent state of agile report
(Digital.ai, 2024) 71% of respondents were already
using agile in their software development life cycle,
with SCRUM being the methodology most used by
teams and SAFe the most used at the enterprise level.
2.2 Low-Code
The term “low-code” was created by Forrester Re-
search in 2014 to describe platforms that enable soft-
ware development with minimal need for manual cod-
ing (Forrester, 2014). Unlike traditional programming
languages such as Python, Java, C, etc., which have
their source code built from a series of logical in-
structions written by a programmer, low-code plat-
forms use visual interfaces, pre-built components, and
configurable logic to minimize the amount of manual
coding. The goal is to speed up the development pro-
cess and require less team effort.
As described by (Sahay et al., 2020), a LCDP typi-
cally has four layers: application, service integration,
data integration, and deployment. In the application
layer, users interact directly with the graphical envi-
ronment to define their applications; in the service
integration layer, it is used to integrate the applica-
tion with different services, usually via APIs; in the
data integration layer, it is used to homogeneously
manipulate data from different sources; and finally,
the deployment layer is used to deploy the applica-
tion in dedicated cloud infrastructures or on-demand
environments.
According to Gartner (Gartner, 2024), low-code
platforms can be divided into four types: challengers,
niche players, visionaries, and leaders, based on their
completeness of vision and ability to execute. Some
examples of these platforms are: Mendix
3
, OutSys-
3
https://www.mendix.com/
tems
4
, Appian
5
, Oracle Apex
6
and salesforce
7
.
2.3 Related Work
The topic of low-code is relatively new compared to
other branches of technology. As mentioned, the term
was only created slightly more than 10 years ago,
but its interest has grown. Given this growth, several
studies have sought to consolidate existing knowledge
about low-code through literature reviews. These re-
views analyze the state-of-the-art, identify challenges
and trends, and provide a basis for future research.
(Rokis and Kirikova, 2023) provides a summary
of the knowledge about low-code in the literature,
covering topics such as what low-code is, its plat-
forms, application areas, benefits and challenges.
Based on a review of the literature, the authors ana-
lyzed 39 articles to group the information found, for
example, in a table that contains the benefits of low
code and which works provide this information.
(Prinz et al., 2021) conduct a literature review on
LCDPs, analyzing academic research and industry re-
ports to map the state-of-the-art. The study uses a
systematic review of the literature, reviewing 32 pub-
lications and categorizing them according to the so-
ciotechnical system model. The authors identify that
most current research is focused on the technical sys-
tem (technology and tasks), while only three studies
explicitly address the social system (organizational
structure and people).
(Bucaioni et al., 2022) perform a multi-vocal
systematic review, where they analyze both peer-
reviewed publications and gray literature studies with
the aim of providing a comprehensive view on low-
code development. In total, 58 primary studies were
analyzed and based on the results found, they framed
low-code as a set of methods and tools inserted in a
broader methodology, often associated with Model-
Driven Engineering (MDE).
(Khalajzadeh and Grundy, 2024) presents a sys-
tematic review of the literature that, at the end of the
search, backward and forward snowballing stages, an-
alyzed 38 primary studies related to the topic of low-
code and accessibility of low-code platforms. The re-
sults obtained show that despite there being some con-
cern with the topic of accessibility in low-code plat-
forms, few studies actually address this issue and even
those that do have some limitations in their approach.
(Curty et al., 2023) focuses on MDE and low-
code/no-code platforms applied to the development
4
https://www.outsystems.com/
5
https://appian.com/
6
https://apex.oracle.com/en/platform/low-code/
7
https://www.salesforce.com/
ICSOFT 2025 - 20th International Conference on Software Technologies
144

of blockchain-based applications. Through a struc-
tured literature review, the authors analyzed 177 aca-
demic publications to categorize the focuses of these
works and identified that there is a difference between
academic and industrial approaches, where academic
approaches are more conceptual and experimental,
while industrial low-code and no-code platforms are
more mature, but with less flexibility for detailed
modeling.
It is already possible to find in the literature sev-
eral studies that carry out some form of literature
review as demonstrated in the papers cited above,
some more generalized such as (Rokis and Kirikova,
2023; Prinz et al., 2021) that deal with low-code as a
whole, while others have a more specific focus on cer-
tain topics such as (Khalajzadeh and Grundy, 2024)
that addresses accessibility in a low-code context and
(Curty et al., 2023) that deals with works related to
blockchain technology. However, during our searches
we were unable to identify any work that was specif-
ically focused on metrics, so in order to address this
gap in the literature we decided to carry out this re-
view.
3 METHODOLOGY
To ensure a rigorous and reliable approach, this study
adopted the Systematic Literature Review (SLR), as
defined by (Kitchenham and Charters, 2007). This
methodology allows for the structured evaluation and
interpretation of all available research that is relevant
to a research question, thematic area, or phenomenon
of interest. Furthermore, the SLR seeks to present a
fair and impartial assessment of the topic, following a
rigorous, auditable, and reproducible methodological
process, ensuring greater transparency and reliability
in the results.
This study followed the guidelines proposed in
(Kitchenham and Charters, 2007) and consisted of
three main stages: review planning, review imple-
mentation, and review findings reporting. Each stage
was subdivided into smaller steps as shown below:
• Planning the review: (i)Recognizing the need for
a SLR; (ii) Formulating research question(s) for
the review.
• Implementing the review: (i)Performing a
search for relevant studies; (ii)Evaluating and
documenting the quality of included studies;
(iii)Categorizing the data needed to address the re-
search question(s); (iv)Extracting data from each
incorporated study.
• Reporting of review findings:(i)Summarizing
and synthesizing study findings; (ii)Interpreting
the results to determine their applicability;
(iii)Developing a comprehensive report of study
results.
With this, we sought to answer our research ques-
tion: “What metrics are described in the literature for
the agile low-code software development process?”.
To perform the search, we defined a comprehensive
search string to ensure that we would capture the
largest possible number of results: (“low code” OR
“low-code”) AND (“agile software development” OR
“agile method” OR agile OR SCRUM OR Kanban
OR Lean OR “lean software development”). We used
this string to search for articles, conferences and jour-
nals in three databases: ACM, IEEE and Springer-
Link.
3.1 Paper Selection
Our search yielded 1,369 references from 2001 to
2024, including 788 from ACM, 344 from IEEE, and
237 from SpringerLink. The paper selection process
involved two phases of filtering the results:
• Phase 1: An initial selection of papers that rea-
sonably met the inclusion and exclusion criteria
based on reading their titles, abstracts and key-
words.
• Phase 2: A more detailed selection, where the cri-
teria were applied more rigorously, and the intro-
ductions and conclusions of the initially selected
papers were read.
Following these phases, we conducted both forward
and backward snowballing on the papers accepted in
both phases. At each stage, two authors reviewed all
the material, and in case of disagreement regarding
the acceptance of a paper, a third author made the final
decision.
In Phase 1, we included studies that broadly
aligned with the inclusion criteria in Section 3.2, par-
ticularly those related to low-code development. We
focused on the titles, abstracts, and keywords during
this phase.
In Phase 2, we became more selective and only in-
cluded papers that, in addition to meeting the criteria
from Phase 1, also addressed metrics or presented a
metric related to low-code. We read each paper’s ti-
tle, abstract, keywords, introduction, and conclusion
in this phase.
3.2 Inclusion and Exclusion Criteria
For this work we defined the following criteria:
Metrics in Low-Code Agile Software Development: A Systematic Literature Review
145

We included: (i) Studies that were published in
journals and peer-reviewed conferences; (ii) Studies
directly related to the research questions; (iii) Studies
that approach research topics, such as low-code and
low-code metrics; and (iv) Studies that are available,
via the university library services, to the authors dur-
ing the time of search or available on the web.
We excluded: (i) Studies not written in English;
(ii) Documents that are books, short papers (¡=4
pages), theory papers, workshop papers, technical re-
ports, students experiments; (iii) Studies that presents
personal viewpoints or specialists opinions; and (iv)
Studies not related to Software engineering and com-
puter science.
Before accepting an article into the final set for re-
view, we checked for replication, e.g. if a given study
was published in two different journals with a differ-
ent order of lead authors, only one study would be
included in the review. In addition, we checked for
duplication, e.g. if the same article was listed in more
than one database, only one study would be included
in the review.
After defining all inclusion and exclusion criteria,
we initiated Phase 1 by reviewing the relevant sec-
tions (title, abstract and keywords) of the retrieved
studies, resulting in 109 preliminarily accepted pa-
pers. These were then evaluated more thoroughly
in Phase 2, leading to a final selection of 12 papers,
an acceptance rate of approximately 0.88%. Table 1
presents the number of studies accepted from each
search engine across both phases.
Table 1: Papers by search engine.
Engine Selection Phase 1 Phase 2
ACM 788 73(9.26%) 8(1.02%)
Springer 344 21(8.86%) 2(0.58%)
IEEE 237 15(4.36%) 2(0.84%)
Total 1369 109(7.96%) 12(0.88%)
After completing this step, we started the snow-
balling backward and snowballing forward on these
12 articles. Through backward snowballing, we iden-
tified and accepted one additional paper. Forward
snowballing yielded seven potential studies; however,
one was inaccessible, and two were excluded for be-
ing undergraduate and master’s theses, as per our ex-
clusion criteria. This resulted in four additional ac-
cepted papers from forward snowballing. In total,
these steps added five papers to our selection, lead-
ing to a final set of 17 accepted studies.
3.3 Paper Quality
The quality assessment criteria used in this study are
based on established principles and good practices for
conducting empirical research in software engineer-
ing defined by (Dyba et al., 2007). For this purpose,
we used a list of 12 questions that can be answered
with Yes, Partially and No, we assigned the values 1,
0.5 and 0 respectively, to each of these questions and
at the end we calculated the score for that study. The
12 questions used were: (i) Is there a clear definition
of the study objectives? (ii) Is there a clear defini-
tion of the justifications of the study? (iii) Is there a
theoretical background about the topics of the study?
(iv) Is there a clear definition of the research ques-
tion (RQ) and/or the hypothesis of the study? (v) Is
there an adequate description of the context in which
the research was carried out? (vi) Are used and de-
scribed appropriate data collection methods? (vii)Is
there an adequate description of the sample used and
the methods for identifying and recruiting the sample?
(viii) Is there an adequate description of the methods
used to analyze data and appropriate methods for en-
suring the data analysis were grounded in the data?
(ix) Is provided by the study clearly answer or jus-
tification about RQ / hypothesis? (x) Is provided by
the study clearly stated findings with credible results?
(xi) Is provided by the study justified conclusions?
(xii) Is provided by the study discussion about valid-
ity threats?
For our study we consider a paper as Excellent if
it obtains a score equal to or greater than 11, Good if
is between 8.5 and 11, Regular if between 6 and 8.5
and Insufficient if it is below 6.
3.4 Papers Rigor and Relevance
Our research evaluation process is based on the
rigor and relevance assessment methods proposed by
(Ivarsson and Gorschek, 2011). Rigor aspects were
assessed on a scale of 0 (‘weak’), 0.5 (‘moderate’)
and 1 (‘high’) and had three dimensions: (i) Context;
(ii) Study design; and (iii) Threats to validity.
On the other hand, industry relevance concerns the
impact a study can have on industry and academia,
considering relevant research topics and real industry
scenarios. The relevance aspect has a binary score,
1 for present and 0 for not present. The aspects are:
(i) Subjects of the study, described as the people in-
volved in the case, e.g., industry professionals; (ii)
Context in which the study was conducted, e.g., in-
dustrial settings; (iii) Scale of applications used in the
study, e.g., realistic industrial applications; (iv) Re-
search method used. The maximum Rigor value is 3
ICSOFT 2025 - 20th International Conference on Software Technologies
146
while the maximum Relevance value is 4.
3.5 Data Extraction
We examined each selected paper to extract the fol-
lowing elements: (i) Study objective or research ques-
tion; (ii) Results relevant to the study; (iii) Potential
themes emerging from the study findings.
We synthesized the data by first identifying the
indicators and their purpose. Because we assigned
equal weight to each occurrence, the frequency of oc-
currence only reflects how many articles mention a
given practice, so frequency reflects the popularity of
a topic rather than its potential importance;
We classified all included articles into one of the
research type facets derived from (Wieringa et al.,
2006). All reviewed studies were also classified using
contribution type facets derived from (Petersen et al.,
2008) .
4 RESULTS
4.1 Overview of the Papers
Table 2 presents the list of all 17 selected studies,
along with their assigned IDs, which will be used
throughout this section for easier reference.
Table 2: List of selected studies and their corresponding
IDs.
ID Reference
1 (Al Alamin et al., 2021)
2 (Martins et al., 2020)
3 (Alamin et al., 2023)
4 (Overeem et al., 2021)
5 (Domingues et al., 2024)
6 (Hagel et al., 2024)
7 (Kakkenberg et al., 2024)
8 (Varaj
˜
ao et al., 2023)
9 (Guthardt et al., 2024)
10 (Luo et al., 2021)
11 (Calc¸ada and Bernardino, 2022)
12 (Kedziora et al., 2024)
13 (Trigo et al., 2022)
14 (Sahay et al., 2023)
15 (Haputhanthrige et al., 2024)
16 (Pacheco et al., 2021)
17 (Bexiga et al., 2020)
Although we searched for articles from 2001 to
2024, in our final result we did not have any articles
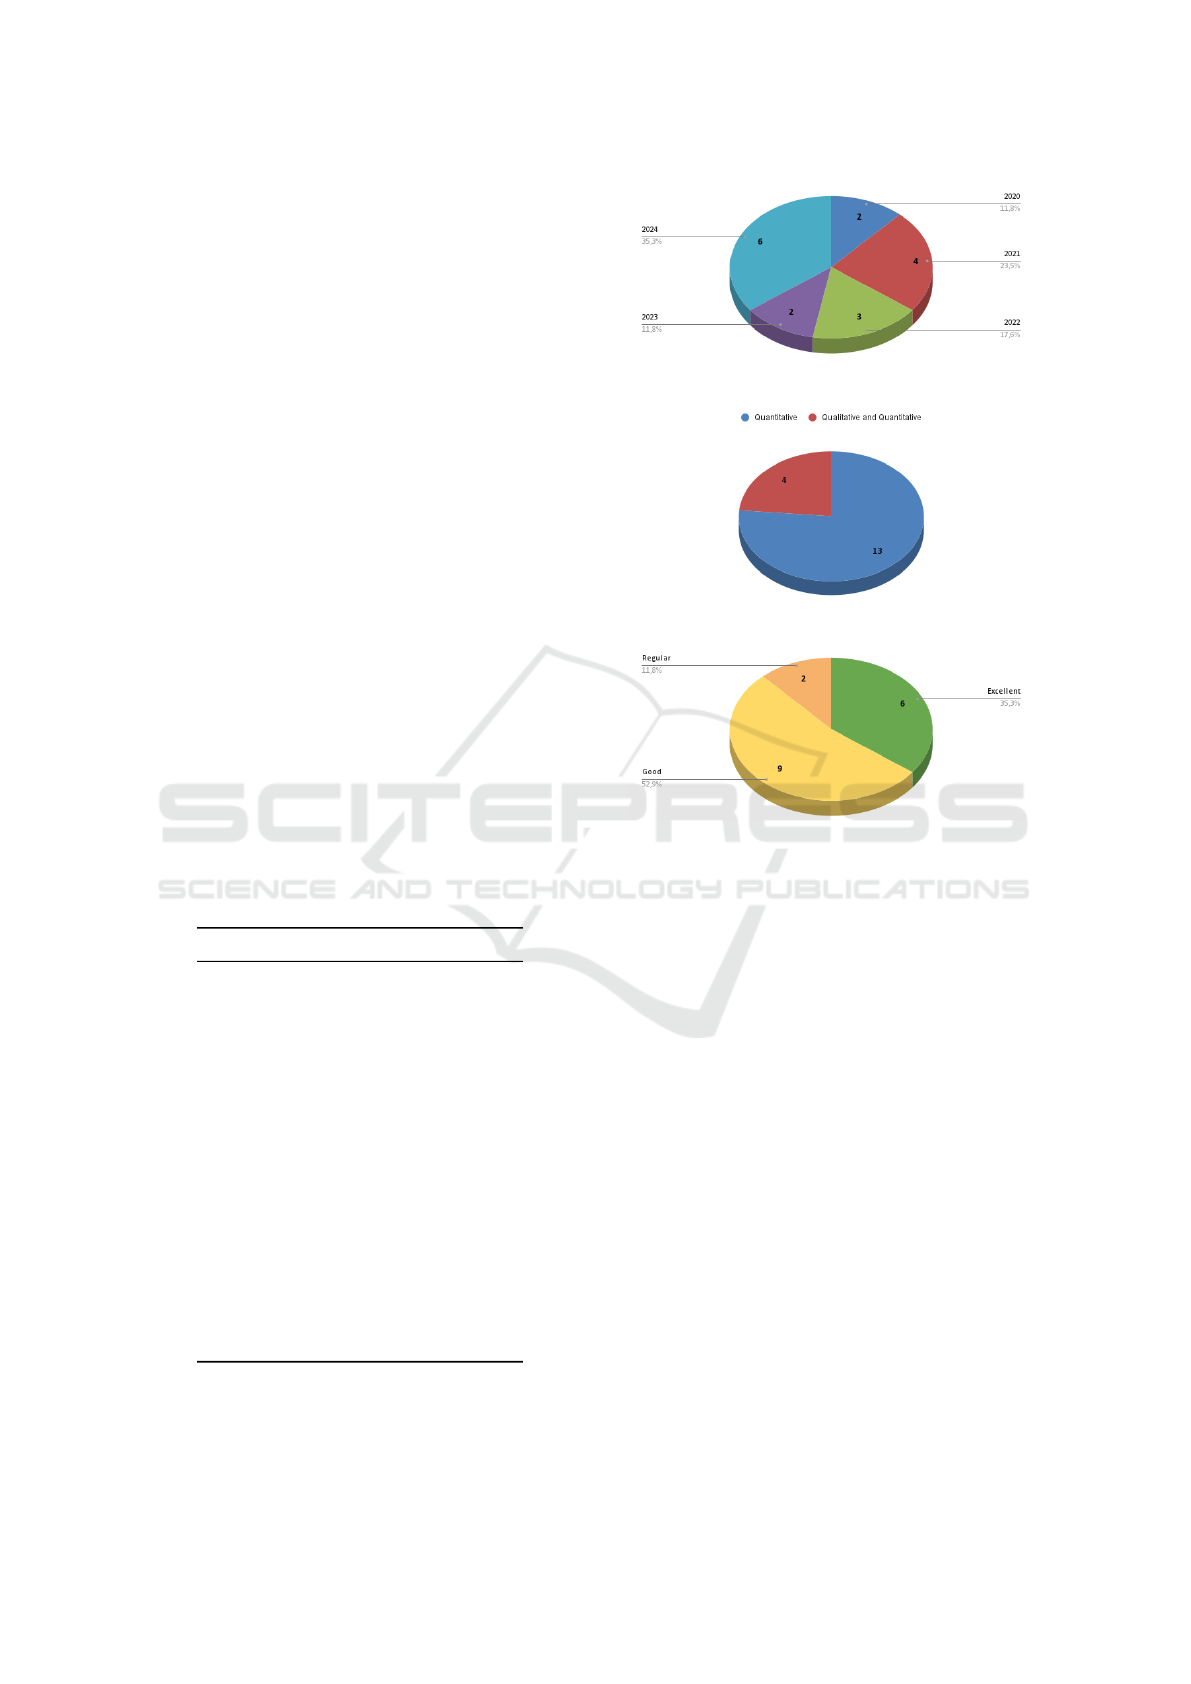
until 2019, only from 2020 to 2024. The figure 1
Figure 1: Papers distribution per year.
Figure 2: Papers study type.
Figure 3: Papers quality.
shows the distribution of papers in each year, where
we had 2 papers in 2020 and 2023, 3 in 2022, 4 in
2021 and 6 in 2024.
Regarding the type of study, as we can see in the
figure 2 we did not have any study that was only qual-
itative, however we had 4 studies that were qualitative
and quantitative and 13 that were quantitative.
The results from Section 3.3 approach are pre-
sented in Figure 3, showing the classification of the
analyzed papers. Six were rated as Excellent, nine
as Good, two as Regular, and none received a score of
Insufficient. As no work was classified as Insufficient,
none of the papers had to be discarded.
As mentioned in the Section 3.4 the papers were
classified by their rigor and relevance according to the
method of (Ivarsson and Gorschek, 2011). Figure 4
show the distribution of scores of the papers, the cap-
tion shows the number of papers with that score, in it
we can see that no paper scored below 1.5 when we
refer to Rigor, nor below 3 when we talk about rele-
vance. The Rigor value that had the highest frequency
was 3 (maximum score) with 7 papers, followed by 2
with 6 papers, 1.5 with 3 papers and 2.5 with 1 paper.
For Relevance, we had a less wide distribution with 9
papers obtaining the score 4 (maximum score) and 8
Metrics in Low-Code Agile Software Development: A Systematic Literature Review
147
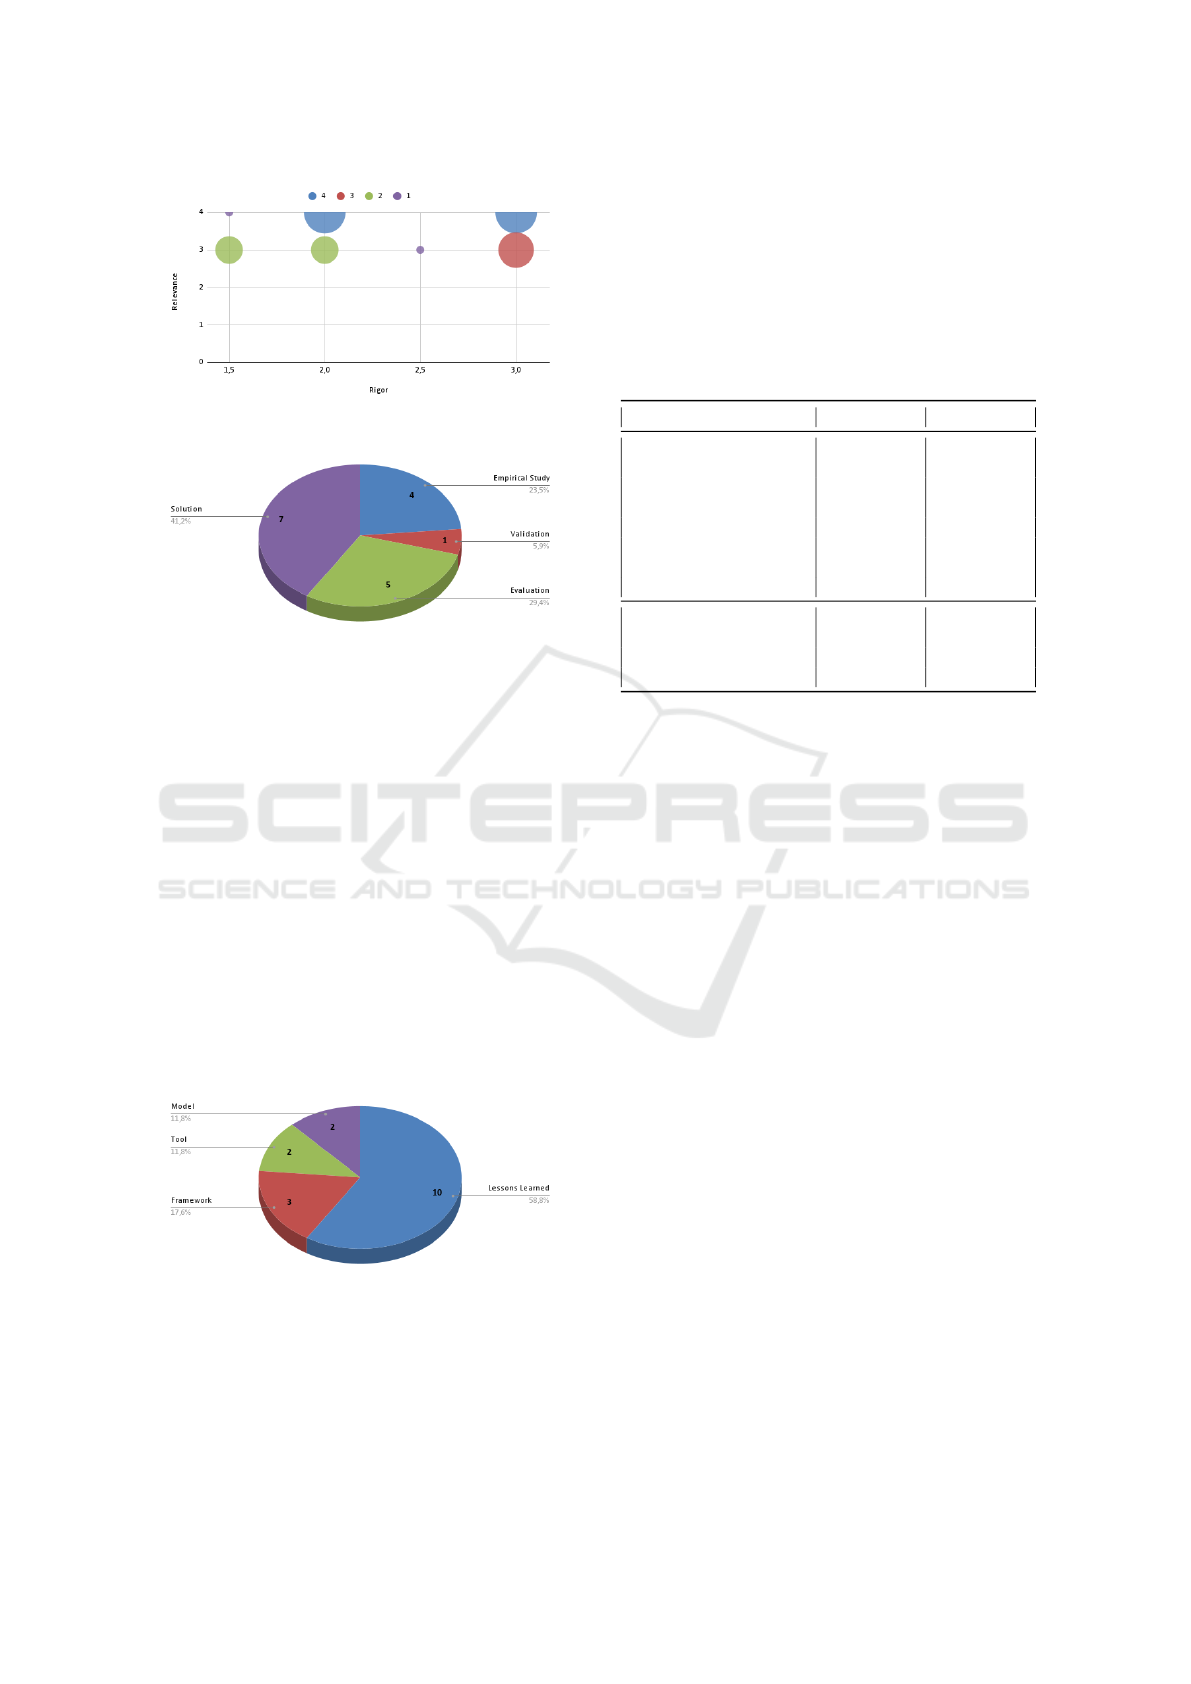
Figure 4: Papers Rigor and Relevance distribution.
Figure 5: Paper research facet distribution.
with the score 3. When we look at both dimensions
at the same time (Rigor as X and Relevance as Y) we
have a tie in the highest frequency where (2,4) and
(3,4) both have 4 papers, followed by (3,3) with 3 pa-
pers, (1.5,3) and (2,3) with 2 papers each and 1 single
paper with (2.5,3).
For the categorization of (Wieringa et al., 2006) by
the type of research facet, that was described in Sec-
tion 3.5, figure 5 shows the distribution of the results,
where the most present type was Solution with 7 pa-
pers, followed by Evaluation with 5 papers, Empirical
study with 4 and Validation with 1 paper.
And for the categorization of (Petersen et al.,
2008) by type of research contribution, the figure 6
shows that there was a predominance for the Lessons
Learned category with 10 papers, followed by Frame-
work with 3 and finally we had a tie between Tool and
Model where each of them had 2 papers.
Figure 6: Paper research contribution distribution.
4.2 Thematic Analysis of the Papers
To answer this question, we decided to group our met-
rics into two categories: Main topic and Off-topic.
The metric groups marked as Main topic are those
that help us answer our RQ, while the Off-topic, are
those that talk about low-code metrics but not specifi-
cally about the development process and therefore do
not help us with the RQ. The 3 table shows the metric
groups we defined as well as in which paper we found
it:
Table 3: Metric groups, their categories and in which paper
it was found.
Metric group Category Paper ID
Productivity Metrics Main topic 8,11,13,17,
18,20
Development Metrics Main topic 2,5,6,8,9,11,
13,17,18,20
Quality Metrics Main topic 5,8,12,13,18
Performance Metrics Main topic 8,9,11,12,13,
14
Usability Metrics Main topic 6,12
Popularity & Engage-
ment Metrics
Off-Topic 1,3,10
Model Metrics Off-Topic 7
Compliance Metrics Off-topic 4
To clarify the categorization in Table 3, we briefly
define each metric group: Productivity — metrics re-
lated to output and efficiency of development (e.g., ef-
fort, speed); Development — metrics describing the
process and activities involved in building software;
Quality — metrics assessing software correctness, re-
liability, and defect levels; Performance — metrics
evaluating system behavior under operation (e.g., ex-
ecution time, resource use); Usability — metrics re-
flecting user satisfaction and interface quality; Pop-
ularity & Engagement — metrics based on public in-
terest and discussion around low-code; Model — met-
rics focused on the structure and representation of vi-
sual models; Compliance — metrics measuring ad-
herence to platform or organizational standards.
4.2.1 RQ: What Metrics Are Described in the
Literature for the Agile Low-Code
Software Development Process?
In this subsection we will describe the metrics of each
group that we defined as Main topic: Productivity,
Development, Quality, Performance and Usability.
Productivity: The table 4 briefly shows all the
metrics found for this group.
ICSOFT 2025 - 20th International Conference on Software Technologies
148

Table 4: Productivity metrics found.
Paper ID Metric
8,13,11 Lines of code
8,13 Use case points analysis (UCPA)
8,13 Constructive Cost Model (COCOMO II)
8,13 Function point analysis
8,13 Productivity factor
17 Skill value
17 Industry skill value
18 # of pages/Time
20 New results/Old results
(Varaj
˜
ao et al., 2023) is a continuation of (Trigo
et al., 2022) made by the same authors, changing the
context in which the experiment is carried out and
therefore the metrics found were the same. Among
the metrics referenced, Use Case Points Analysis
(UCPA) and a specifically defined Productivity Fac-
tor are the only ones of this metric group effectively
employed in the study. Lines of code, the Construc-
tive Cost Model (COCOMO II), and Function Point
Analysis are mentioned solely as potential alterna-
tives, without being applied in the actual analysis.
The UCPA is used as a basis for calculating the use
case points (UCP) and by consequence the Productiv-
ity factor. In a simplified way, the Productivity factor
can be calculated from the amount of total effort di-
vided by the UCP and the result is adjusted by a qual-
ity factor, that will be better described in the Quality
topic.
The Lines of code metric does not make much
sense for our low-code context, it is traditionally used
for traditional high-code environments, but we de-
cided to add it to our list because we could find it
in 3 papers (Varaj
˜
ao et al., 2023; Trigo et al., 2022;
Calc¸ada and Bernardino, 2022), being merely cited in
papers (Varaj
˜
ao et al., 2023) and (Trigo et al., 2022),
but actually used in (Calc¸ada and Bernardino, 2022).
In the context of (Calc¸ada and Bernardino, 2022), it
makes comparisons between low-code, Java Swing
and JavaScript development; in this comparison, one
of the metrics used is the number of lines of code writ-
ten by hand.
In (Haputhanthrige et al., 2024) it was possible to
find 2 metrics, which are very similar. Originally, the
Skill Value metric is divided into three that measure
the skill of a team member at the beginning, during
and at the end of a project in a quantified way. How-
ever, for this work we decided to group them into just
one metric. The Industry Skill Value is a scale from 0
to 100, calculated based on the industry average, con-
sidering time of experience and salary. Values above
50 indicate that the person is above the industry aver-
age.
(Pacheco et al., 2021) presents a single straight-
forward productivity metric, comparing the number
of screens delivered with and without their UX/UI
solution over the same period. In contrast, (Bexiga
et al., 2020) introduces its own solution and applies it
to past projects, comparing the new results with pre-
vious ones.
Development: The table 5 briefly shows all the
metrics found for this group.
Table 5: Development metrics found.
Paper ID Metric
2,6,8,9,11,
13,18,20
Development time
8,13 Total effort
8,13 UCP
6,9 Task completion time
5,17 # of project hours
2 # of backlog items
5 A set of 6 user stories centric metrics
5 A set of 5 project board centric met-
rics
5 Development score
9 # of questions asked
9 Task success %
The Development Time metric is the most recur-
rent among all groups analyzed, being identified in
a total of eight studies (Martins et al., 2020; Hagel
et al., 2024; Varaj
˜
ao et al., 2023; Guthardt et al., 2024;
Calc¸ada and Bernardino, 2022; Trigo et al., 2022;
Pacheco et al., 2021; Bexiga et al., 2020), its high
frequency shows the popularity of this metric, which
may also suggest its importance.
As mentioned previously, papers (Varaj
˜
ao et al.,
2023) and (Trigo et al., 2022) present the same met-
rics, UCP and Total effort, which are used to calculate
the Productivity factor metric. Because the calcula-
tion involves dividing Total Effort by UCP, a lower
result indicates better performance.
Both (Hagel et al., 2024) and (Guthardt et al.,
2024) use the time required to complete a task as a
metric, but only (Guthardt et al., 2024) verifies the
success rate of these completed tasks. Another met-
ric identified in (Guthardt et al., 2024) is the number
of questions asked, which is particularly relevant in
the context of this study. In this experiment, the re-
searchers recorded the number of questions from par-
ticipants before the tests began.
The other metric that was found in more than one
paper is # of project hours, in (Haputhanthrige et al.,
2024) it is related to the Skill value metric for the dis-
tribution of tasks, where more relevant skills would
have a greater allocation of hours. In (Domingues
et al., 2024) it is one of the factors used in the cal-
Metrics in Low-Code Agile Software Development: A Systematic Literature Review
149

culation of one metrics that will be better described in
the quality topic.
In the paper (Domingues et al., 2024) we were
able to identify a total of 17 metrics, 12 of which are
development metrics and 5 of which are quality met-
rics. In the development metrics, we separated them
into three: those specific to user stories, those related
to the project board, and the development score. In the
context of this work, a score from 0 to 100% is given
for each project and team based on an evaluation; the
Development score metric is the combination of these
results. As for the sets of metrics for user stories, the
size, its size in relation to the others, the type, and the
completion of some specific text fields are observed.
For board metrics, it is observed whether the man-
agement and completion of some specific parts of the
project, such as UX/UI or the backlog, are present.
Quality: The table 6 briefly shows all the metrics
found for this group.
Table 6: Quality metrics found.
Paper ID Metric
8,13 Quality factor
18 Precision
18 Recall
12 Transaction success %
5 A set of 5 quality centric metrics
As already mentioned in the productivity topic,
the papers (Varaj
˜
ao et al., 2023) and (Trigo et al.,
2022) present a metric called Quality Factor. This
metric was initially proposed in (Trigo et al., 2022)
and considers three factors when evaluating the qual-
ity of the developed project: Mockups, Use case de-
scription and software errors. In (Varaj
˜
ao et al., 2023)
they developed this metric to consider a fourth factor,
which is the performance.
In (Pacheco et al., 2021) they developed a tool
to assist in UX/UI development, in this context they
adapted the use of two metrics, traditionally from
models, to calculate the success of the tool: Precision
and Recall. Despite using both, the one selected to
be the main factor was Precision, as it was better for
the tool to only assist when it was sure that something
was correct.
In the context of (Kedziora et al., 2024) they use
a robot as a service approach, and to calculate the
service level agreement they defined 4 metrics, 3 of
which were for Performance and 1 for Quality. The
quality metric was Transaction success %, something
that they themselves define as an uncommon thing to
do.
The third set of metrics defined in (Domingues
et al., 2024) contains 5 metrics related to quality that
cover the estimation of project issues, their accuracy,
the number of bugs, test coverage, whether what was
defined at the beginning of the sprint was fulfilled and
the team’s work capacity.
Performance: The table 7 briefly shows all the
metrics found for this group.
Table 7: Performance metrics found.
Paper ID Metric
8,11,13,14 Execution time
9,14 Resource usage
11 Runtime
12 Uptime
12 Recovery
12 Availability
Execution time was the second most mentioned
metric, seen in 4 papers (Varaj
˜
ao et al., 2023; Calc¸ada
and Bernardino, 2022; Trigo et al., 2022; Sahay et al.,
2023). This metric was generally used when they
wanted to refer to the amount of time needed to com-
plete a given task.
The Resource usage metric was presented in two
different ways. In (Guthardt et al., 2024) it is only
mentioned in the interviews conducted in this work as
a relevant metric to be implemented in their tool. In
(Sahay et al., 2023) they bring it up in the context of
BPMN and say that although BPMN models are not
completely measurable, Execution time and amount
of required memory are valid ways to measure it.
(Calc¸ada and Bernardino, 2022) in its compar-
isons of results between low-code, Java Swing and
JavaScript this work brought both Execution time and
Runtime as performance metrics.
As mentioned in the previous topic, (Kedziora
et al., 2024) brought 3 performance metrics, they are
Uptime which is the percentage of time that the ser-
vice is available, Recovery speed which is how long
it takes for the system to recover after a service inter-
ruption, and Availability which they define as the time
difference between the initial time of the request and
the time in which the request was actually initiated.
Usability: The table 8 briefly shows all the metrics
found for this group.
Table 8: Usability metrics found.
Paper ID Metric
12 Customer satisfaction
12 Customer impact
6 System Usability Scale (SUS)
For this group we found only 3 metrics, 2 of them
from (Kedziora et al., 2024) and 1 from (Hagel et al.,
2024). The ones from (Kedziora et al., 2024) are not
ICSOFT 2025 - 20th International Conference on Software Technologies
150

explicitly found in the work, they can be found im-
plicitly in the statements present in the text, for ex-
ample:”...much more valuable for customers...”, ”We
take responsibility for the impact to Customer...” and
”...as well as cost, quality, and customer experience.”.
(Hagel et al., 2024) in their approach they carried
out experiments with 18 participants, where, at the
end of each task that was performed they sent a SUS-
type questionnaire for the participants to answer about
the usability.
4.2.2 Off-Topic Metric Groups
In this subsection, the groups of metrics that were
found but do not help us to answer our RQ will be
described, they are: Popularity & Engagement, Com-
pliance and Model Metrics. Although these met-
rics do not directly contribute to answering our re-
search question, they provide context on how low-
code is being discussed and evaluated in different
domains. Understanding these broader metrics can
help researchers identify new perspectives on low-
code evaluation.
Popularity & Engagement: The table 9 briefly
shows all the metrics found for this group.
Table 9: Popularity & Engagement metrics found.
Paper ID Metric
1,3,10 Popularity of topics
1,3,10 Development questions
1,3 Difficulty of questions
1 Classification questions
The papers (Al Alamin et al., 2021), (Alamin
et al., 2023) and (Luo et al., 2021) are works that have
as a methodology to analyze and extract data from
questions that were posted on online sites. (Al Alamin
et al., 2021) and (Alamin et al., 2023) are in a sim-
ilar situation to (Varaj
˜
ao et al., 2023; Trigo et al.,
2022), where (Alamin et al., 2023) is a continua-
tion of (Al Alamin et al., 2021) with same authors,
they search on stackOverflow (SO)
8
, while (Luo et al.,
2021) searched both on SO and on reddit
9
, within red-
dit they filtered into three subreddits: “Low Code”
10
,
“No Code”
11
, and “nocodelowcode”
12
.
For Popularity of topics we find metrics such as:
number of posts, mention frequency, frequency over
time, average views and average favorites. Devel-
opment questions encompass issues such as bene-
8
https://stackoverflow.com/
9
https://www.reddit.com/
10
https://www.reddit.com/r/lowcode/
11
https://www.reddit.com/r/nocode/
12
https://www.reddit.com/r/nocodelowcode/
fits, challenges, and limitations of using low-code and
LCDPs, and distribution of issues throughout the ag-
ile life cycle. Difficulty of questions deals with met-
rics like: % of unanswered questions, time to get an
accepted answer, and % of questions with no accepted
answer. Classification questions are metrics that clas-
sify questions as number of questions per topic over
time and distribution of questions over topics.
Model: The table 10 briefly shows all the metrics
found for this group.
Table 10: Model metrics found.
Paper ID Metric
7 Model
7 Visualization
For this topic, only (Kakkenberg et al., 2024)
found metrics. In it, they develop a tool for analyzing
code architecture and define some metrics for it. We
separated the metrics found into 2 subtopics: Model,
which is for metrics that analyze the model itself, and
Visualization, which is for metrics focused on the vi-
sualization part of the model. For Model, we have
metrics such as: number of input and output depen-
dencies, number of screens and entities, file size, and
cohesion. For Visualization, we have the colors and
dimension of the graph nodes.
Compliance: The table 11 briefly shows all the
metrics found for this group.
Table 11: Compliance metrics found.
Paper ID Metric
4 A set of 20 compliance metrics
(Overeem et al., 2021) brings a study on the cover-
age of practices for 4 LCDPs (Mendix, OutSystems,
Betty Blocks
13
and Pega
14
), it divides the practices
into 6 groups: Lifeciclye management, Security, Per-
formance, Observability, Community and Commer-
cial. For Lifecycle management we have: (i) ver-
sion management (4 practices), (ii) Decoupling API
& application (4 practices) e (iii) Update notification
(4 practices); Security: (i) Authentication (3 prac-
tices),(ii) Authorization (4 practices), (iii) Threat de-
tection & protection (6 practices) and (iv) Encryption
(3 practices); Performance: (i) Resource management
(4 practices) and (ii) Traffic management (7 prac-
tices); Observability: (i) Monitoring (3 practices), (ii)
Logging (4 practices) and (iii) Analytics (5 practices);
Community: (i) Developer onboarding (4 practices),
13
https://www.bettyblocks.com/
14
https://www.pega.com/
Metrics in Low-Code Agile Software Development: A Systematic Literature Review
151

(ii) Support (3 practices), (iii) Documentation (3 prac-
tices), (iv) Community Engagement (5 practices) and
(v) Portfolio management (3 practices); Commercial:
(i) Service-level agreements (4 practices), (ii) Mone-
tization strategy (4 practices) and (iii) Account man-
agement (4 practices). This means we have coverage
of 81 practices across these 20 metrics.
5 DISCUSSION
This study aims to identify how metrics are being
used in the context of low-code software develop-
ment and which metrics appear most frequently in the
literature. Although our search covered publications
from 2001 to 2024, all relevant results were published
within the last five years, with 2024 alone account-
ing for 35.3% (Figure 1) of the selected studies. This
trend suggests a growing interest in the topic, partic-
ularly in recent years, as more researchers and practi-
tioners explore the role of metrics in low-code devel-
opment.
One notable pattern is the overwhelming reliance
on quantitative approaches, with only four studies
incorporating qualitative elements (Figure 2). This
suggests that research in this field prioritizes nu-
merical evaluation over experiential insights. This
may be partially influenced by our study’s focus on
metrics, which naturally emphasizes quantitative re-
search. However, it may also reflect a broader trend in
low-code research, where qualitative evaluations are
under explored.
The high proportion of studies categorized as
Lessons Learned (58.8%) (Figure 6) reflects a field
still in its early stages, where foundational under-
standing is prioritized over standardized practices. A
notable trend is the emphasis on productivity and de-
velopment efficiency, while usability and qualitative
assessments remain underexplored. This suggests a
research bias toward measurable outcomes rather than
user-centered evaluation.
Among the metric groups, Development Metrics
appeared most frequently, reinforcing the emphasis
on measuring effort, speed, and output in low-code
development. In contrast, Usability Metrics were the
least represented, indicating that the end-user experi-
ence may be undervalued or assumed as inherent to
low-code platforms. This imbalance highlights a po-
tential blind spot in the literature.
Another key observation is the low recurrence of
specific metrics across different studies, suggesting a
lack of standardization. Without commonly accepted
metrics, it becomes difficult to compare findings or
establish best practices. This limitation reduces the
generalizability of current research and may hinder
the integration of low-code development practices in
more structured or regulated environments.
Future research should investigate not only the
definition and validation of standardized low-code
metrics, but also how these metrics are adopted in
real-world agile environments, how they influence
team performance, and how they align with end-user
satisfaction. In particular, mixed-method approaches
could help bridge the current gap between quantita-
tive rigor and qualitative insight. Studies exploring
the organizational, cultural, and collaborative aspects
of metric adoption in low-code teams may also con-
tribute to a more holistic understanding of this field.
6 THREATS TO VALIDITY
While this study provides valuable insights into how
metrics are used in low-code software development
and that we have followed the standards of the
methodology defined in (Kitchenham and Charters,
2007), it is important to acknowledge its limitations.
Internal Validity: While we conducted a rigor-
ous paper selection process, there is always a risk of
selection bias. Our inclusion and exclusion criteria
may have led to the omission of relevant studies that
did not explicitly mention low-code metrics. Addi-
tionally, our categorization of metrics was based on
our interpretation, which could introduce classifica-
tion bias.
External Validity: Our findings are limited to
studies published in ACM, IEEE, and SpringerLink,
potentially excluding relevant research from other
sources. While our focus on peer-reviewed publica-
tions ensures academic rigor, it may underrepresent
industry best practices and informal yet valuable re-
search.
Construct Validity: This study primarily analyzes
quantitative research, which may lead to an underrep-
resentation of qualitative perspectives on how devel-
opers perceive and use metrics. Furthermore, the lack
of standardized definitions for metrics across studies
could introduce inconsistencies in the interpretation
of findings.
Reliability: Although our SLR follows established
guidelines, the inherent subjectivity in study selection
and data extraction could impact reproducibility. To
mitigate this, we adhered to a structured process, with
multiple authors reviewing the results to ensure con-
sistency.
ICSOFT 2025 - 20th International Conference on Software Technologies
152

7 CONCLUSION
This study systematically reviewed recent research on
low-code development to understand how metrics are
being applied in the software development process
and which metrics appear most frequently. Our find-
ings indicate a growing interest in the topic, with pa-
pers first appearing in 2020 and a notable increase in
2024. This trend suggests that the academic commu-
nity is starting to focus on evaluating and improving
low-code development practices.
One key observation is the predominance of quan-
titative approaches, with only a few studies incorpo-
rating qualitative elements. This reflects a strong fo-
cus on measurable aspects of low-code development,
while more subjective factors, such as developer ex-
perience and usability, remain underexplored. Addi-
tionally, the distribution of research contributions re-
veals that most studies fall into the Lessons Learned
category, suggesting that the field is still in an ex-
ploratory phase, with relatively few works proposing
practical frameworks or tools.
In terms of specific metric groups, Development
Metrics was the most frequent, reinforcing the em-
phasis on measuring efficiency and productivity in
low-code development. Usability Metrics on the other
hand, was the group with the least frequency, indi-
cating a gap in research regarding how developers
and end-users interact with low-code platforms. Sim-
ilarly, the lack of standardization in metric usage sug-
gests an opportunity for future research to establish
more consistent evaluation methods.
Despite its contributions, this study has limita-
tions, particularly regarding the underrepresentation
of qualitative research and the potential exclusion of
industry-driven studies. Future work should explore
standardized metric definitions, qualitative insights
into metric adoption, and industry best practices to
complement the findings presented here.
By addressing these gaps, future research can pro-
vide a more comprehensive understanding of low-
code metrics, ultimately contributing to more effec-
tive measurement, better tool development, and im-
proved software quality in low-code environments.
REFERENCES
Al Alamin, M. A., Malakar, S., Uddin, G., Afroz, S.,
Haider, T. B., and Iqbal, A. (2021). An empirical study
of developer discussions on low-code software devel-
opment challenges. In 2021 IEEE/ACM 18th Inter-
national Conference on Mining Software Repositories
(MSR), pages 46–57. IEEE.
Alamin, M. A. A., Uddin, G., Malakar, S., Afroz, S.,
Haider, T., and Iqbal, A. (2023). Developer discus-
sion topics on the adoption and barriers of low code
software development platforms. Empirical software
engineering, 28(1):4.
Beck, K., Beedle, M., Van Bennekum, A., Cockburn, A.,
Cunningham, W., Fowler, M., Grenning, J., High-
smith, J., Hunt, A., Jeffries, R., et al. (2001). Man-
ifesto for agile software development.
Bexiga, M., Garbatov, S., and Seco, J. C. (2020). Clos-
ing the gap between designers and developers in
a low code ecosystem. In Proceedings of the
23rd ACM/IEEE International Conference on Model
Driven Engineering Languages and Systems: Com-
panion Proceedings, pages 1–10.
Bucaioni, A., Cicchetti, A., and Ciccozzi, F. (2022). Mod-
elling in low-code development: a multi-vocal sys-
tematic review. Software and Systems Modeling,
21(5):1959–1981.
Calc¸ada, A. and Bernardino, J. (2022). Experimen-
tal evaluation of low code development, java swing
and javascript programming. In Proceedings of the
26th International Database Engineered Applications
Symposium, pages 103–112.
Curty, S., H
¨
arer, F., and Fill, H.-G. (2023). Design of
blockchain-based applications using model-driven en-
gineering and low-code/no-code platforms: a struc-
tured literature review. Software and Systems Mod-
eling, 22(6):1857–1895.
Digital.ai (2024). The 17th state of agile re-
port. https://info.digital.ai/rs/981-LQX-
968/images/RE-SA-17th-Annual-State-Of-Agile-
Report.pdf?version=0. Accessed: 2025-02-14.
Domingues, R. C., Silva, M. J., and Marinho, M. L. M.
(2024). Low-code quality metrics for agile software
development. In Proceedings of the XXIII Brazilian
Symposium on Software Quality, pages 417–425.
Dyba, T., Dingsoyr, T., and Hanssen, G. K. (2007). Ap-
plying systematic reviews to diverse study types: An
experience report. In 1st Int’l Conference on Empir-
ical Software Engineering and Measurement (ESEM)
2007., pages 225–234, Madrid, Spain. IEEE.
Forrester (2014). New development platforms
emerge for customer-facing applications.
https://www.forrester.com/report/New-Development-
Platforms-Emerge-For-CustomerFacing-
Applications/RES113411. Accessed: 2025-02-14.
Gartner (2021). Gartner says cloud will be
the centerpiece of new digital experiences.
https://www.gartner.com/en/newsroom/press-
releases/2021-11-10-gartner-says-cloud-will-be-the-
centerpiece-of-new-digital-experiences. Accessed:
2025-02-14.
Gartner (2024). Gartner magic quadrant for
enterprise low-code application platforms.
https://www.gartner.com/en/documents/5844247.
Accessed: 2025-02-14.
Gartner (2025). Gartner forecasts world-
wide it spending to grow 9.8% in 2025.
https://www.gartner.com/en/newsroom/press-
releases/2025-01-21-gartner-forecasts-worldwide-
Metrics in Low-Code Agile Software Development: A Systematic Literature Review
153

it-spending-to-grow-9-point-8-percent-in-2025.
Accessed: 2025-02-14.
Guthardt, T., Kosiol, J., and Hohlfeld, O. (2024). Low-code
vs. the developer: An empirical study on the devel-
oper experience and efficiency of a no-code platform.
In Proceedings of the ACM/IEEE 27th International
Conference on Model Driven Engineering Languages
and Systems, pages 856–865.
Hagel, N., Hili, N., and Schwab, D. (2024). Turning low-
code development platforms into true no-code with
llms. In Proceedings of the ACM/IEEE 27th Interna-
tional Conference on Model Driven Engineering Lan-
guages and Systems, pages 876–885.
Haputhanthrige, V., Asghar, I., Saleem, S., and Shamim, S.
(2024). The impact of a skill-driven model on scrum
teams in software projects: A catalyst for digital trans-
formation. Systems, 12(5):149.
Ivarsson, M. and Gorschek, T. (2011). A method for
evaluating rigor and industrial relevance of technol-
ogy evaluations. Empirical Software Engineering,
16:365–395.
Kakkenberg, R., Rukmono, S. A., Chaudron, M., Ger-
holt, W., Pinto, M., and de Oliveira, C. R. (2024).
Arvisan: an interactive tool for visualisation and anal-
ysis of low-code architecture landscapes. In Proceed-
ings of the ACM/IEEE 27th International Conference
on Model Driven Engineering Languages and Sys-
tems, pages 848–855.
Kedziora, D., Siemon, D., Elshan, E., and So
´
nta, M. (2024).
Towards stability, predictability, and quality of intelli-
gent automation services: Ecit product journey from
on-premise to as-a-service. In Proceedings of the
7th ACM/IEEE International Workshop on Software-
intensive Business, pages 15–23.
Khalajzadeh, H. and Grundy, J. (2024). Accessibility of
low-code approaches: A systematic literature review.
Information and Software Technology, page 107570.
Kitchenham, B. and Charters, S. (2007). Guidelines for per-
forming systematic literature reviews in software en-
gineering. 2.
Luo, Y., Liang, P., Wang, C., Shahin, M., and Zhan, J.
(2021). Characteristics and challenges of low-code
development: the practitioners’ perspective. In Pro-
ceedings of the 15th ACM/IEEE international sympo-
sium on empirical software engineering and measure-
ment (ESEM), pages 1–11.
Martins, R., Caldeira, F., Sa, F., Abbasi, M., and Martins,
P. (2020). An overview on how to develop a low-
code application using outsystems. In 2020 Inter-
national Conference on Smart Technologies in Com-
puting, Electrical and Electronics (ICSTCEE), pages
395–401. IEEE.
Overeem, M., Jansen, S., and Mathijssen, M. (2021). Api
management maturity of low-code development plat-
forms. In International Conference on Business Pro-
cess Modeling, Development and Support, pages 380–
394. Springer.
Pacheco, J., Garbatov, S., and Goul
˜
ao, M. (2021). Im-
proving collaboration efficiency between ux/ui de-
signers and developers in a low-code platform. In
2021 ACM/IEEE International Conference on Model
Driven Engineering Languages and Systems Compan-
ion (MODELS-C), pages 138–147. IEEE.
Petersen, K., Feldt, R., Mujtaba, S., and Mattsson, M.
(2008). Systematic mapping studies in software en-
gineering. In Proceedings of the 12th International
Conference on Evaluation and Assessment in Software
Engineering, EASE’08, page 68–77, Swindon, GBR.
BCS Learning & Development Ltd.
Prinz, N., Rentrop, C., and Huber, M. (2021). Low-code
development platforms-a literature review. In AMCIS.
Rokis, K. and Kirikova, M. (2023). Exploring low-code de-
velopment: a comprehensive literature review. Com-
plex Systems Informatics and Modeling Quarterly,
(36):68–86.
Sahay, A., Di Ruscio, D., Iovino, L., and Pierantonio, A.
(2023). Analyzing business process management ca-
pabilities of low-code development platforms. Soft-
ware: Practice and Experience, 53(4):1036–1060.
Sahay, A., Indamutsa, A., Di Ruscio, D., and Pierantonio,
A. (2020). Supporting the understanding and com-
parison of low-code development platforms. In 2020
46th Euromicro Conference on Software Engineering
and Advanced Applications (SEAA), pages 171–178.
IEEE.
Trigo, A., Varaj
˜
ao, J., and Almeida, M. (2022). Low-code
versus code-based software development: Which wins
the productivity game? It Professional, 24(5):61–68.
Varaj
˜
ao, J., Trigo, A., and Almeida, M. (2023). Low-code
development productivity: ” is winter coming” for
code-based technologies? Queue, 21(5):87–107.
Wieringa, R., Maiden, N., Mead, N., and Rolland, C.
(2006). Requirements engineering paper classification
and evaluation criteria: A proposal and a discussion.
Requir. Eng., 11:102–107.
ICSOFT 2025 - 20th International Conference on Software Technologies
154
