
A Multi-Layer Navigation Approach for Interactive Pedestrian Flow
Simulation in Digital Twins
Christoph Nellinger
a
, Jan Marius St
¨
urmer
b
and Tobias Koch
c
German Aerospace Center, Institute for the Protection of Terrestrial Infrastructures, Sankt Augustin, Germany
Keywords:
Agent-Based Modeling, Pedestrian Flow Simulation, Digital Twin, Coupling Dynamics, Co-Simulation.
Abstract:
Pedestrian flow simulation is crucial for accurately depicting daily activities and dynamics of infrastructures,
such as town halls, train stations, or airports. Current pedestrian flow models often lack the capability to
interact with environmental changes in real-time or only focus on one-directional interactions via prescribed
events. To address this limitation, we propose a hybrid approach that combines graph-based methods for
large-scale navigation with the optimal steps model for small-scale navigation and locomotion of agents. This
combination enables dynamic updates according to environmental changes provided by other simulations. We
demonstrate the effectiveness of our proposed approach in an exemplary airport architecture where pedestrian
simulation is coupled with an electrical simulation, resulting in a successful bidirectional coupling. Specifi-
cally, we consider a scenario where a saboteur agent meddles with an electrical circuit, causing a ripple effect
that impacts pedestrian behavior.
1 INTRODUCTION
In recent years, the concept of digital twins has be-
come increasingly significant across various fields,
offering a new approach to understand and interact
with complex systems. Essentially, a digital twin
serves as a virtual replica of a physical entity or sys-
tem, providing a dynamic and immersive reflection of
its real-world counterpart (Grieves, 2015). This con-
nection between the physical and digital realms has
opened up new possibilities for exploration and inno-
vation in diverse sectors with applications in health-
care, urban planning, manufacturing, and infrastruc-
ture (Thelen et al., 2022).
As pedestrian dynamics are an important part of
the operation of different infrastructures, the demand
for computationally efficient pedestrian flow simula-
tions has grown in digital twins. Understanding hu-
man behavior and their interaction with technical sys-
tems is vital for optimizing infrastructure operation.
Moreover, forecasting the impact of incidents on in-
frastructure operation is essential to evaluate contin-
gency plans and to develop concepts for infrastructure
protection.
a
https://orcid.org/0009-0004-0528-2040
b
https://orcid.org/0009-0002-1490-6607
c
https://orcid.org/0000-0003-1279-0209
Current state-of-the-art tools enable us to simulate
and analyze complex phenomena with a high level
of accuracy and detail using prescribed events im-
pacting the simulation. However, there are no tools
available that allow direct real-time bidirectional cou-
pling with other simulations and/or sensors or actua-
tors, and few works have been published on that topic.
However, pedestrian behavior is influenced by various
environmental factors, including pathway accessibil-
ity, awareness of available routes, weather conditions,
and more. Many of these factors can be effectively
modeled and predicted using established simulation
techniques. Integrating these simulations within a
comprehensive digital twin of a socio-technical sys-
tem provides deeper insights into the dynamics of
pedestrian movement.
Imagine a scenario where a pedestrian simulation
interacts with an electrical simulation to model the
connection between human movement and building
infrastructure. As an employee enters a conference
room, their presence activates an occupancy sensor,
adjusting lighting, heating, ventilation, and security
settings for energy efficiency and comfort. However,
maintenance staff or malicious actors who interact
with power boxes can disrupt the system, impacting
not only lighting but also security mechanisms and
pedestrian flow. This includes electrical door fail-
ures that can create bottlenecks and alter evacuation
Nellinger, C., Stürmer, J. M., Koch and T.
A Multi-Layer Navigation Approach for Interactive Pedestrian Flow Simulation in Digital Twins.
DOI: 10.5220/0013555700003970
In Proceedings of the 15th International Conference on Simulation and Modeling Methodologies, Technologies and Applications (SIMULTECH 2025), pages 295-304
ISBN: 978-989-758-759-7; ISSN: 2184-2841
Copyright © 2025 by Paper published under CC license (CC BY-NC-ND 4.0)
295

routes.
The tight integration between the pedestrian sim-
ulation and the electrical simulation opens up new
ways of forecasting the system’s behavior under un-
foreseen conditions. By dynamically updating the
navigation model based on environmental changes,
the digital twin ensures optimal pedestrian flow and
accessibility, contributing to the overall resilience and
operational performance of the building.
To achieve acceptable computation times, while
being able to update the navigational model through-
out the simulation, we propose a two-layer naviga-
tion model with a microscopic navigation based on a
variation of floor field cellular automata and a graph-
based macroscopic navigation similar to the works of
Kneidl et al. (2013). By cutting the floor fields based
on the rooms of the architecture at hand, we reduce
the amount of necessary computations. By dynami-
cally updating the navigation graph at run time, we
allow for reacting to environmental changes in real-
time.
This paper is structured as follows: Section 2 pro-
vides a brief overview of pedestrian simulation and
highlights studies that explore its coupling with other
simulators. Section 3 outlines the models employed
for each navigation layer and offers a detailed expla-
nation of the agent’s navigation process within the
simulation. Additionally, it describes the interaction
framework and data model used to couple simula-
tions. Section 4 presents the simulation example,
detailing the pedestrian simulation setup, including
geometry and parameter values, and introducing the
electrical simulator as the coupled counterpart. The
results of the corresponding simulation are presented
in Section 5, followed by a discussion of current lim-
itations and potential future improvements in Sec-
tion 6.
2 RELATED WORK
Previous studies incorporating agent-based pedestrian
simulation into digital twins have primarily focused
on traffic interactions (Wang et al., 2023), crowd be-
havior (White et al., 2021), and emergency evacuation
scenarios (Han et al., 2020; Umemoto et al., 2024).
These implementations often rely on fundamental
models such as cellular automata or social force mod-
els. Cellular automata represent pedestrian movement
on a discrete grid, where agents transition between
cells based on predefined local rules, making them
computationally efficient but sometimes limited in re-
alism. In contrast, social force models treat pedestri-
ans as particles influenced by attractive and repulsive
forces, capturing continuous movement dynamics and
interactions with obstacles or other agents. The opti-
mal steps model (K
¨
oster et al., 2011) bridges the gap
between social force models and cellular automata by
allowing pedestrians to move on a continuous plane
while using a floor-field-based cellular automata ap-
proach to find the optimal stepping position.
Other pedestrian movement models aim to en-
hance realism by incorporating microscopic behav-
ior and strategic decision-making. These approaches
not only refine small-scale interactions, such as steer-
ing around congestion, but also integrate high-level
path planning (Seitz and K
¨
oster, 2012; Kneidl et al.,
2013; Asano et al., 2010). Some of these models
use graph-based navigation with A*-based algorithms
(Hart et al., 1968). Such methods are widely applied
in areas like computer games, where they enable the
adaptive movement of non-player characters (Cui and
Shi, 2011).
While bidirectional coupling between pedestrian
simulation and other systems remains an underex-
plored area, a few studies have begun to investigate
this approach. One example couples the Simulation
of Urban MObility (SUMO) with the Unity3D game
engine to study the interaction between pedestri-
ans and connected vehicles (Artal-Villa and Olaverri-
Monreal, 2019). This coupling allows for real-time
interaction and provides a more dynamic understand-
ing of pedestrian behavior in relation to traffic sys-
tems. Another study builds on this by using the
CARLA-SUMO co-simulation framework, integrat-
ing it with the CAVE Automated Virtual Environ-
ment (CAVE) to allow users to interact with the sim-
ulation (Wang et al., 2023). A third study couples
SUMO (Simulation of Urban Mobility) and Vadere
with OMNeT++ to co-simulate pedestrian move-
ment alongside telecommunications network behav-
ior (Schuhb
¨
ack et al., 2019). This integration enables
an analysis of how pedestrian behavior might impact
or be impacted by communication infrastructure, al-
beit with a limitation: the use of discrete-event simu-
lation in OMNeT++ requires that the pedestrian sim-
ulation be restarted with new starting conditions for
every event-based change in the telecommunications
network, which restricts real-time coupling. Despite
these promising efforts, research in this area remains
sparse, with these three studies among the very few
addressing such bidirectional coupling.
3 METHODS
For small-scale navigation, we use the optimal steps
model (Seitz and K
¨
oster, 2012), which is based on
SIMULTECH 2025 - 15th International Conference on Simulation and Modeling Methodologies, Technologies and Applications
296

Figure 1: The black outline depicts the geometry of the
building, as extracted from the floor plan. The brown ar-
eas are target areas, added subsequently. Differently col-
ored vertices and edges describe the different steps of the
construction of the navigation graph.
the fact that pedestrians naturally move in a discrete
way, step-by-step. On the larger scale, our naviga-
tion graph cuts the underlying geometry of the build-
ing into different sections that are separated by doors.
These separate rooms serve as the natural boundaries
for the calculation of the floor fields used on the mi-
croscopic layer. This approach significantly reduces
the computational time required for computing floor
fields of pedestrian destinations. For many buildings
these structural graphs are tree-shaped, but for more
complex buildings such as train stations, airports or
town halls, these graphs can include circular features
with the possibility to cross different rooms to get to
the same destination.
To elucidate the individual steps of our approach
in detail, we utilize a simplified example geometry, il-
lustrated in Fig. 1. The geometry represents a small
building composed of four rooms with dimensions of
approximately 4.5 meters by 4 meters, and two hall-
ways of similar size (4.5 meters by 8 meters) con-
nected by doors with widths of around 1 meter. The
walls are represented by black lines, while door areas
are shaded in gray. Three of the rooms have desig-
nated target areas that function as pedestrian destina-
tions (note the three brown rectangles within the up-
per rooms in Fig. 1). Inside the bottom left hallway,
we have an entrance area, and inside the bottom right
hallway, there is an exit area, depicted as rectangles
shaded in brown.
3.1 The Optimal Steps Model
The optimal steps model combines the advantages
of different approaches to model pedestrian move-
ment, namely cellular automata and social force mod-
els. Building upon the cellular automata approach of
(K
¨
oster et al., 2011), the optimal steps model uses re-
pulsive potentials of other pedestrians and obstacles
and travel times to their target destinations to create
left door
bottom door
target area
Figure 2: Navigation fields for the different points of in-
terest, i.e. doors and target areas, within the middle-right
upper room of our test geometry from Fig. 1.
a floor field and later on chooses the optimal step for
each agent. These two phases are referred to as navi-
gation and locomotion.
3.1.1 Navigation
The floor fields are created as scalar fields represent-
ing the travel times of a wavefront traversing from a
destination through the room of the building at a cer-
tain speed that can be adjusted based on the distance
to walls and other obstacles, to which pedestrians nat-
urally try to keep a distance. Given there are no ob-
stacles on the way, the value of the floor field will lin-
early match the Euclidean distance to the destination.
The propagation of the wave can be described by the
Eikonal equation:
V (⃗x) · |
⃗
∇N (⃗x)| = 1, N(⃗x) = 0 for ⃗x ∈ Z (1)
where V (⃗x)) is the velocity field and N (⃗x) is the travel
time to position⃗x of the wave starting at target area Z.
V (⃗x) =
(
0, ⃗x ∈ E
min(1,δ
E
(⃗x) ·
1
d
c
), ⃗x ̸∈ E
(2)
E denotes the area covered by walls and obstacles and
δ
E
(⃗x) is the distance between position⃗x and the clos-
est obstacle. The wave cannot pass through walls and
obstacles and the speed of the wave linearly increases
from 0 to 1 within a certain distance d
c
from these.
If the distance is higher than d
c
, the wave travels at a
constant speed of 1.
We use the fast marching method (Sethian, 1996)
as implemented in scikit-fmm
1
to solve the Eikonal
equation and compute these floor fields efficiently.
1
scikit-fmm: the fast marching method for Python,
https://github.com/scikit-fmm/scikit-fmm
A Multi-Layer Navigation Approach for Interactive Pedestrian Flow Simulation in Digital Twins
297
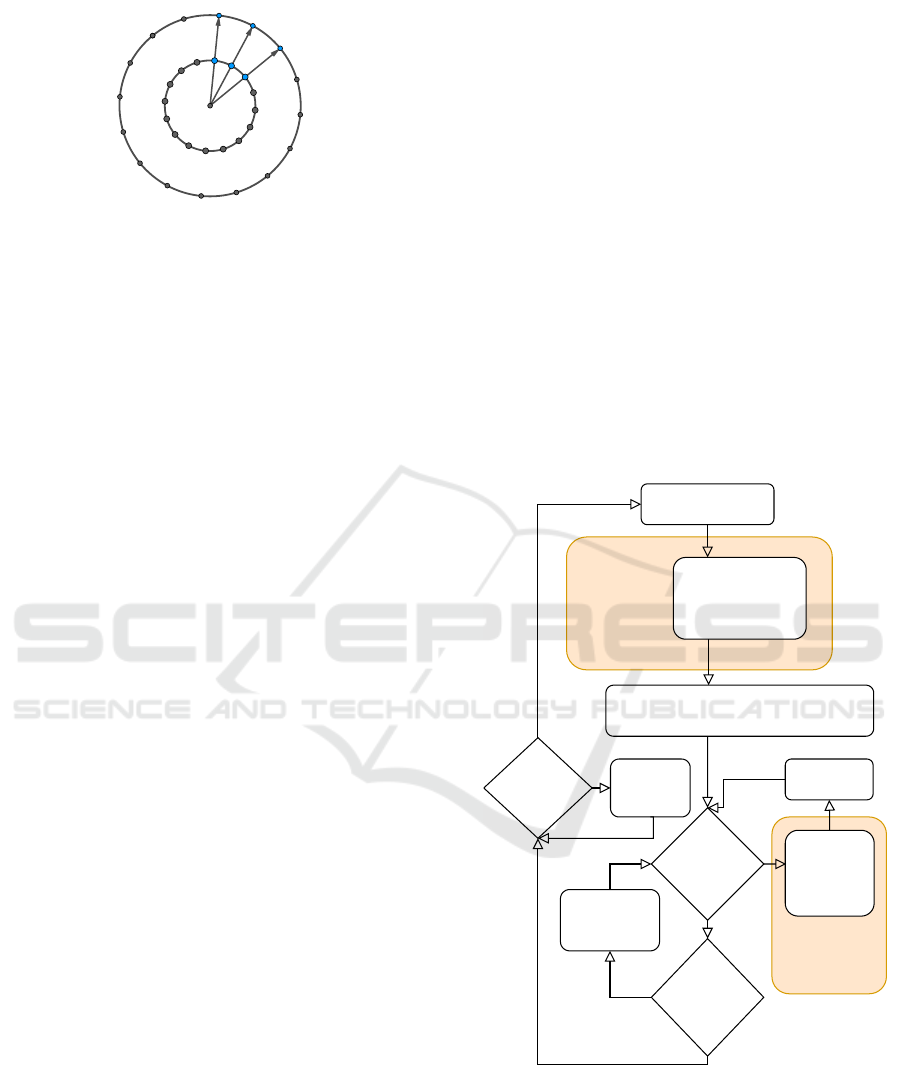
Figure 3: Discretization of the circles reflected by points.
The three arrows represent six possible positions for the
next step.
The set of three floor fields, two for the doors, one for
the target area, within the middle-right upper room is
shown in Fig. 2.
3.1.2 Locomotion
To find the optimal next step, the repulsive potential
of agents in close proximity are considered in addition
to the value of the floor field.
P
l
(⃗x) = P
t
(⃗x) +
n
∑
i=1,i̸=l
P
p,i
(⃗x) +
m
∑
j=1
P
o, j
(⃗x) (3)
P
t
(⃗x) is the attractive potential of the target t evalu-
ated at position ⃗x. P
p,i
(⃗x) is the repulsive potential
of pedestrian i and P
o, j
(⃗x) the repulsive potential of
obstacle j, affecting a pedestrian at position ⃗x.
In contrast to a cellular automaton, this model
uses local optimization on one or more circles around
each pedestrian, taking into account a discrete number
of positions (as shown in Fig. 3), while maintaining
movement on a continuous plane by shifting the ori-
entation of the circle between steps. −P is evaluated
as a utility function on positions along the discretized
circle and the original starting position to determine
the optimal next step. In our implementation we use
two circles representing a large step and a small step
(half-distance) and evaluate a total of 32 different po-
sitions per step.
3.2 The Navigation Graph
The construction process of the navigation graph is di-
vided into three steps. First, we generate a floor graph
consisting of the rooms and doors of the building as
vertices. An edge between a door-vertex and a room-
vertex exists exactly when the door is part of one of
the boundary walls of the corresponding room. This is
the case when a room has a door to the system bound-
ary or the door connects two rooms with each other.
This graph can be obtained from the building’s ge-
ometry, for example, by using computer vision tech-
niques on existing floor plans. This way we obtain the
red graph in Fig. 1.
Second, we add vertices and edges that represent
areas in which pedestrians take part in certain pro-
cesses, such as queuing up for a ticket purchase or sit-
ting down waiting for a train to arrive. Each of these
areas is represented by a vertex as they are possible
destinations for pedestrians. We then add an edge be-
tween these vertices and the room-vertex representing
the room they are located in. These are the blue dotted
edges in Fig. 1.
Finally, we remove all the vertices representing a
room and add edges between each pair of each of their
neighbors since those are arbitrarily set and not imme-
diately relevant for the navigation of the pedestrians.
We end up with a graph whose vertices are either pos-
sible pedestrians’ destinations or doors they have to
pass through to navigate between destinations.
In our example, this is the graph consisting of
the orange and blue vertices connected by the green
dashed edges. As edge weights of our graph, we use
the travel times used in the optimal steps model.
Macroscopic
Navigation
Layer
Agent gets new target
Yes
Reached
current
target?
Step to next
position
No
Are there
more intermediate
targets?
Remove current
target from list of
intermediate
targets
Find optimal
next position
(Optimal Steps
Model)
List of intermediate
targets (doors) is
loaded (shortest path in
navigation graph)
Start navigation towards
current target (first intermediate target)
Yes
Participate in
process
Yes
No
Target area
process
completed?
Microscopic
Navigation
Layer
No
Figure 4: This flowchart diagram illustrates the complete
navigation process of an agent, from target assignment to
the calculation and execution of individual movement steps.
The two layers of navigation are highlighted in orange
boxes.
SIMULTECH 2025 - 15th International Conference on Simulation and Modeling Methodologies, Technologies and Applications
298

3.3 Pedestrian Routing
The model uses a destination-based routing, i.e.,
when an agent is created within the simulation, they
are assigned a target area. Agents proceed to navigate
towards this target until they reach it. Once the agent
reaches their destination, they might spend a certain
amount of time there, taking part in a process associ-
ated with the type of target area. Agents move freely
inside the target area for the duration of the task. De-
pending on the target area and the associated task, a
speed reduction factor is applied.
Examples of this are spending time buying a ticket
at a ticket counter, performing a certain task at a work
station, walking around in a small shop inside a pub-
lic building or sitting down in a waiting area. Upon
completing their task, at a target area the target will
assign another target area to the agent.
In our simulation, we assign new targets with a
certain probability, which might be derived from an-
alyzing pedestrian data from the modeled building or
selected by using expert knowledge. Once assigned
a new target, the navigation algorithm calculates a
shortest path towards the next target based on the nav-
igation graph and assigns intermediate targets, which
are the doors that have to be passed through. For the
shortest path calculation, the A* search algorithm is
used.
Fig. 4 illustrates the basic navigation approach.
The route choice of a pedestrian is determined at the
time of target assignment. Thus, changes in the nav-
igation graph during the travel time to this target will
not lead to an immediate rerouting. If an agent tries to
pass through a door that has been locked, the area will
trigger a recalculation of the path towards the target.
This recalculation takes into account the new state of
the navigation graph and works for an arbitrary po-
sition on the plane as the starting position, in order
to be able to trigger the rerouting from any position.
This is important if we want to portray events like
an emergency protocol in a public building where an
announcement through speakers to leave the building
immediately is made, leading to a rerouting of pedes-
trians from their current position.
The basic idea of how to use the navigation graph
to reroute from an arbitrary position is to add the po-
sition as a temporal vertex to the navigation graph
with edges connecting it to all doors of the current
room. The edge weights are the values of the floor
fields of those doors evaluated at the position of the
agent. Shortest path calculation is then performed on
this temporal graph to determine the new list of inter-
mediate targets. If there is no way to reach the cur-
rently assigned target anymore, a new target will be
assigned. Target choice naturally depends on the use
case for this scenario.
Another possibility of consecutive target assign-
ment for our simulation is giving the agent a full list
of consecutive targets, either at generation or at cer-
tain targets in the building. This is used if there is
a process consisting of different sub-processes in dif-
ferent areas, such as the security scan at an airport, or
if the order of processes an agent will take part in is
already known before the simulation.
3.4 The Data Model and Interaction
Framework
The interaction among simulators is enabled through
a shared data source, structured around a comprehen-
sive and extensible data model as proposed by Franke
et al. (2023). This model is designed to represent indi-
vidual components, such as walls, obstacles, pedestri-
ans, pedestrian target areas and others. Each compo-
nent is characterized by a set of attributes relevant to
its function within the simulations. Some attributes,
such as a Universally Unique Identifier (UUID) or
the position and rotation of the component, are avail-
able in all components. In addition, some compo-
nents define special attributes, such as the velocity
and destination of pedestrians, or the length and cur-
rent flow of power cables. Communication between
simulators is implemented using an NGSI-LD (Next
Generation Service Interface-Linked Data) informa-
tion model, managed through a FIWARE Orion
2
con-
text broker. This approach ensures standardized and
efficient data exchange.
Each simulation running simultaneously sub-
scribes to the components actively involved in its pro-
cesses. In the case of the pedestrian simulation, the
subscribed components include individual pedestri-
ans, pedestrian target areas, doors, and the power fuse.
The subscription synchronizes the state of these com-
ponents between the internal data model of the pedes-
trian simulation and the shared data source.
Fig. 5 illustrates the software architecture used to
couple the pedestrian simulation with a generic sim-
ulation of a system that interacts bidirectionally with
pedestrian flows.
4 SIMULATION EXAMPLE
In order to demonstrate the capabilities of our model,
we examine a scenario in which a saboteur disrupts
2
FIWARE Orion: https://github.com/telefonicaid/
fiware-orion
A Multi-Layer Navigation Approach for Interactive Pedestrian Flow Simulation in Digital Twins
299
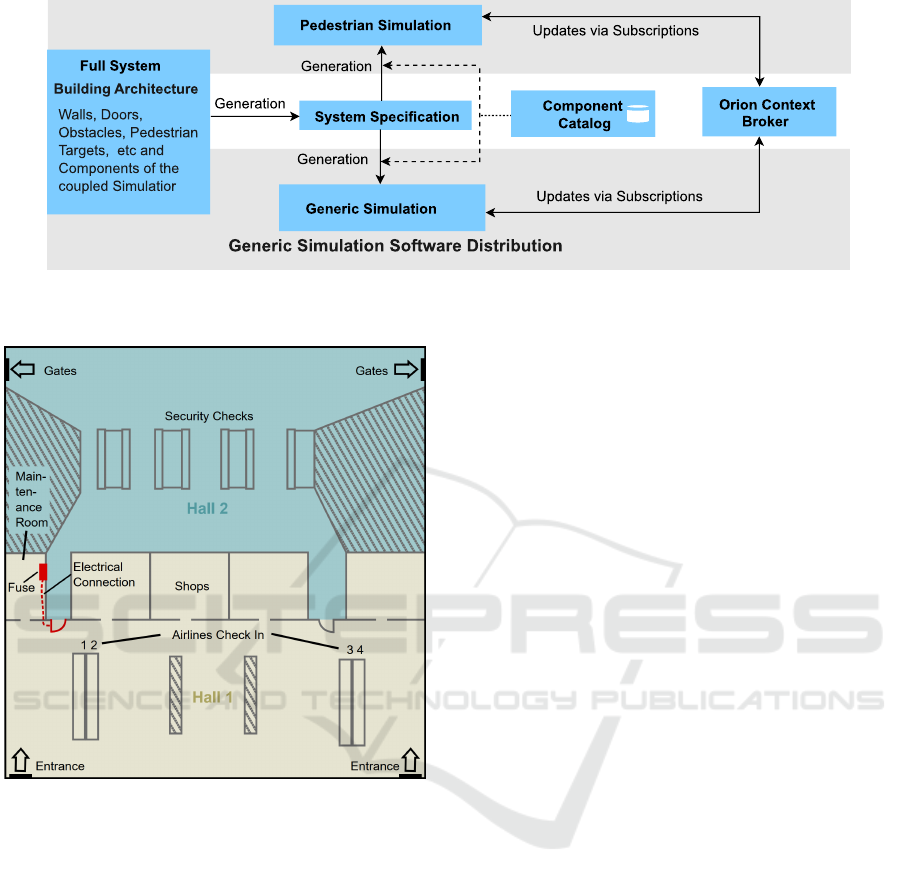
Figure 5: This diagram illustrates the coupling process between the electrical simulation software and the pedestrian stream
simulation. The FIWARE Orion Context Broker synchronizes the associated data models.
Figure 6: This labeled floor plan illustrates the airport archi-
tecture used in our simulation example, marking all relevant
stations in the agent’s navigation process. The red line rep-
resents the electrical circuit which connects the fuse in the
maintenance room with the electrical door.
airport operations by removing a fuse. This scenario,
previously used as an example in the introduction,
serves as a test case for our approach. To simulate
this event, we couple our pedestrian simulation with
an electrical simulation using the interaction frame-
work described in Section 3.4. The pedestrian simu-
lation captures the movement dynamics of individu-
als within the airport, while the electrical simulation
models the resulting system failure. The electrical
simulation is introduced in detail in a dedicated sub-
section at the end of this section.
Fig. 6 depicts the simplified airport departure ter-
minal architecture that is used as input to the simula-
tion. The architecture consists of two connected halls.
Hall 1 includes entrances, check-in counters, several
shops, and a maintenance room. Hall 2 contains the
security check area and exits leading to the gates. The
two halls are linked by two doors, one on the left side
and the other on the right side. The electrical mo-
tors at the doors leading from Hall 1 to Hall 2 are
connected to a fuse box within the target area of the
maintenance room. However, the left door and the
right door are connected to separate fuses.
Thirty minutes of airport operation are simulated
in real-time with one simulation step executed ev-
ery 0.2 seconds. Pedestrians are generated at the en-
trances based on a normal distribution that reflects the
expected departure times of their flights (parameters
are provided in Table 1). Each airline has four associ-
ated check-in counters, and passengers select one of
them as their target with equal probability. Agents
are modeled as circles of radius 25cm (Weidmann,
1993). Upon entering, each pedestrian proceeds to
a check-in counter associated with their flight, where
they queue for processing. The check-in process is
represented by a waiting time at the check-in counter.
After completing check-in, they walk to the security
check area and queue for one of the available security
check lines. The security check process consists of
three steps: (1) depositing hand luggage for scanning,
(2) undergoing a personal scan, and (3) retrieving
their hand luggage. Processing times are assumed to
be normally distributed (Schultz, 2010). The param-
eters for the distributions associated with the target
areas are given in Table 2. Once processed, pedestri-
ans move towards the designated exit associated with
their flight’s gate and are removed from the simula-
tion.
At a randomly determined time during the simu-
lation, drawn from a normal distribution with a mean
of 900 seconds and a standard deviation of 300 sec-
onds, an agent of type Saboteur is introduced. This
agent proceeds to the maintenance room in Hall 1 and
activates the target area connected to the fuse box.
The activation of the area represents the removal of
SIMULTECH 2025 - 15th International Conference on Simulation and Modeling Methodologies, Technologies and Applications
300
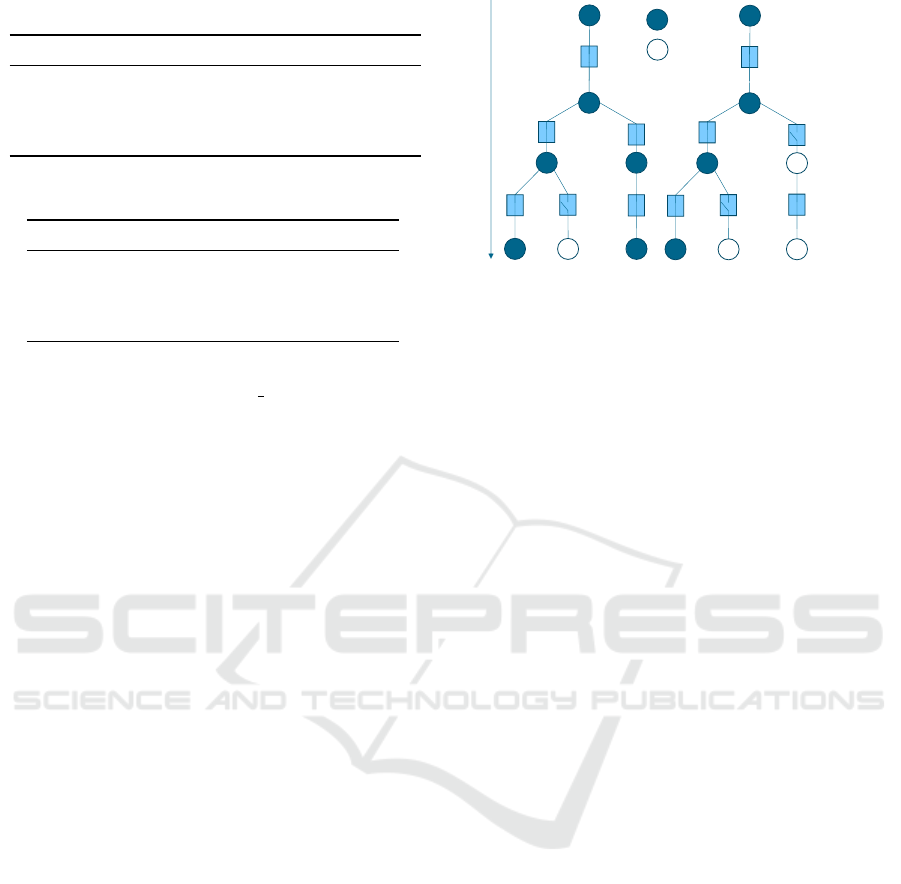
Table 1: Agent creation parameters.
Flight Agents Mean Std. Dev. Color
Lufthansa 20 300 s 300 s cyan
Eurowings 20 800 s 300 s purple
Air Lingus 20 1200 s 300 s green
Ryanair 20 1500 s 300 s yellow
Table 2: Waiting times at process steps.
Target Area Mean Time Std. Dev.
Check-In Counters 40 s 5 s
Luggage Deposit 25 s 6 s
Security Scan 20 s 5 s
Luggage Withdrawal 30 s 8 s
the fuse. This event triggers the electrical simulation,
which recalculates the working status of all compo-
nents within the affected power circuit. Here, the
switching of the fuse deactivates the motor opening
the left door between Hall 1 and Hall 2 (marked in
red in Fig. 6). Consequently, the left door becomes
unavailable, and remains closed.
The unavailability of the left door prompts the
pedestrian simulation to dynamically recalculate the
shortest paths for all affected agents. Pedestrians orig-
inally planning to use the left door are rerouted to al-
ternative paths, ensuring continuity in the simulation
despite the disruption. The simulation is run 20 times
to compensate for the influence of random variables.
4.1 Electrical Simulation Model
The electrical simulation model is designed to model
the logical behavior of a power circuit, capturing
whether components are turned on or off. The model
represents the circuit as a tree-like graph, where nodes
(components) are connected by edges (electrical con-
nections). Three key statuses define the state of each
node in the simulation:
• Power Status: Indicates whether a node receives
power, which is determined by its parent node’s
operational status and power supply.
• Switch Status: Determines whether an external
switch is turned on or off, controlling the flow of
power to the node.
• Working Status: Reflects whether a node is ac-
tively functioning, combining the power status
and switch status using logical conjunction.
The simplistic simulation model dynamically re-
calculates the statuses of all subsequent components
in response to changes in switch or main power sup-
ply states. This ensures that the system accurately re-
flects the operational conditions of the power circuit.
on
off
fuse switch
door motor
(a) before sabotage
(b) after sabotage
Figure 7: Example of a hierarchically structured electrical
circuit as created in the simulation showing the correspond-
ing states before (a) and after (b) the sabotage.
The electric system used in our demonstration
setup and the corresponding states before (a) and af-
ter (b) the sabotage are shown in Fig. 7. The sabo-
teur entering the target area triggers a fuse on the right
tree side, leading to a state change of the right system
branch. Thus, the fuse switch cuts the power supply
of the door motor, leaving the door out of service.
5 RESULTS
The output of the simulation provides a detailed rep-
resentation of the agents’ states throughout the en-
tire simulation time span, including time (frame), x-
coordinate, y-coordinate, viewing direction (angle),
absolute velocity V, velocity in x-direction Vx, and
velocity in y-direction Vy. A visual representation of
this spatio-temporal data is shown in Fig. 8.
The simulation progresses through two distinct
phases: before the manipulation of the fuse (Phase 1,
Fig. 8a), and after the fuse has been removed (Phase
2, Fig. 8b). During Phase 1, pedestrian movement
remains undisturbed, with the left door fully opera-
tional. The Saboteur enters the simulation after 754
seconds and walks directly towards the maintenance
room. In Phase 2, after the saboteur agent removed
the fuse, the electrical simulation updates the power
circuit states, marking the left door as non-functional.
This update is promptly communicated back to the
pedestrian simulation, leading to a re-evaluation of
the navigation graph. As a result, all pedestrians adapt
their routes to avoid the affected area, as evidenced by
the trajectory data presented in Fig. 8b. The number
of agents traversing each door is listed in Table 3, fur-
ther quantifying the impact of the event on pedestrian
flow. While during the first phase no agents checking
in at the left check-in counters pass through the right
door, passenger paths are altered during the second
A Multi-Layer Navigation Approach for Interactive Pedestrian Flow Simulation in Digital Twins
301

Table 3: Number of agents traversing each of the doors by
time.
Time Interval Door1 Door2
0s - 983 s 20 6
983 s -1800 s 0 46
Table 4: Duration of upstream and downstream communi-
cation.
Interval Min Max Average
upstream 16 ms 24 ms 21 ms
downstream 24 ms 27 ms 25 ms
phase.
To assess the efficiency of the bidirectional com-
munication between the pedestrian and electrical sim-
ulations, we measured the time delay between the
agent removing the fuse and the pedestrian simulation
receiving the updated status of the electrical door.
The total communication delay consists of two
components: Upstream, i.e., the time needed to
pass the information of the fuse removal from the
pedestrian simulation to the electrical simulation, and
downstream, i.e., the time between the reception of
the information in the electrical simulation and the
corresponding update of component attributes of the
electrical door in the pedestrian simulation. The cor-
responding times were tracked using the logs of the
context broker. Measurements across the 20 runs are
shown in Table 4.
Additionally, the duration of each simulation
phase was recorded: Phase 1 lasted an average of
1124 seconds, reflecting the normal distribution of the
saboteur’s creation time (mean = 900 s) plus the time
the saboteur needed to reach the power box (average
227 s), while Phase 2 averaged 676 seconds accord-
ingly.
These results demonstrate the responsiveness of
the integrated simulation framework and confirm the
successful integration of the pedestrian flow simula-
tion with the electrical simulation, allowing real-time
interaction between the two domains.
6 DISCUSSION
In this work, a novel multi-layer navigation model has
been proposed. We leverage the advantages of agent-
based modeling to portray the complex behavior of
individuals, while reducing the necessary computa-
tions to achieve a suitable framework for live coupling
with other simulators within digital twins of socio-
technical systems. The results of our simulation sug-
gest a promising representation of pedestrian behav-
ior and their interaction with technical infrastructure
features within a building environment.
We did not conduct any experimental studies to
validate our agents’ behavior. However, scientific val-
idation of the underlying model has been performed
by von Sivers and K
¨
oster (2015). By expanding these
validated models to include dynamic environmental
updates, we aim to provide a more comprehensive
simulation for studying pedestrian dynamics in com-
plex buildings.
Moreover, our model allows direct real-time cou-
pling between different simulation models, as it is
not based on a predefined event tree like other state-
of-the-art implementations of pedestrian flow simula-
tions, such as Vadere (Kleinmeier et al., 2019).
Additionally, the navigation model employed
within the pedestrian simulation proves advanta-
geous for such interactions, enabling efficient and dy-
namic path recalculations in response to environmen-
tal changes. As shown in the output trajectories, our
model successfully integrates temporal variations in
the environment, such as the locking of a door result-
ing in the temporary inaccessibility of a pathway.
In our current implementation, agents are rerouted
by interacting with the door. However, multiple
pedestrians walking toward the same locked door,
each trying to open it before choosing a new path to-
ward their target, is not realistic behavior. Instead,
the implementation can be improved by allowing one
pedestrian to attempt to open the door and triggering
the rerouting of all pedestrians steering toward this
door who are either in a certain proximity or within
the same room. Different methods of modeling the
available information about the accessibility of tar-
get areas and passages might be applied depending
on the use case. How pedestrians share information
about which passages are open and other navigation-
related details varies greatly depending on the specific
use case and is a topic that requires further research.
Another issue with our current implementation is
that agents sometimes overstep into a locked door be-
fore realizing it is inaccessible, which leads to prob-
lems. This issue can be attributed to the fact that the
navigation field of a door spans both adjacent rooms.
To mitigate this problem in the future, we propose re-
placing single nodes for doors in the navigation graph
with two nodes: one representing each room that the
door connects. By doing so, we will introduce two
separate navigation fields per door. As a consequence,
inaccessibility can be represented by removing the
edge between these two nodes rather than the nodes
SIMULTECH 2025 - 15th International Conference on Simulation and Modeling Methodologies, Technologies and Applications
302
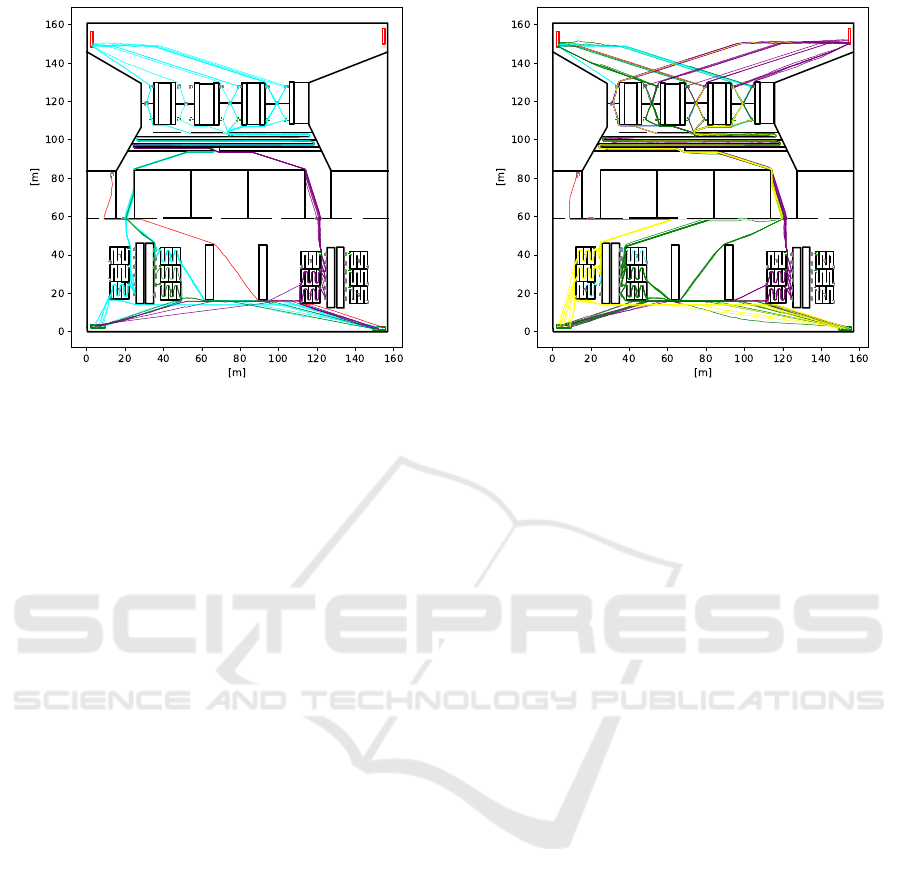
(a) t = 0 s - 755 s (b) t = 755 s - 983 s
Figure 8: Agent trajectories for different time windows: (a) Until the saboteur removes the power fuse, (b) After the electrical
left door is not operational. The red trajectory shows the path of the saboteur.
themselves, as is currently done. This change should
improve the overall reliability and robustness of our
system while also reducing the likelihood of agents
overstepping into locked doors.
The optimal-steps model does not capture the
fact that people will already adjust their pathing to
steer around congestions of other pedestrians in sight
when they are still far away, unless they estimate that
congestion will dissolve before they reach that area.
Thus, our model is also subject to this limitation. This
could be resolved by incorporating line-of-sight con-
siderations between congestion and the agent, using
its orientation in the navigation graph, as shown in
previous work (Kneidl et al., 2013).
Furthermore, the shown example assumes prior
knowledge of the building geometry for all agents.
In reality, however, not all pedestrians possess this
knowledge and may rely on their sight and informa-
tion signs for their routing decisions at a strategic
level. Proper use of in-between targets and target as-
signment within these in-between targets can help ad-
dress this issue.
Currently, we have not accounted for multiple
floor levels within a building. However, stairs and
other connection points between floor levels can be
integrated to enhance our method. Including the real-
time accessibility of elevators connecting different
floors into the pedestrian flow model might be an in-
teresting application for the presented approach.
7 CONCLUSION
Pedestrian flow simulation plays a crucial role in re-
alistically depicting the daily activities and dynamics
of infrastructure, such as airports and train stations.
However, current models are unable to incorporate the
influence of external factors by coupling the simula-
tion with other simulators or sensor data.
In this work, we propose a hybrid navigation ap-
proach that enhances the optimal steps model with an
interactive navigation graph while preserving its ad-
vantages. The software architecture we use does not
impose limitations on the number of coupled simu-
lations and enables seamless information sharing be-
tween them. Consequently, other technical systems,
such as water infrastructure, can also be integrated.
We have successfully applied our method using a
minimal example setup. The integration of pedes-
trian flow simulation with electrical simulation repre-
sents a step forward in creating comprehensive digital
twins for buildings, as it expands the scope of scenar-
ios that can be simulated and optimized. Improving
the navigation model and its implementation to accu-
rately handle problems like over-stepping, as well as
expanding it in order to simulate buildings with mul-
tiple floors will be part of future work.
REFERENCES
Artal-Villa, L. and Olaverri-Monreal, C. (2019). Vehicle-
pedestrian interaction in sumo and unity3d. In New
A Multi-Layer Navigation Approach for Interactive Pedestrian Flow Simulation in Digital Twins
303

Knowledge in Information Systems and Technologies:
Volume 2, pages 198–207. Springer.
Asano, M., Iryo, T., and Kuwahara, M. (2010). Microscopic
pedestrian simulation model combined with a tacti-
cal model for route choice behaviour. Transportation
Research Part C: Emerging Technologies, 18(6):842–
855.
Cui, X. and Shi, H. (2011). A*-based pathfinding in modern
computer games. International Journal of Computer
Science and Network Security, 11(1):125–130.
Franke, K., St
¨
urmer, J. M., and Koch, T. (2023). Automated
simulation and virtual reality coupling for interactive
digital twins. In 2023 Winter Simulation Conference
(WSC), pages 2615–2626. IEEE.
Grieves, M. (2015). Digital twin: Manufacturing excellence
through virtual factory replication. White Paper.
Han, T., Zhao, J., and Li, W. (2020). Smart-guided pedes-
trian emergency evacuation in slender-shape infras-
tructure with digital twin simulations. Sustainability,
12(22):9701.
Hart, P. E., Nilsson, N. J., and Raphael, B. (1968). A for-
mal basis for the heuristic determination of minimum
cost paths. IEEE Transactions on Systems Science and
Cybernetics, 4(2):100–107.
Kleinmeier, B., Z
¨
onnchen, B., G
¨
odel, M., and K
¨
oster, G.
(2019). Vadere: An open-source simulation frame-
work to promote interdisciplinary understanding.
Kneidl, A., Hartmann, D., and Borrmann, A. (2013). A hy-
brid multi-scale approach for simulation of pedestrian
dynamics. Transportation Research Part C: Emerging
Technologies, 37:223–237.
K
¨
oster, G., Hartmann, D., and Klein, W. (2011). Micro-
scopic Pedestrian Simulations: From Passenger Ex-
change Times to Regional Evacuation, pages 571–
576. Springer Berlin Heidelberg.
Schuhb
¨
ack, S., Daßler, N., Wischhof, L., and K
¨
oster, G.
(2019). Towards a bidirectional coupling of pedes-
trian dynamics and mobile communication simula-
tion. EPiC Series in Computing, 66(13):60–67.
Schultz, M. (2010). Entwicklung eines individuenbasierten
Modells zur Abbildung des Bewegungsverhaltens von
Passagieren im Flughafenterminal. PhD thesis, Tech-
nische Universitaet Dresden.
Seitz, M. J. and K
¨
oster, G. (2012). Natural discretization of
pedestrian movement in continuous space. Physical
Review E, 86(4):046108.
Sethian, J. A. (1996). A fast marching level set method for
monotonically advancing fronts. Proceedings of the
National Academy of Sciences, 93(4):1591–1595.
Thelen, A., Zhang, X., Fink, O., Lu, Y., Ghosh, S., Youn,
B. D., Todd, M. D., Mahadevan, S., Hu, C., and Hu,
Z. (2022). A comprehensive review of digital twin
- part 1: modeling and twinning enabling technolo-
gies. Structural and Multidisciplinary Optimization,
65(12).
Umemoto, D., Kikuchi, M., Terui, A., Abe, K., Shimizu,
R., Hirashige, K., Ito, N., and Noda, I. (2024). Urban
scale pedestrian simulation in kobe city center. Artifi-
cial Life and Robotics, 29(2):211–217.
von Sivers, I. and K
¨
oster, G. (2015). Realistic stride length
adaptation in the optimal steps model. In Traffic and
Granular Flow ’13, pages 171–178, Cham. Springer
International Publishing.
Wang, Z., Zheng, O., Li, L., Abdel-Aty, M., Cruz-Neira,
C., and Islam, Z. (2023). Towards next generation of
pedestrian and connected vehicle in-the-loop research:
A digital twin co-simulation framework. IEEE Trans-
actions on Intelligent Vehicles, 8(4):2674–2683.
Weidmann, U. (1993). Transporttechnik der Fußg
¨
anger,
volume 2 of Schriftreihe des IVT Nr. 90. Institut
f
¨
ur Verkehrsplanung, Transporttechnik, Straßen- und
Eisenbahnbau Z
¨
urich, Erg
¨
anzte Auflage edition.
White, G., Zink, A., Codec
´
a, L., and Clarke, S. (2021). A
digital twin smart city for citizen feedback. Cities,
110:103064.
SIMULTECH 2025 - 15th International Conference on Simulation and Modeling Methodologies, Technologies and Applications
304
