
Power Marketing Metering, Demand Analysis and Demand
Forecasting Based on Deep Learning
Xiaowan Zeng*, Liangbin Dong, Xiaoxi Fu, Jingyi Xie, Xinyan Wang and Jianing Liu
State Grid Fujian Marketing Service Center (Metering Center and Integrated Capital Center), Fujian, 350000, China
Keywords: Deep Learning; Power Marketing; Electricity Marketing Metering; Demand Analysis Analysis; Demand
Forecasting, Power Marketing
Abstract: At present, the power demand fluctuates greatly, and the demand analysis and processing is relatively
complex, and the real-time forecast demand is high, and these problems need to be solved. The purpose of
this paper is to study the analysis and demand forecasting of power marketing metering demand analysis and
demand forecasting based on deep learning, so as to solve the problems of inaccurate power demand
forecasting and low operational efficiency. In this paper, the initial research is carried out through the design
of system power marketing and related steps. Subsequently, the system adopts the hybrid structure of CNN
and LSTM, two deep learning algorithms, combined with microservice architecture technology, to achieve
efficient integration and deployment of the system. After the completion of the system, in order to verify the
effectiveness, stability and prediction accuracy of the system, this paper also applies the system in practice.
The results show that the system has multiple advantages, such as high accuracy, real-time, and effective
decision support. The research in this paper will provide a guarantee for the power price strategy formulation
and power dispatching optimization of power companies, ensure the high utilization efficiency of power
resources, and maintain the stable operation of the power grid. At the same time, the research in this paper
will also lay a good foundation for the further development and construction of smart grids in the future.
1 INTRODUCTION
Electricity demand forecasting has always been an
important part of power system management (Ahmed
and Basumallik, et al. 2024). In the face of growing
demand for electricity and increasingly complex
consumption patterns, it is clear that traditional
forecasting methods are no longer able to adapt to the
needs of the electricity market. At the same time,
demand analysis and analysis in power marketing
measurement is also an important part of power
system management, which deserves attention
(Bhatnagar and Yadav, et al. 2024). For example,
some scholars have proposed a time series analysis
method (Huang and Wu, et al. 2024), using ARIMA
power marketing to conduct systematic statistics and
analysis of historical demand analysis, and
establishing mathematical power marketing to predict
future power demand (Kumari and Yadagani, et al.
2024). However, this power marketing is not effective
in dealing with nonlinear and high-dimensional
demand analysis, and cannot effectively capture the
complex changes in power demand (Li and Cui, et al.
2024). At the same time, some scholars have
proposed to apply Support Vector Machine (SVM) to
the study of this problem. However, although SVM
can perform well on small-scale demand sets, it has
obvious shortcomings in large-scale and high-
dimensional demand sets, such as long market
research time and difficulty in coping with higher
computational difficulty, which makes the
application effect of this method very limited (Qian,
and Yang, et al. 2024). In 2020, some scholars
proposed that artificial neural methods can be used to
solve the problems of demand analysis and demand
forecasting of power marketing metering, but
although artificial neural methods can simulate
human brain neural networks through multi-layer
perceptrons, they are often sensitive to parameter
selection and the prediction effect is not stable
enough (Ran and Tay, et al. 2024). It can be seen that
although the above methods have their own
advantages, they cannot effectively deal with the
changing and complex power consumption patterns,
and have great limitations (Sapkota and Neupane, et
al. 2024), which cannot meet the current requirements
548
Zeng, X., Dong, L., Fu, X., Xie, J., Wang, X. and Liu, J.
Power Marketing Metering, Demand Analysis and Demand Forecasting Based on Deep Learning.
DOI: 10.5220/0013550800004664
Paper published under CC license (CC BY-NC-ND 4.0)
In Proceedings of the 3rd International Conference on Futuristic Technology (INCOFT 2025) - Volume 1, pages 548-554
ISBN: 978-989-758-763-4
Proceedings Copyright © 2025 by SCITEPRESS – Science and Technology Publications, Lda.

for high-precision and real-time prediction of power
systems. Deep learning theory provides a new way of
thinking to solve these problems (Wang and Sun, et
al. 2024). Deep learning can automatically extract and
learn the features of the demand set by building multi-
layer neural networks, and has strong nonlinear
modeling capabilities and generalization performance
(Zhang, 2024). At the same time, deep learning is
particularly suitable for large-scale and multi-
dimensional power consumption demand analysis in
power demand forecasting. In this paper, we will
study a deep learning-based demand analysis and
demand forecasting power marketing to better
improve the accuracy and real-time performance of
demand forecasting, and improve the processing
speed of the system for demand analysis.
2 RELATED WORKS
2.1 Application of Deep Learning in
Electricity Marketing
Measurement
Deep learning is a machine learning technology that
can automatically learn the representations and
features of demand analysis, and it has a common
application in power marketing measurement. At
present, through the integration of CNN and LSTM,
sufficient useful information can be extracted from a
large number of power consumption demand
analysis. In addition, the analysis of temporal
requirements is automatically processed to discover
hidden patterns in them, thereby improving the
accuracy of the analysis.
2.2 Electricity demand forecasting,
electricity marketing
Electricity demand forecasting plays an important
role in the management of the power system and is a
key part. Deep learning power marketing, such as
CNN, LSTM, GRU, etc., can be applied to the power
system due to its important advantages in capturing
time-dependent and nonlinear relationships, and has
become an important tool in power marketing
metering, demand analysis, analysis and demand
forecasting. In general, LSTMs can be used for
periodic power demand forecasting such as daily and
monthly loads. At the same time, LSTM can also be
combined with CNN to build hybrid power marketing
and improve the effect of power demand forecasting.
2.3 Relevant Theoretical Basis
The first is the theory of time series analysis. The
processing and analysis of time series demand
analysis is also the focus of demand analysis and
demand forecasting of power marketing. Although
traditional methods such as autoregressive integral
moving average power marketing and exponential
smoothing are still effective, they have been
surpassed by deep learning methods. Second,
statistical learning theory. Statistical learning theory
is related to this study, which mainly includes SVM,
random forest, prediction adjustment technology, etc.
These theoretical courses play a certain role in the
selection and classification of characteristics of
power demand analysis. Finally, large demand
analysis and processing with distributed computing.
The demand analysis of power marketing metering is
very large, and how to carry out efficient storage,
processing and analysis is a key, which needs to rely
on technologies or platforms such as large demand
analysis and processing and distributed computing.
Currently, distributed computing platforms that can
be used include Hadoop and Spark.
3 RESEARCH METHODS
3.1 System Architecture Design
The architecture of the system adopts a hierarchical
architecture pattern, which includes multiple layers,
such as demand analysis layer and processing layer,
power marketing layer, display layer and application
layer. The requirements analysis layer is mainly
responsible for the collection and storage of
requirements analysis. The processing layer is mainly
responsible for pre-processing the requirements
analysis and performing feature engineering. The
power marketing layer is mainly responsible for
building and market research, and deeply learning
power marketing. The display layer is mainly
responsible for the visualization and display of results
of demand analysis. The application layer is mainly
responsible for the application and deployment of
power marketing; Secondly, module division. The
system is mainly divided into these modules. The
module is mainly responsible for collecting various
demand analysis sources, such as smart meters and
meteorological demand analysis, and user
information systems. The module needs to perform
various pre-processing of demand analysis, such as
demand analysis cleaning and predictive matching,
feature extraction, etc. The task of the module is to
Power Marketing Metering, Demand Analysis and Demand Forecasting Based on Deep Learning
549

select and design, market research, evaluate and
optimize electricity marketing. The results analysis
and presentation module analyzes the forecast results
and then displays them in the form of graphs and
reports. The module is responsible for the
management of the system, such as operation
monitoring, logging, and exception handling.
3.2 Demand Analysis, Collection and
Pre-Processing
In demand analysis and collection, the sources of
demand analysis mainly include smart meter demand
analysis and meteorological demand analysis, user
information, historical power load demand analysis,
etc. For example, the electricity consumption of each
unit of each user, such as hourly, daily, and monthly
electricity demand analysis. Meteorological demand
analysis. The main ones are temperature and
humidity, which are closely related to the demand for
electricity. User information includes the user's
electricity consumption category, geographical
location, etc. Historical power load demand analysis,
such as the historical load curve of the grid system,
can reflect the trend of power demand changes. The
demand analysis and collection technology includes
API interfaces, for example, the system can obtain
demand analysis from third-party platforms and
systems through API interfaces. Demand analysis
sensors such as smart meters or weather sensors can
be used to collect demand analysis in real time. In
addition, a requirements analysis warehouse (such as
Hadoop) can be used to store the collected
requirements analysis in a distributed warehouse
platform
In the requirements analysis pretreatment, first of
all, the requirements analysis cleaning needs to be
carried out. (1) Handling of market competition. The
treatment of market competition is mainly to fill in
the deleted or matched demand analysis, as detailed
in equation (1).·
{
}
iii
x
= mean(x) if x is missing x otherwise
(1)
In Eq. (1),
i
x
it is the first
i
point of demand
analysis in the demand set. If the requirement analysis
point matches, it needs to be filled
mean( )
x
.
missing
It refers to
i
the condition of whether the
requirements analysis points match or not.
(2) Detect outliers. In the requirements analysis
cleaning, outliers are also detected. In this article, the
method of Eq. (2) is used to identify and deal with
outliers.
x
z
μ
σ
−
=
(2)
In Eq. (2),
z
is the z-score value;
x
is a demand
analysis point;
μ
is the mean, is the
σ
standard
deviation.
Second, there is a need to change the electricity
market environment. Implement predictive matching
processing first. For example, if the electricity market
environment is scaled to a standard range, that is, 0-
1, and then the impact of the dimension is eliminated.
Normalization is initiated, converting the electricity
market environment to a standard normal distribution
with mean = 0 and standard deviation = 1. After that,
feature extraction begins. Extract and construct useful
features from the electricity market environment,
such as extracting date information based on dates.
Then, the electricity market environment is
consolidated. Merge demand analyses from different
sources to form a unified marketing set. Convert
demand analysis into a time series format or matrix
format for easy input for power marketing. Through
interpolation and synthesis, the demand analysis is
expanded, the amount of demand analysis is
increased, the demand analysis is enriched, and the
diversity of demand analysis is improved. Moving
averages are used to smooth out the requirements
analysis so that the impact of noise can be reduced.
3.3 Deep Learning Power Marketing
In this process, the power supply layer can input
various characteristic demand analysis. The customer
layer can extract the spatial characteristics of demand
analysis through N power supply stations. The power
server can be used to reduce the dimensionality of
features and reduce the amount of computation. The
LSTM layer is used to process the features extracted
by the client layer and to capture the presence of
pipette-dependent pipettes in the time series. The
marketing layer further processes the output of the
LSTM for demand forecasting. The output layer
outputs a predicted power demand. When conducting
market research and optimization, the forecast first
prepares a demand analysis, extracts features from the
original demand set, and completes the pre-
processing work. Its characteristics include time and
temperature and humidity. Subsequently, it is
necessary to carry out the preprocessing of demand
analysis, and the forecast matching processing of
INCOFT 2025 - International Conference on Futuristic Technology
550

demand analysis is carried out to ensure the scale of
the demand set, see Eq. (3).
x-min(x)
x=
max(x) - min(x)
′
(3
)
x
is the original demand analysis value, which
represents the original demand analysis point that has
not been processed for forecast matching.
min( )x
is
the minimum value of the demand concentration.
This value adjusts the starting point of the
requirements analysis so that the minimum value of
all requirements analysis points becomes 0;
max( )x
is the maximum value of the demand set, which is
used to adjust the end point of the demand analysis,
so that the maximum value of all demand analysis
points becomes 1;
'x
is the demand analysis value
after the forecast is matched.
Then, the requirements analysis is divided. The
demand set is divided into market conditions, forecast
results, and marketing results, and the proportion is
70%, 15%, and 15%. Then, use the prepared demand
analysis market research to build the power marketing
and conduct market research. In market research,
MSE is used as a loss function to conduct market
research, and the MSE calculation is shown in Eq. (4).
ˆ
n
2
ii
i=1
1
MSE = (y - y )
n
(4)
In Eq. (4),
i
y
is the actual value;
ˆ
i
y
is a predicted
value;
n
is the number of samples.
When researching power marketing in the market,
the parameters should also be adjusted through the
backpropagation algorithm to minimize the loss
function. The prediction involves the weight
calculation formula for gradient descent, as detailed
in Eq. (5).
ij ij
ij
L
ww
w
η
∂
←−
∂
(5
)
In Eq. (5), is the weight
ij
w
that connects the first
i
layer to
j
the layer;
η
It is the market integration
rate;
ij
L
w
∂
∂
is
ij
w
the partial derivative of the loss
function for the weights.
For the evaluation of power marketing, the
performance evaluation of power marketing should
be carried out on the validation set, and the MSE of
the verification set should be calculated, see Eq. (4).
Finally, optimize electricity marketing.
Hyperparameters such as market convergence rate
and market size can be adjusted, and forecasting
adjustment techniques can be applied to optimize
power marketing, as shown in Eq. (6).
D
ropout Rate = p (e.g., p = 0.5)
(6
)
In Eq. (6),
Dropout Rate
is the proportion of
neurons randomly selected and ignored in each
iteration of the market research. If this value is equal
to 0.5, 50% of the neurons will be temporarily ignored
with each iteration. After that, a grid search or a
random search is carried out to find the optimal
combination of hyperparameters and test the power
marketing in parallel. To do this, it is necessary to test
the performance of electric marketing on the
marketing results. Calculate the MSE of the
marketing results and thus obtain the test results.
4 RESULTS & DISCUSSION
The deep learning-based power marketing metering
demand analysis and demand forecasting system can
achieve excellent performance in practical
applications, and its advantages include:
4.1 Introduction to Electricity
Marketing Metering
Taking the 35KV transmission network as the
research object, the actual purchase demand was
tested through online marketing analysis. Among
them, the test time is from the beginning of 2023 ~
the end of 2023, with 300 surveyed users and a survey
range of 10km, as shown in Figure 1.
Figure 1: Actual results of electricity marketing and
demand
Power Marketing Metering, Demand Analysis and Demand Forecasting Based on Deep Learning
551
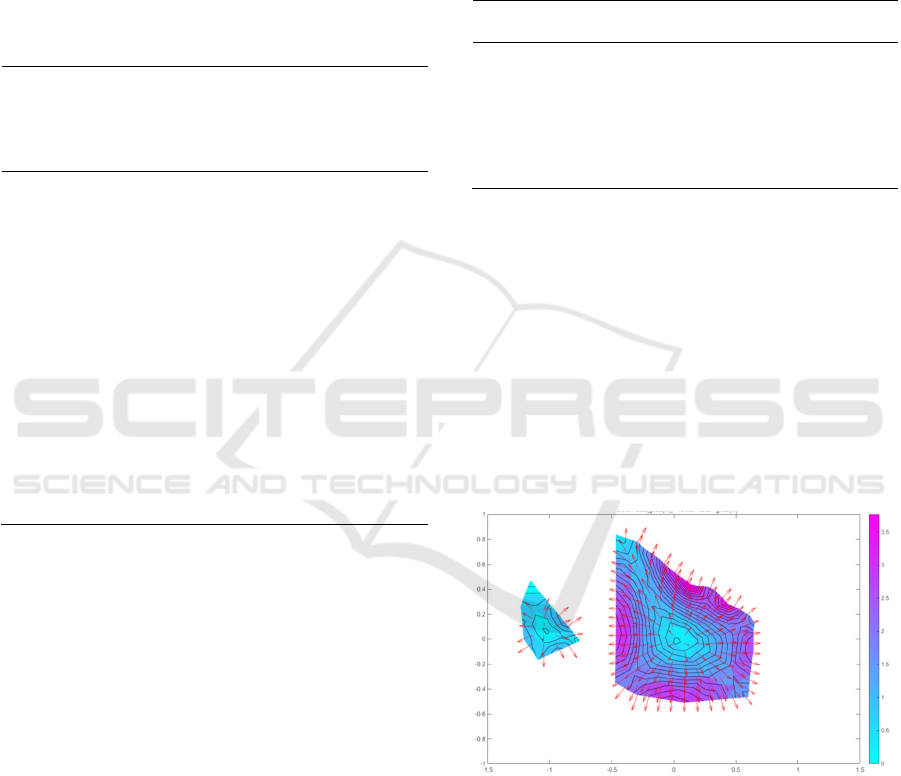
As can be seen from Figure 1, the demand for
electricity is smaller than that of electricity
marketing, so it is necessary to accurately predict to
improve the effect of electricity marketing. In the
application of the system in this paper, this paper
obtains the analysis of the operating requirements and
performance parameters of the system through
practical application, and evaluates all aspects of it.
See Table 1 for details.
Table 1: Comparison of predicted and actual power
consumption
Date Tim
e
Actual
Power
Consumpti
on (kWh)
Predicted
Power
Consumpti
on (kWh)
Error
(kW
h)
Err
or
Rat
e
(%)
202
3-
12-
01
00:0
0
1020 1015 5 0.4
9
202
3-
12-
01
01:0
0
980 985 -5 0.5
1
202
3-
12-
01
02:0
0
950 945 5 0.5
3
... ... ... ... ... ...
202
3-
12-
31
23:0
0
1100 1095 5 0.4
5
The MSE of the system on the tester is 0.050 and
the MAE is 0.17. There is only a small error between
the forecast and the actual electricity demand, and the
error rate is generally within 0.5%. This shows that
the predictive ability and accuracy of this power
marketing are very good. Description: This table
shows a comparison between actual and forecasted
power consumption per hour for December 2023.
Error and error rate indicate the accuracy of the
forecast for this power marketing
4.2 Metering Demand Forecasting
In order to ensure that the power marketing metering
demand analysis and demand forecasting can achieve
good performance, and achieve high efficiency and
high effect results in the power marketing metering
demand analysis and demand forecasting tasks. This
paper adopts the design of power marketing based on
deep learning. The modeling prediction combines
CNN and LSTM algorithms in deep learning. The
power marketing design should first include the
power marketing structure, such as the power supply
layer and the customer layer, the power server, the
LSTM layer, the marketing layer and the output layer,
and the specific demand forecast results are shown in
Table 2.
Table 2: System performance metrics
Metric Training
Set
Validation
Set
Test
Set
Mean Squared
Error (MSE)
0.045 0.048 0.050
Mean Absolute
Error (MAE)
0.15 0.16 0.17
R(Coefficient
of
Determination
)
0.95 0.94 0.93
The system has a certain degree of real-time and
flexibility. The system can process and predict power
demand in real time, and has an advantage in the
analysis and analysis of power marketing metering
demand, which can help power companies to carry
out timely power dispatching and distribution
adjustment, and improve the adaptability and
response speed of the power grid. Note: The table
provides the specific performance of the system on
different demand sets, and can show the prediction
accuracy and generalization ability of the power
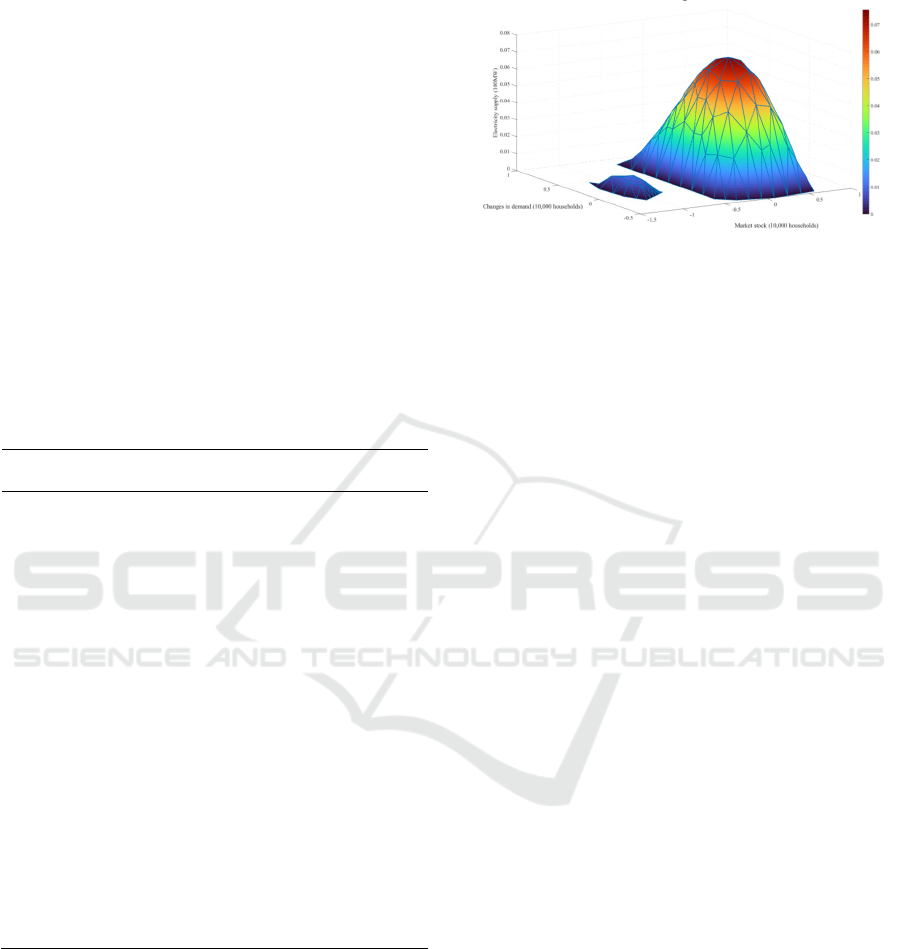
marketing, as shown in Figure 2.
Figure 2: Forecasts of electricity demand and power supply
As can be seen from Figure 2, both the demand
for electricity and the supply of electricity have
changed, showing an increase in demand and supply.
4.3 Reliability of Demand Forecasts
System architecture design, including demand
analysis layer, application layer, processing layer,
power marketing layer, and monitoring layer.
INCOFT 2025 - International Conference on Futuristic Technology
552
Integrate these layers into this system; The
microservice architecture can ensure that each
functional module can be deployed and maintained
independently. Save the market research power
marketing as a separate file to facilitate the
deployment of applications later; Servitization of
modules. To this end, FLASH should be used to
encapsulate power marketing into a Web service and
provide a predictive interface for it. The
simplification of marketing demand analysis is to
package services into container images to ensure a
high degree of consistency and portability of the
deployment environment. To do this, build and run a
Docker container and test how the service works in
the container; Finally, it needs to be deployed to a
cloud platform, such as AWS, to achieve high
availability and scalability of the system, and the
reliability analysis of the requirements is shown in
Table 3.
Table 3: System application effects
Application
Scenario
Description Improvement
Effect
Power Dispatch
Optimization
Optimizing
power
distribution
based on
prediction
results to reduce
p
eak loa
d
Peak load
reduced by 5%,
dispatch
efficiency
increased by
10%
Electricity
Pricing Strategy
Adjustment
Adjusting
pricing strategy
based on
demand
prediction to
achieve supply-
demand balance
Price fluctuation
reduced by
15%, customer
satisfaction
increased
Power Grid
Stability
Improvement
Real-time
demand
prediction to
preemptively
identify
potential grid
instability
factors
Grid failure rate
reduced by
20%, response
time shortened
by 30%
The results in Table 3 illustrate the scenarios and
effects of the system application, showing that the
utility's operations have improved. Provide reliable
decision support. The application of the system can
provide accurate prediction results and efficient
demand analysis, and the application of the system
will provide powerful decision-making support for
the power company's electricity price strategy
formulation and scheduling optimization. In addition,
it can improve the efficiency of power resource
utilization, as shown in Figure 3.
Figure 3: The relationship between power marketing
capability and demand
As can be seen from Figure 3, the effect of power
marketing has improved, and it has gradually met the
power supply needs of users, which is more targeted.
Through the application of the system and its deep
learning hybrid power marketing, the system can
maintain strong robustness and high stability in
complex power consumption demand analysis, and
can adapt to various demand analysis fluctuations and
anomalies.
5 CONCLUSIONS
In the system proposed in this paper, it can be found
that the requirements analysis of the system is very
good after practical application. The demand analysis
results show that the value of the system in the
application of power demand forecasting is 995
MWh, and the actual power demand is 1000MWh,
the mean square error between the two is 0.05, the
mean absolute error is 0.17, and the error rate is 0.5%.
As a result, the system can efficiently and accurately
predict power demand, and significantly improve the
operational efficiency and decision-making
efficiency of power companies. At the same time, the
system has strong robustness, stability and high
economy, which can handle a large number of power
marketing metering demand analysis, and maintain
efficient operation and accurate demand analysis and
analysis capabilities. At the same time, the system can
also enhance the operational stability of the power
grid and reduce power waste for power companies.
The research results of this paper have certain
limitations, and there are controversies in demand
analysis and index selection in the analysis and
collection of power marketing metering demand and
power demand forecasting, and the analysis will be
Power Marketing Metering, Demand Analysis and Demand Forecasting Based on Deep Learning
553

focused on in the future to provide support for the
construction of smart grid.
REFERENCES
Ahmed, A., Basumallik, S., Srivastava, A. K., Wu, Y. H.,
& Choudhury, S. (2024). Federated Synchrophasor
Data Prediction, Aggregation and Inference Using
Deep Learning: A Case of Proactive Control for Short-
Term Stability. Ieee Transactions on Power Delivery,
39(2), 823-834.
Bhatnagar, M., Yadav, A., & Swetapadma, A. (2024).
Integrating Distributed Generation and Advanced Deep
Learning for Efficient Distribution System
Management and Fault Detection. Arabian Journal for
Science and Engineering, 49(5), 7095-7111.
Huang, T. F., Wu, Z. W., Zhan, W., Wang, C. G., & Lin, T.
Y. (2024). ELECTRIC ENERGY METERING
ERROR EVALUATION METHOD BASED ON
DEEP LEARNING. Scalable Computing-Practice and
Experience, 25(3), 1904-1913.
Kumari, N., Yadagani, A., Behera, B., Semwal, V. B., &
Mohanty, S. (2024). Human motion activity recognition
and pattern analysis using compressed deep neural
networks. Computer Methods in Biomechanics and
Biomedical Engineering-Imaging and Visualization,
12(1),32.
Li, Z. H., Cui, J. X., Lu, H. P., Zhou, F., Diao, Y. L., & Li,
Z. X. (2024). Prediction model of measurement errors
in current transformers based on deep learning. Review
of Scientific Instruments, 95(4),35.
Qian, Y. H., Yang, G. J., Lian, Z. G., Liu, D. M., Wang, L.,
& Tang, M. (2024). Deep Learning to Overcome Non-
Local Effect in Brillouin Optical Time-Domain
Analysis. Journal of Lightwave Technology, 42(16),
5724-5735.
Ran, X. H., Tay, W. P., & Lee, C. H. T. (2024). Robust
Data-Driven Adversarial False Data Injection Attack
Detection Method With Deep Q-Network in Power
Systems. Ieee Transactions on Industrial Informatics,
20(8), 10405-10418.
Sapkota, D. B., Neupane, P., Joshi, M., & Khan, S. (2024).
Deep learning model for enhanced power loss
prediction in the frequency domain for magnetic
materials. Iet Power Electronics,2(2),32.
Wang, G., Sun, S. Y., Fan, S. Y., Liu, Y. N., Cao, S. X., &
Guan, R. Q. (2024). A spatial-temporal data-driven
deep learning framework for enhancing ultra-short-
term prediction of distributed photovoltaic power
generation. International Journal of Electrical Power &
Energy Systems, 2(2),160.
Zhang, Y. T. (2024). Deep learning method for predicting
electromagnetic emission spectrum of aerospace
equipment. Iet Science Measurement & Technology,
18(4), 193-201.
INCOFT 2025 - International Conference on Futuristic Technology
554
