
Design and Implementation of Intelligent Service Bracelet Supported
by BDS and GIS
Xin Li, Jin Xue
*
, Yifeng Peng, Jianfeng Xiao, Youzi Wang, Yufei Shang and Hongyan Ma
Dalian University of Science and Technology, Dalian,116052, Liaoning, China
Keyword: Intelligent Services, BDS, GIS, Smart Bracelet.
Abstract: With the promotion of economic and social development, people have a greater demand for spiritual life,
among which urban large amusement parks are an important place for people to enjoy life. Due to high
pedestrian density and strong signal interference, traditional path planning models are not applicable in the
environment of large urban amusement parks. The design and implementation of intelligent service bracelets
supported by the Beidou satellite navigation system and geographic information system is an important step
in improving personal quality of life. This innovative technology integrates GPS, sensors, and communication
modules to provide real-time location tracking, health monitoring, and emergency response services. The
intelligent service bracelet design is user-friendly, lightweight, and durable. It can be worn on the wrist, or
hung on clothes or bags. This device collects data on users' heart rate, blood pressure, body temperature, and
other vital signs. Information is transmitted to a cloud based platform for analysis and storage. In emergency
situations such as falls or sudden illnesses, the device sends an alert message with user location information
to the designated contact person. This bracelet also provides navigation assistance for users with impaired
vision or difficulty finding their way in unfamiliar areas. Overall, this intelligent service bracelet has great
potential in improving medical services and strengthening personal safety measures. Its design and
implementation demonstrate how to utilize technology to create innovative solutions to real-world problems.
1 INTRODUCTION
With the development of the social economy, people
have shifted from solving the problem of food and
clothing to emphasizing the enjoyment of life. The
most important entertainment point is the urban large-
scale amusement park, represented by Disney, Happy
Valley, Fonterra and other large-scale amusement
park brands, which have been built and put into use
one after another. However, so far, problems such as
long queue times, mismatched flow of people and
resources, and insecurity of tourist safety in
amusement facilities still exist and are serious (Perin,
Padrique, et al. 2021). The management of the
amusement park has also proposed a series of
solutions to the above problems, such as manual
evacuation of passenger flow, scheduled equipment
inspections, and the establishment of temporary child
management places. However, these solutions are
mostly manual processing, time-consuming and
laborious, and cannot achieve the expected results,
bringing negative gaming experiences to tourists
(Han, Chen, et al. 2022). However, the research and
use of the existing smart tourism system is also
limited to the national A-level tourist attraction,
natural scenic spots, historical scenic spots, etc., and
it has not been used in large urban amusement parks.
Therefore, it is urgent to research and design a smart
system for large amusement parks. The above issues
are divided into two categories in the article: the
problem of tourists selecting the best amusement
facilities, and the problem of tourists' own safety
(Wu, 2022). In response to these two issues, an
embedded module, wearable, and reusable intelligent
service bracelet, as well as an intelligent cloud
platform based on the Beidou positioning system and
geographic information system, have been designed
to provide real-time services such as crowd density
display, personnel information matching, optimal
facility selection, optimal play route design, warning
of danger or overflow areas, and sending of help
information for tourists, improving their gaming
experience, Facilitate effective management of
amusement park management (Mamodiya, Tiwari, et
al. 2021).
Li, X., Xue, J., Peng, Y., Xiao, J., Wang, Y., Shang, S. and Ma, H.
Design and Implementation of Intelligent Service Bracelet Supported by BDS and GIS.
DOI: 10.5220/0013540500004664
Paper published under CC license (CC BY-NC-ND 4.0)
In Proceedings of the 3rd International Conference on Futuristic Technology (INCOFT 2025) - Volume 1, pages 307-314
ISBN: 978-989-758-763-4
Proceedings Copyright © 2025 by SCITEPRESS – Science and Technology Publications, Lda.
307

The China Beidou navigation satellite system
(BDS) is a global satellite navigation system
developed by China. It belongs to the active
bidirectional ranging two-dimensional navigation
system, which is solved by the ground center control
system and provides users with three-dimensional
positioning data. In addition to the function of GPS
satellite positioning, communication function has
also been added, and regional navigation, positioning,
and timing capabilities have been provided. The
positioning accuracy is 10 meters, and the speed
measurement accuracy is 0 2 meters/second, with a
timing accuracy of 10 nanoseconds. China
successfully completed the deployment of the
Beidou-3 basic system constellation on November 19,
2018, and announced on December 27 that Beidou-3
began providing global services, making the Beidou
satellite navigation system more powerful and widely
used. Geographic information system (GIS) is a
spatial information technology that collects, stores,
manages, operates, analyzes, displays, and describes
data on geographical phenomena (Luo 2021). It
focuses on location and geographic information as its
core and foundation, solving problems related to
geographic information.
The smart bracelet can also record the pulse wave
signal of the human body through
photoplethysmography (PPG). Real time heart rate
signals containing a large amount of heart rate
variability (HRV) information can be extracted from
PPG, and the vast majority of the health monitoring
functions of the bracelet are related to the
characteristics of heart rate variability. When the
human body is in different sleep stages, stress states,
fatigue states, or certain disease states, the body's
mechanisms will automatically adjust to adapt to
changes, and these regulatory information will be
reflected in heart rate variability (Wan, Dong et al.
2022). At present, most of the monitoring functions
of smart bracelets are also achieved by monitoring
changes in heart rate variability.
Therefore, the quality of PPG real-time heart rate
signals has a significant impact on the accuracy of
intelligent bracelet related functions. There are many
factors that affect the quality of real-time heart rate
signals in PPG wristbands, including hardware
devices, ambient light, motion artifacts, etc.
Therefore, before launching any smart wristband or a
new feature based on real-time heart rate signals, a
detailed quality evaluation of the real-time heart rate
signals in PPG wristbands should be conducted to
ensure the quality of the signals and the accuracy of
the features extracted from the signals, To support
subsequent related analysis and research (Ghavidel
Maalandish et al. 2021).
At present, the standard real-time heart rate signal
is extracted from the electrocardiogram (ECG) signal.
The operation of medical grade ECG devices is
complex, and wearable ECG devices are more
convenient to use. However, they are still not as
convenient and easy to operate as smart wristbands.
Therefore, people tend to use smart wristbands in
daily life to monitor real-time heart rate related
physical states and functional indicators (He, Zhang,
Zhang, 2021). In the quality evaluation of real-time
heart rate signals of PPG smart bracelets, the real-
time heart rate signals extracted from
electrocardiogram can be used as standard real-time
heart rate signals (i.e. reference values). In daily life,
wearing wearable electrocardiographic devices and
smart bracelets at the same time and comparing the
real-time heart rate signal of the bracelet pulse wave
with the standard real-time heart rate signal should be
the most direct and accurate quality evaluation
method.
2 RELATED WORK
2.1 Intelligent Bracelet Service Module
The core solution of this design is to display the
density of pedestrian flow, providing tourists with the
best playing facilities and paths. The data involved in
this plan include amusement facility points,
accessible roads, all signal points obtained from BDS,
and tourist body signal points. The main steps are as
follows:
(1) Perform kernel density analysis using all
signal points and output the analysis results;
(2) Utilize amusement facility points for
European allocation to obtain various facilities
Based on the service range of the point, partition
and count the results of step 1 based on this service
range to obtain the average pedestrian flow value of
each service area (Yalcin Yazici, et al. 2022).
Establish a waiting time function based on the
number of passengers carrying the amusement
facility once, and determine the waiting time required
for each facility;
(3) Perform network analysis using tourist body
signal points, amusement facility points, and
accessible roads to obtain the shortest time path from
the body signal point to each facility point. Extract the
time spent on this path, compare it with the waiting
time in step 2, and obtain the maximum value. Use
this value to establish a new field, namely cost time,
INCOFT 2025 - International Conference on Futuristic Technology
308
compare and obtain the minimum value of all cost
time, and output the facility point corresponding to
the minimum value as the optimal facility point, Set
the optimal facility point as the main signal point and
delete it (Genuth-Okon and Knights 2023);
(4) Perform a loop through step 3 until all
amusement facility points have been traversed, and
output all the best facility point numbers in order to
obtain the order of path docking points. Then,
perform the shortest path analysis to output the best
amusement path. Taking Chengdu Happy Valley as
an example, 1000 signal points and 1 tourist body
signal point were obtained throughout the entire park.
Remote sensing images were used as data sources,
and ArcGIS was used to obtain park boundary vector
data, road vector data, and amusement facility point
vector data (Güllü, Demirdelen et al. 2022). Based
on the actual situation, certain attribute values were
assigned to the data, such as walking speed and road
passage time.
Among them, according to the existing signal
point data, nuclear density analysis data and facility
point service area data statistics, two groups of data,
the actual number of people and the estimated number
of people, were obtained (Monteverde Llorens et al.
2022). MATLAB was used to perform function
fitting analysis on the two groups of data, and found
that the linear function function relationship fitting
precision was the best, which met the fitting precision
conditions, and the functional relationship between
the actual number of people and the estimated number
of people was obtained:
𝑦=0.001𝑥−0.0361
(1)
By consulting information, it was found that the
time required for the amusement facility to operate
once and the number of people it can carry were
obtained. Similarly, it was found that the cubic
function relationship had the best fitting accuracy and
met the fitting accuracy conditions (Zhou Du, Kim,
2022). The functional relationship between waiting
time and the number of people it can carry was
obtained:
𝑦=0.0001𝑥
−0.0148𝑥
+0.6671𝑥
−3.047
(2)
The calculation method for ApEn is as follows:
1) Assuming there is a time series 𝑥 (𝑥), 𝑥=1,2,...,
𝑛, with the embedding dimension m as the window
length, m is usually taken as 2 or 3, the time series 𝑥
(𝑥) is divided into K=n-m+1 subsequences.
𝑋
={𝑥
(𝑡),𝑥
(𝑡),...,𝑥
()
(𝑡)},𝑖=
1,2,...,𝐾
(3
)
2) Calculate the distance 𝑑 between each sequence
and another K-1 sequence, taking the maximum
absolute value of the pairwise distance.
𝑑
=max∣𝑥
(𝑡)−𝑥
(𝑡)∣,𝑘
=1,2,...,𝐾
(4
)
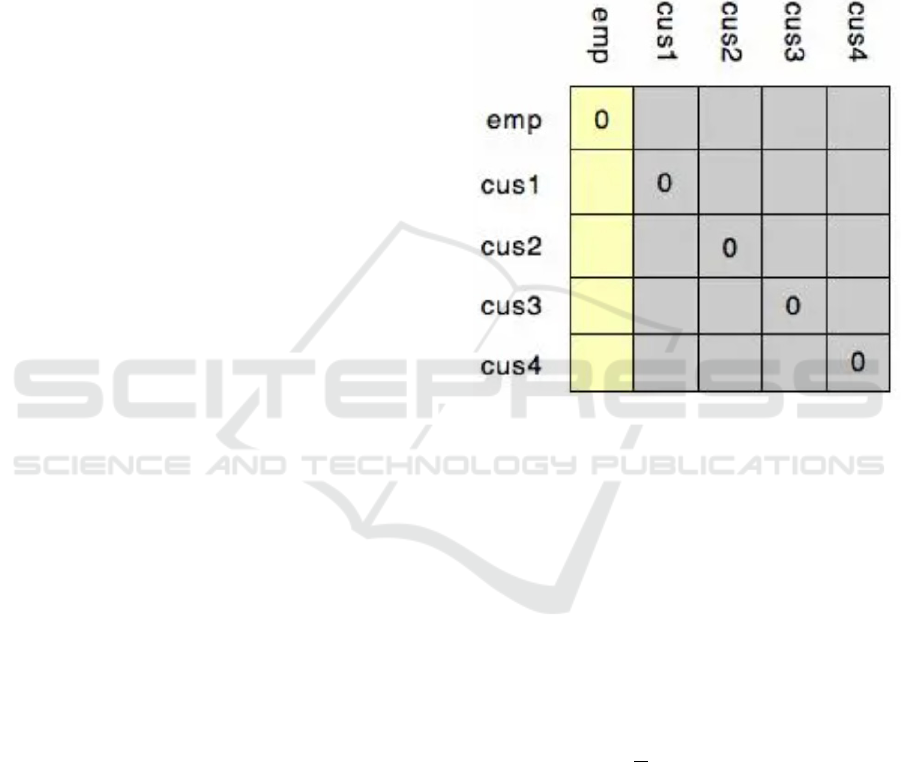
3) Get the distance matrix 𝑑 as shown in Figure 1:
Fig. 1. Distance matrix
3) Define a threshold D:
𝐷=𝑟∗𝑆𝐷
(5
)
Among them, r is the scale, the range of r is
usually 0.1-0.2, and SD is the standard deviation of
the time series 𝑥 (𝑥).
5) Count the number of 𝑑 in each row that is less
than D, calculate the ratio 𝐶 (𝑟) that exceeds the
threshold, and calculate the logarithmic average of K
𝐶 (𝑟):
𝜙
(𝑟)=
1
𝐾
𝐼𝑛𝐶
(𝑟)
(61
)
6) Change the window length m by one to m+1,
repeat the above steps, and then calculate the
difference between the two to obtain the approximate
entropy:
𝐴
𝑝𝐸𝑛(𝑡)=𝜙
(𝑟)−𝜙
(𝑟)
(7
)
Out of consideration for tourist safety issues, the
intelligent service bracelet has designed a security
Design and Implementation of Intelligent Service Bracelet Supported by BDS and GIS
309

service module for tourists. The main steps of this
plan are to use Beidou positioning technology to set
up an electronic fence around the park, and delineate
a safe area range at the corresponding boundary on
the map (Lilo, Mashhadany, et al. 2021). The
obtained tourist body signal point is input to
determine the range of the point. If it is within the
designated range, no feedback information will be
provided and monitoring will continue; If it is not
within the designated range, send a danger warning
signal.
2.2 Calculating Heart Rate Variability
Using Real-Time Heart Rate
Signals
With the popularity of smart bracelets, more and more
people are using them to monitor their health.
However, due to the storage of important information
such as user health data and personal privacy in smart
bracelets, the security issues of smart bracelets have
also received widespread attention. In order to ensure
the security of user data, smart bracelet manufacturers
need to add security modules for protection.
The smart bracelet stores important information
such as user health data and personal privacy.
Therefore, a reliable data storage solution must be
adopted to ensure the integrity, confidentiality, and
availability of the data. Common solutions include
data encryption storage, backup and recovery
mechanisms, etc. The security of smart bracelets is
the key to ensuring user data security. Smart bracelet
manufacturers need to design and implement a series
of security measures to ensure the security and
legality of user data (Dai, Wang, et al. 2021). With
the continuous development of technology and the
Internet of Things, the security issues of smart
bracelets also need to be constantly updated and
upgraded to maintain technological leadership and
foresight.
Heart rate variability is an important, non-
invasive and convenient index to evaluate the
regulation of the human autonomic nervous system
and human health. It is also used in most smart
bracelets in the market. When the external
environment is stimulated or the human body
changes, the autonomic nervous system regulates the
heart sinoatrial node, and the heart rate changes
irregularly. Therefore, HRV reflects the ability of the
human body to autonomously regulate and is one of
the important methods used to monitor the
physiological and psychological conditions of the
human body. In previous studies, there were many
methods for analyzing HRV, mainly including time-
domain analysis, frequency-domain analysis,
nonlinear analysis, etc. The specific methods are as
follows:
The time-domain feature of HRV is to describe
real-time changes in heart rate using statistics from
the perspective of the timeline. The common HRV
time-domain indicators are as follows:
(1) Mean RR: The average level of R-R interval
over a certain period of time. The calculation method
is shown in equation (1):
𝑀𝑒𝑎𝑛𝑅𝑅=
(8
)
Among them, 𝑁 represents the number of normal
R-R intervals, and 𝑅𝑅 represents the i-th R-R
interval.
(2) Standard deviation of normal to normal
intervals (SDNN): The standard deviation of normal
RR intervals after excluding abnormal RR intervals.
The calculation method is shown in equation (2):
𝑆𝐷𝑁𝑁=
1
𝑁
(𝑅𝑅
−𝑅𝑅
‾
)
(9
)
Among them, (RR) ‾ represents the average value
of the normal R-R interval. The normal reference
range is 141 ± 39, in milliseconds (ms).
(3) The standard deviation of the average R-R
intervals calculated every five minutes (SDANN)
reflects the relatively slow changes in HRV. The
calculation method is shown in equation (10):
𝑆𝐷𝐴𝑁𝑁=
(𝑅𝑅
‾
−𝑅𝑅
𝑚𝚤𝑛
‾
)
𝐾
(10
)
Among them, (RR) ‾_ L is the mean R-R interval
of the i-th 5-minute, (RR) ‾_ ("5" min) is K RRs_ The
mean of l, where K represents K 5-minute windows
in this signal segment.
(4) The standard deviation (SDSD) of the
difference between all adjacent R-R intervals.
(5) The root mean square (rMSSD) of the
difference between adjacent R-R intervals reflects the
rapidly changing part of HRV. This indicator reflects
the regulation of the parasympathetic nervous system.
If the parasympathetic nerve is dominant, rMSSD
will rise. The calculation method is shown in Formula
(11):
INCOFT 2025 - International Conference on Futuristic Technology
310

𝑟𝑀𝑆𝑆𝐷
=
1
𝑁−1
(𝑅𝑅
−𝑅𝑅
)
(11)
(6) The percentage of adjacent R-R intervals with
a difference greater than 50ms in the total number of
R-R intervals (pNN50) reflects a sudden change in R-
R intervals. The calculation method is shown in
equation (12):
𝑝𝑁𝑁50=
𝑁𝑁50
𝑁
×100%
(12)
Among them, 𝑁 𝑁 50 is the number of adjacent
R-R intervals greater than 50ms.
3 DESIGN OF INTELLIGENT
SERVICE BRACELET
SUPPORTED BY BDS AND GIS
3.1 Principle and Application of
Information Similarity Algorithm
At present, the commonly used assessment of pulse
wave heart rate quality mainly uses pulse wave
waveform characteristics or qualitatively evaluates its
quality through the correlation between pulse wave
HRV indicators and electrocardiogram HRV
indicators. This project will use time series
symbolization coding and sorting statistics to
calculate the similarity index of dynamic change
patterns between pulse wave real-time heart rate
signals and electrocardiogram standard real-time
heart rate signals, in order to quantitatively evaluate
the quality of real-time heart rate signals.
Yang et al. believe that complex physiological
signals may contain unique dynamic characteristics,
which may be related to the underlying mechanisms
behind them. Based on this, a symbolic sequence
method was proposed to study the change patterns
and dynamic characteristics of signals, and a new
algorithm for calculating signal similarity was
proposed. This algorithm is also known as the IBS
(Information Based Similarity) algorithm.
The specific steps of the IBS algorithm are as
follows:
(1) Assuming there is a continuous interval signal
𝑋
={𝑥
,𝑥
,…,𝑥
}, where 𝑥 is the k-th interval
value. Starting from 𝑥, take two consecutive
intervals {𝑥
,𝑥
} as a group. A set of interval pairs
can have two variation modes, one is 𝑥
ratio 𝑥
is
small or equal, one is 𝑥
ratio 𝑥
is large. Represent
these two change modes with 0 and 1, as shown in
equation (13):
𝐼
=
0, 𝑥
≤𝑥
1, 𝑥
>𝑥
(13
)
(2) According to the conversion rule in (1), the
continuous interval signal is converted into a binary
symbol sequence 𝑆, m symbols are taken as a group,
and the long sequence is divided into multiple sets of
symbol sequences with a length of m. Each symbolic
sequence with a length of m represents a pattern of
change, denoted by 𝑊
={𝐼
,...,𝐼
}represents.
After obtaining the set, count the number and
frequency of occurrences of various patterns in the
set, and sort the various symbolic sequences in
reverse order according to their frequency. The first
ranked symbolic sequence indicates that the change
pattern it represents most often appears in the original
signal; On the contrary, the symbolic sequence at the
bottom of the ranking indicates that the change
pattern it represents is least commonly present in the
original signal. If a symbolic sequence with a length
of m is set, there are two change modes. With the
increase of m, the types of change patterns increased
exponential growth. Therefore, when the original
signal length is short, m should not be too large.
Choosing an appropriate m based on the length of the
original signal is a question worth exploring.
(3) Based on the frequency and ranking of the
symbolic sequence with a length of m in the two
original signals, select the sequence of change
patterns that appear in both original signals, and
substitute it into equation (14) to calculate the
similarity between the two signals. 𝐷 represents the
IBS distance indicator (i.e. similarity indicator) of the
two signals. The larger the distance, the lower the
similarity between the two signals, and vice versa, the
higher the similarity.
𝐷
(𝑆
,𝑆
)
=
∣𝑅
(𝑤
)−𝑅
(𝑤
)∣𝐹(𝑤
)
(
2
−1
)
(14
)
𝐹(𝑤
)=
1
𝑍
[−𝑝
(𝑤
)𝑙𝑜𝑔𝑝
(𝑤
)
−𝑝
(𝑤
)𝑙𝑜𝑔𝑝
(𝑤
)
]
(15
)
𝑍=[−𝑝
(𝑤
)𝑙𝑜𝑔𝑝
(𝑤
)
−𝑝
(𝑤
)𝑙𝑜𝑔𝑝
(𝑤
)
]
(16
)
Design and Implementation of Intelligent Service Bracelet Supported by BDS and GIS
311
Among them, 𝑝
(𝑤
) and 𝑅
(𝑤
) represents the
symbolic sequence 𝑤௧ in S, respectively_ 2.
Probability and ranking of occurrence. Similarly, 𝑝ଶ
(𝑤௧) and 𝑅ଶ (𝑤௧) respectively symbolize the
sequence w_ T represents the probability and ranking
of its occurrence in 𝑆ଶ. The absolute difference in
ranking is divided by the normalization factor Z and
(2
−1) to ensure that the range of 𝐷 is between 0
and 1.
3.2 Software and Hardware Design
3.2.1 Hardware Design
The core modules of this intelligent bracelet are the
Beidou navigation and positioning module, Beidou
communication module, and Bluetooth module.
These three modules are integrated to form the most
core integration block of the intelligent service
bracelet. The Beidou navigation and positioning
module is the core of the intelligent service bracelet
implementation service module, using the Hexin
Xingtong UM220-IIINLBD2/GPS dual mode
positioning module under Xingtong Industry. This
module is currently the smallest fully domestically
produced BDS/GPS module in the market, with high
integration and excellent positioning and navigation
functions, supporting single system and multi-system
joint positioning. The Beidou communication module
is the core module of the intelligent service bracelet
to achieve safety warning. It adopts the GYM2002A
Beidou RDSS communication basic module from
Beijing Guoyi Hengda Navigation Technology,
which is small in size, low in power consumption, and
reliable in performance. The Bluetooth module is an
important module that connects smart service
bracelets with smartphones, enabling tourists to
access services on the smart cloud platform. It adopts
the SKB369 (A) module of Shenzhen Tiangong
measurement and control technology. The selected
modules can operate normally in more extreme
environments and have a longer service life, which
meets the needs of the intelligent bracelet design.
Connect the core processing board, three core
modules, battery, electronic display screen, buttons,
and other components through bottom board wiring
to obtain the integrated circuit board of the smart
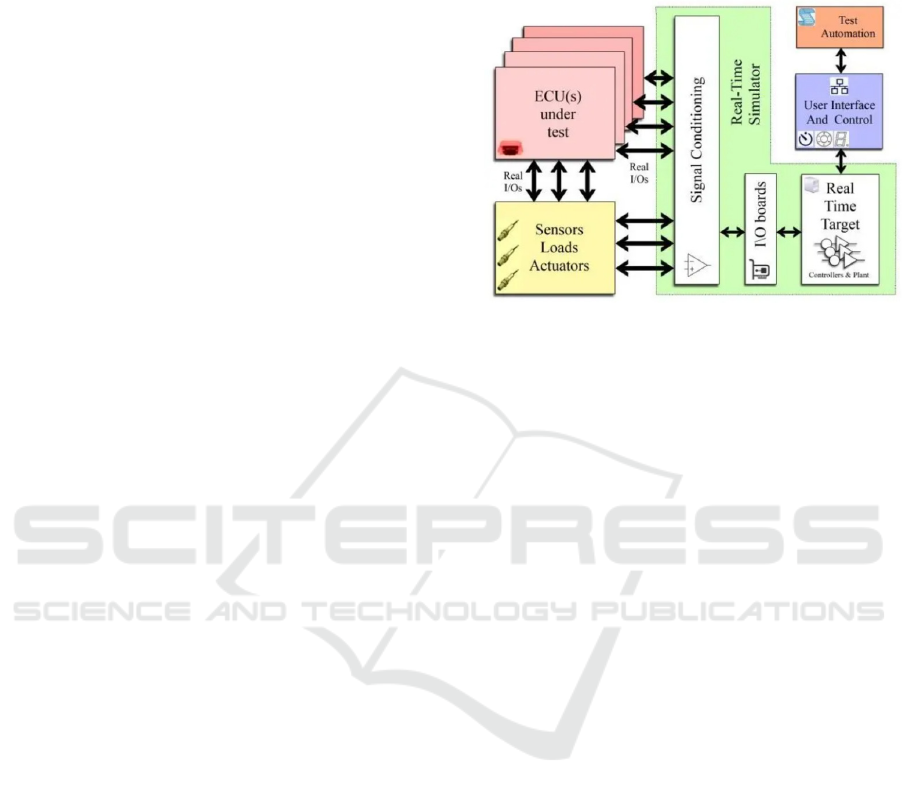
bracelet. The hardware structure diagram of the
intelligent bracelet terminal is shown in Figure 2.
Based on the above core solution design, the
intelligent cloud platform system is designed and
developed using C # and ArcGISEngine development
libraries. The software has designed two core
business classes, ServiceModule and
SecurityModule, which correspond to the service
module and security module, and contain the required
methods for each module.
Figure 2: Hardware structure diagram of intelligent bracelet
terminal
3.2.2 Software Design
This involves connecting the BDS module and
transmitting signals back, analyzing coordinates and
performing layer display, kernel density analysis,
Euclidean allocation, partition statistics, shortest path
analysis, cost time calculation, optimal facility point
extraction, facility point play order extraction, spatial
topology query, and other core methods. The
calculation results of the software operation are the
same as the case of Chengdu Happy Valley
mentioned earlier.
4 EXPERIMENTAL SIMULATION
ANALYSIS
Before the formal scientific testing of the system, a
survey was conducted on the user selectivity of
software and hardware. A questionnaire survey was
conducted on 1000 scattered tourists around Chengdu
Happy Valley and Shenzhen World Window,
including teenagers aged 10-50 and middle-aged and
young people, with the majority being young people.
73.5% of people are willing to use the system and
believe that it has practical value for use; About 45%
of people believe that the system can be implanted
into commonly used mobile apps such as WeChat,
making it convenient for tourists to use.
Convert the real-time heart rate signal into a
binary 0-1 symbolic sequence according to equation
(13), as shown in Figure 3. Triangles are labeled as
real-time heart rate signals, and dots are labeled as
INCOFT 2025 - International Conference on Futuristic Technology
312
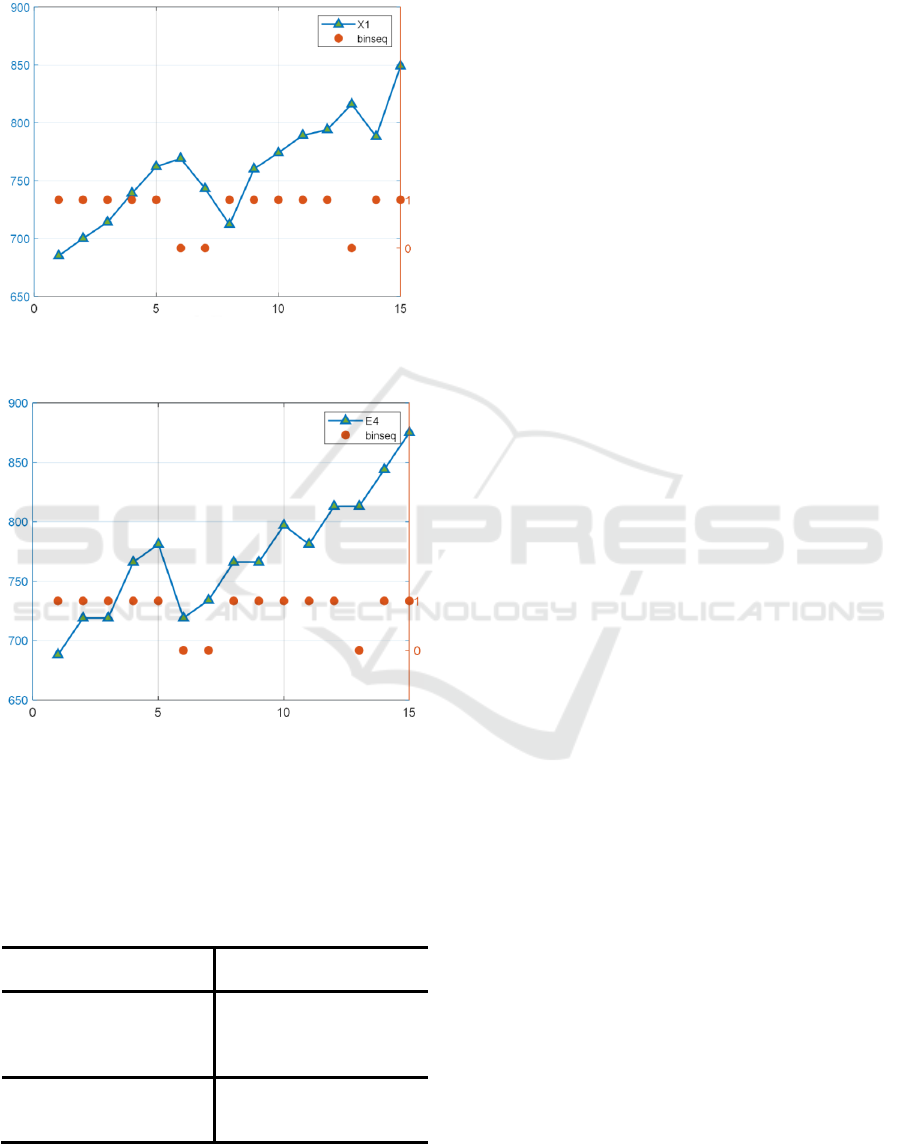
corresponding converted binary sequences. Figure 3
shows the conversion process of standard real-time
heart rate signals, and Figure 4 shows the conversion
process of E4 bracelet real-time heart rate signals.
Figure 3: The Symbolic Sequence Conversion Process of
Standard Real Time Heart Rate Signal
Figure 4: The Symbolic Sequence Conversion Process of
Real Time Heart Rate Signal for E4 Bracelet
The frequency and ranking of the 8 change modes
in the standard real-time heart rate signal and the real-
time heart rate signal of the bracelet are shown in
Table 1.
Table 1: Frequency and ranking of each change mode
Standard real-time heart
rate si
g
nal
Real time heart rate signal
of the bracelet
Chan
ge
mode
Frequen
cy of
occurre
nce
ranki
ng
Chan
ge
mode
Frequen
cy of
occurre
nce
ranki
ng
000 0.20069 1 000 0.21107 1
001 0.16263 2 001 0.15571 2
100 0.15917 3 100 0.15225 3
From the table, it can be seen that there are some
differences in the ranking of each mode, but the
difference is not significant. At this point, the IBS
indicator calculation result is 0.0581. However, in the
standard real-time heart rate signal, there are already
two change modes that have not appeared.
Considering that when m is taken as 5, there will be
more missing change modes, so m=4 will be used in
subsequent research in this project. In 4.4.2, the data
from the second resting state of participant 3 was used
and based on experience, m=5 was used to
demonstrate the method process. Due to the longer
duration of the resting state task (500s) compared to
the deep breathing task (300s), taking m=5 has little
impact on the results. However, considering the data
of the three time periods (300s, 360s, 500s), taking
m=4 is more appropriate.
5 CONCLUSIONS
A solution was proposed by combining BDS and GIS,
and small-scale experiments were conducted using
ArcGIS to validate the solution. For this purpose, an
intelligent service bracelet and its corresponding
intelligent cloud platform were designed. Desktop
software design and development were carried out
using C # and ArcGIS Engine development libraries,
and actual testing was conducted in Chengdu and
Shenzhen. The test results indicate that this scheme
can effectively alleviate issues such as personnel
congestion and safety in amusement parks, while
providing services for tourists to play and park
management, reducing waiting time for tourists, and
improving the management efficiency and
effectiveness of park managers.
REFERENCES
Perin M , Padrique R , Estomata C , et al. THE DESIGN
AND IMPLEMENTATION OF SOCIAL
DISTANCING BRACELET DETECTOR FOR
EVERY PUBLIC TRANSPORTATION IN BOHOL.
2021.
Han J , Chen Z , Han L . Design and implementation of
intelligent monitoring system for public transport
applications. 2022.
Wu S . Design of Intelligent Customer Service Questioning
and Answering a System for Power Business Scenario
Based on AI Technology[J]. Mathematical Problems in
Engineering, 2022, 2022.
Mamodiya U , Tiwari N . Design and implementation of an
intelligent single axis automatic solar tracking
system[J]. 2021.
Design and Implementation of Intelligent Service Bracelet Supported by BDS and GIS
313

Luo Y . Design and Implementation of Smart Archives
Information Service Architecture. 2021.
Wan G , Dong X , Dong Q , et al. Design and
implementation of agent-based robotic system for agile
manufacturing: A case study of ARIAC 2021[J].
Robotics and Computer Integrated Manufacturing: An
International Journal of Manufacturing and Product and
Process Development, 2022(77-):77.
Ghavidel B Z , Maalandish M , Hosseini S H , et al. Design
and implementation of an improved power鈥恊
lectronic system for feeding loads of smart homes in
remote areas using renewable energy sources. 2021.
He Y , Zhang Y , Zhang Y , et al. Design and
Implementation of Real-time Power Grid WebGIS
Visualization Framework Based on New Generation
Dispatching and Control System[J]. Journal of Physics:
Conference Series, 2021, 2087(1):012073-.
Yalcin F , Yazici I , Arifoglu U . Design and
implementation of a single-phase buck-type inverter via
an efficient hybrid control technique[J]. Circuit World,
2022, 48(3):377-391.
Genuth-Okon D , Knights A , Physics E , et al. MacSphere:
Design and Implementation of Processes and
Components for Optical Beam Forming Networks.
2023.
E Güllü, Demirdelen T , Gurdal Y , et al. Experimental
and theoretical study: Design and implementation of a
floating photovoltaic system for hydrogen
production[J]. International Journal of Energy
Research, 2022, 46(4):5083-5098.
Monteverde J J , Llorens J S . Design and Implementation
of a Wireless Sensor Network for Seismic Monitoring
of Buildings. 2021.
Zhou B , Du M , Chen Z , et al. Design and Implementation
of Intelligent Security Robot Based on Lidar and Vision
Fusion*[J]. 2022.
Lilo M A , Mashhadany Y . Intelligent system for fault
detection of phase failure and temperature[J]. IOP
Conference Series: Materials Science and Engineering,
2021, 1090(1):012030 (10pp).
Dai L , Wang W , Zhou Y . Design and Research of
Intelligent Educational Administration Management
System Based on Mobile Edge Computing Internet[J].
Mobile Information Systems, 2021.
INCOFT 2025 - International Conference on Futuristic Technology
314
