
Design and Implementation of a Student Behavior Analysis System
Based on the Kmeans Algorithm
Aifeng Zhong
Wuhan Technology and Business University, Wuhan, Hubei, China
Keywords: Design, Student Behavior Analysis System, Kmeans Algorithm.
Abstract: Aims to deepen the application of digital teaching material in the teaching process and improve its quality,
ensure the quality of digital teaching material continuous optimization, this study to "nursing management"
this course as a research object, for 497 students in a semester of 36 kinds of different digital teaching materials
use behavior data collection. After regularization processing, the classification of behavioral data is completed
by K mean algorithm. On the basis of the classification results, this paper makes an in-depth analysis of
different types of digital teaching materials, and puts forward a personalized optimization scheme. This
method effectively solves the problem that cannot be accurately analyzed in the context of large data volume,
and reduces the large errors that may be generated by manual analysis. The classification results of resources
are used to determine the quality of digital teaching materials, which provides a solid analysis foundation for
the continuous progress of the quality of teaching materials.
1 INTRODUCTION
The Blueprint for the Development of China's Digital
Economy during the 14th Five-Year Plan Period
clearly guides the direction of continuously
promoting the healthy development of "Internet plus
education", that is, the continuous radical reform and
innovation activities of education modernization. The
main position of teaching innovation is located in the
classroom. With the rapid development of
information technology, digital teaching materials are
more and more used in daily classroom teaching. The
so-called digital teaching resources refer to the
educational materials that can be used in the
multimedia computer system or network environment
and can realize resource sharing after digital
processing. In the process of digital teaching
transformation, we need to collect, analyze and use
data in the content of teaching plans, learning
materials, teaching activities and many other levels,
so as to promote the digitalization of teaching
activities, create a ubiquitous network learning
environment, and promote the extensive
implementation of innovative teaching mode. In
addition, the "Ministry of Education on the
construction of first-class undergraduate curriculum
guidance" also explained this. Teaching materials
should keep up with the trend of The Times, and
should have the characteristics of diversification.
From this perspective, digital education resources
have been widely respected in many institutions of
higher learning in China, and have gradually evolved
into important materials that cannot be missing in
teaching activities, providing a solid foundation for
the improvement and innovation of teaching methods.
With the popularization of e-learning materials,
online learning students have produced a lot of
behavior records, such as records of watching videos,
interactive click logs, discussion courses and other
(Zaky, Ahmed et al. 2023). These behavioral records
reflect the students 'learning effectiveness (Li, 2023),
which provides scientific research data support for the
analysis of students' learning models. Many
researchers have used this kind of data to carry out
several studies, including analyzing the change of
students 'online learning attitude (Deng, 2022) ,
grouping students into groups according to students'
characteristics (Dolbier, Vanacore, et al. 2023) , and
predicting students' performance.
Kmeans As a classic representative of partitioning
clustering method, the algorithm (Wang, 2022) has
been applied in many fields due to its efficient and
simple and rapid convergence of implementation
process, including the evaluation and analysis of
Zhong, A.
Design and Implementation of a Student Behavior Analysis System Based on the Kmeans Algorithm.
DOI: 10.5220/0013539700004664
Paper published under CC license (CC BY-NC-ND 4.0)
In Proceedings of the 3rd International Conference on Futuristic Technology (INCOFT 2025) - Volume 1, pages 263-268
ISBN: 978-989-758-763-4
Proceedings Copyright © 2025 by SCITEPRESS – Science and Technology Publications, Lda.
263

student performance , the of daily temperature load
mode and the identification of key edges in
machining . The main advantage of this algorithm is
that the output result is clear, which is easy to reveal
the potential patterns. Based on the principle of
student-oriented, this paper comprehensively
considers students' learning feelings, so as to promote
the reasonable allocation of digital teaching
resources. By analyzing the behavioral data of
students' interactive digital teaching resources, this
study uses the Kmeans clustering algorithm in
unsupervised learning to obtain the classification
results. In-depth analysis of these classification
results, and through continuous observation of the use
of different categories of digital teaching resources,
aims to ultimately promote the improvement of the
quality of teaching resources.
2 DESCRIPTION OF THE
RELATED PROBLEMS
2.1 Analysis of the Constraint
Parameter Data of the Student
Behavior Analysis System
Based on the Kmeans algorithm, the sampling model
of the constraint parameters of the student behavior
analysis system is established, and the nonlinear
information fusion is combined with the time series
analysis, so as to carry out the statistical analysis of
the student behavior analysis system. The constraint
index parameters of the student behavior analysis
system belong to the non-linear time series. Establish
the distribution model of the practice evaluation index
of students' behavior analysis system. The constraint
parameter model of differential equation expression
system is expressed as:
[]
nn
tntzhtntxx
ω
+Δ+=Δ+= )()(
00
In the high-dimensional feature distribution
space, the training subset of the evaluation
characteristics of the student behavior analysis
system is obtained to meet the following conditions:
jidiag
iiT
≠∀==
,),,,,(
21
λδδδδ
(1)
L
i
si
vVS
1=
−=
(2)
)1(
1 nnn
xxx −=
+
μ
{}
ItduXtutuU ∈≤∈= ,)(|)( ,
It is the solution of the statistical model of the
effect evaluation of students' behavior analysis
system, which meets the decomposition conditions of
the initial characteristics. The information flow model
of Kmeans algorithm practice based on the previous
statistical measurement value is expressed as follows:
{}
{}
3,0),,,(
)()()()(
0)()(
121
2
1
≥≡
=+=
==
−
kc
rnxnxEc
nxEc
kkx
x
x
τττ
τττ
τ
The teacher strength level of the student behavior
analysis system and the distribution level of the
resources of the student behavior analysis system
need to meet the continuous functional condition, that
is, the convergence solution of the student behavior
analysis system evaluation, and the constraint
condition is expressed as follows:
22
2
1
-)(ln)(
σωωω
==Ψ
xx
Φ
According to the information flow model of the
effect of student behavior analysis system, the data
distribution model of sampling sequence is
established to provide the data input basis for the
practice method of student behavior analysis system.
2.2 Quantitative Recursive Analysis of
The Student Behavior Analysis
System Based on the Kmeans
Algorithm
The data model analysis of the student behavior
analysis system is conducted through quantitative
recursive analysis, and the control objective function
predicted by the student behavior analysis system is
expressed as follows:
p
AaBbDdPp
pdba
x
Vx
pdba
∈∈ ∈ ∈
,,,
,,,
max
BbSKRxts
bw
b
Aa
bw
p
DdPp
pdba
∈≤
∈∈∈
),(..
,,,
The Kmeans algorithm is used to carry out
quantitative recursive evaluation of students'
behavior analysis system level. It is assumed that
INCOFT 2025 - International Conference on Futuristic Technology
264
under the historical data of student behavior analysis
system distribution in the initial value of disturbance
characteristics, the prediction probability density
functional of student behavior analysis system is
expressed as follows:
)()( tKxtu
ee
=
All the K nearest neighbor sample values of the
output index distribution data of the student behavior
analysis system are expressed as:
),(),(
1 ji
KNNd
iJ
CdydxSimP
i
∈
=
The objective function of the distributed data flow
of the student behavior analysis system is established
by the data and information fusion, that is, the
objective function of the data clustering is expressed
as follows:
2
11
)),(
ik
n
k
c
i
m
ik
dVUJm (
==
=
μ
By expanding the distribution sequence of the
student behavior analysis system index and
combining with the K-value finding method, the
results of quantitative recursive feature extraction of
the student behavior analysis system are expressed as
follows:
=
−
=
−
++=
MAAR
M
i
jnj
M
i
inin
bxaax
11
0
η
3 ANALYSIS OF THE
EXPERIMENTAL RESULTS
Aiming at grasping the specific use of students 'digital
teaching resources, this study selects a course on the
online teaching platform of a college, and collects and
analyzes the relevant behavior information of
students' contact with the digital teaching resources
on the platform during this period.
3.1 Acquisition of the Behavioral Data
In this study, we selected the required undergraduate
"nursing management" as the survey object to make a
community analysis of the collected student behavior
information. This course has diversified teaching
arrangements, including online self-study, classroom
teaching, clinical operation and social application,
etc., and integrates the education mode of "four-in-
one type, double platforms and three steps", with
massive digital teaching materials; many courses
have been successfully held on the network platform,
which can accommodate 400 to 500 students to
register for study. The article examines in detail the
five key teaching interaction data of students in the
latest semester, such as video learning completion
rate, discussion and interaction frequency, classroom
learning frequency, after-school test scores and
homework scores. The video material consists of 32
video learning content in different chapters. Specific
behavioral information data are given in Table 1 in
the text.
Table 1: Student behavioral data
1
Student ID
Video resources
Resources 1
(%)
Resources 2
(%)
... Resource of
32 (%)
2019001 76.4 127.4 ... 50.6
2019002 52.2 50.6 ... 50.3
2019003 100.1 117.5 ... 127.3
2019004 100.1 100.3 ... 100.2
2019005 51.2 50.4 ... 100.2
2019006 100.1 100.8 ... 99.8
2019007 52.3 50.7 ... 100.2
2019008 100.4 100.3 ... 127.3
... ... ... ... ...
Here, by ij represents the specific values of
students numbered i in the j th resource, with details
given in Table 1. The video resources produced in 32
different chapters constitute the video textbook,
which tracks the students 'learning behavior by
recording the completion percentage of the material.
The course interaction can be observed by the number
of discussion topics students participate in the course.
which reflects the learning enthusiasm and the
difficulty of the course, and the chapter quiz and
homework results directly demonstrate the students'
learning results, which come from the students'
scoring during the chapter examination and
completing the course assignments.
3.2 Data Normalization
Chart 1 reveals that the student behavior data
extracted from the network learning platform presents
a heterogeneity. Given that the different categories of
teaching resources are equally important, we
standardized these data to a range of 0 to 100. Specific
to each resource, its standardized computational flow
is described below.
Design and Implementation of a Student Behavior Analysis System Based on the Kmeans Algorithm
265
The digital identification of the learning progress
of the film reflects the completeness of the viewing
material, that is, when the value reaches or exceeds
100%, it can be considered to have mastered the
learning material thoroughly.
The number of discussions, the learning
frequency of each chapter, chapter testing, and job
scores are standardized, in which the term max (yj)
refers to the highest value of the j th type of resource.
3.3 Using Kmeans, the Algorithm for
Clustering
After the collected data was standardized processing,
the classification was implemented based on the
Kmeans algorithm. The specific operation steps are
as follows:
Algorithm input, namely the resource value set y.
The output obtained after the algorithm includes
the conclusion of the cluster as well as the error
squared and SSE of the cluster.
After normalization operation, dataset y was
transformed into dataset X containing behavioral
samples of n students.
The number of clusters k was determined, with the
behavioral dataset X as input, following the
algorithmic steps presented in Figure 1 to perform
data aggregation.
The results of the cluster analysis and its
corresponding squared error sum SSE are provided as
the resulting output.
Increase the cluster number k and recluster.
Outputs all the clustering results that satisfy the
criteria.
3.4 K Value Determination and Most
Clustering Results
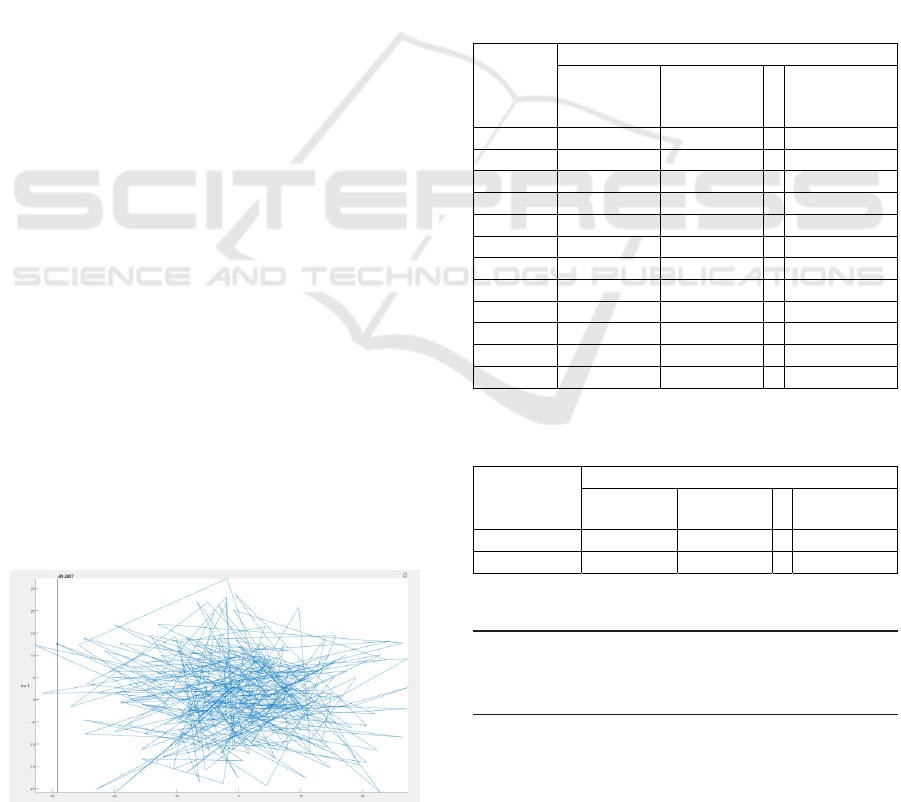
Relying on the Kmeans algorithm to implement the
cluster analysis of action data, which is shown in
Figure 2. The horizontal axis in the graph represents
the number of clusters k, while the vertical axis
corresponds to the sum of error squares i. e., SSE.
1 Figure 1: Cluster error sum of squares
By analyzing the sum of error squares of each k
option, we can observe a special turning point in the
SSE change curve, that is, the "elbow" point, where
the decrease slows down significantly at this point, so
the k value corresponding to this point is determined
to be the optimal solution. Based on this optimal k
value, the student behavioral data can be effectively
divided into 12 categories. When the number of
selected clusters is 12, the cluster centers of each
other category are presented according to the
information in Table 2. With the number of clusters
of 12, the mean versus standard deviations of each
cluster center are detailed in Table 3. Meanwhile,
when the number of clusters is set as 12, the
proportion of students in different clusters and their
distribution are shown in Table 4.
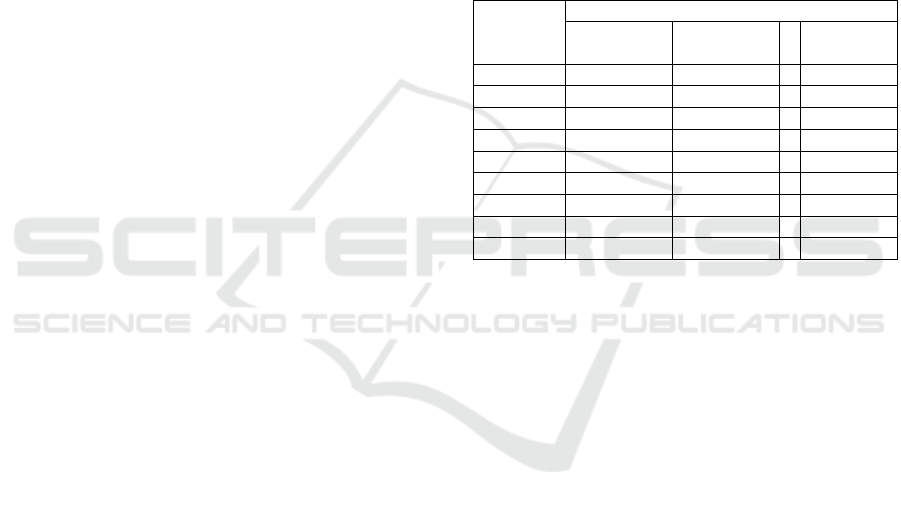
Table 2: Values of cluster center points 2
Cluster
serial
numbe
r
Video resources
Resource 1 Resource 2 ... Resources 32
1 100.00 96.67 ... 25.10
2 98.57 97.63 ... 75.89
3 32.90 9.88 ... 10.08
4 69.95 58.85 ... 48.06
5 95.49 92.33 ... 93.87
6 97.40 97.49 ... 9.73
7 97.38 98.00 ... 97.71
8 87.79 90.30 ... 64.84
9 96.78 93.72 ... 90.13
10 99.43 99.69 ... 99.00
11 97.49 97.17 ... 6.32
12 83.48 76.91 ... 83.81
Table 3: Mean and standard deviations of cluster central
points 3
Numerical
type
Video resources
Resource 1 Resource 2 ... Resources 32
mean 88.06 84.05 ... 58.71
standard erro
r
18.64 25.04 ... 35.45
Table 4: Number of students in each cluster
Cluster
serial
number
1 2 3 4 5 6 7 8 9 10 11 12
Number
of
clusters
6 41 8 33 39 22 95 28 18 172 12 23
INCOFT 2025 - International Conference on Futuristic Technology
266

proportio
n (%)
1.2
1
8.2
5
1.6
1
6.6
4
7.8
5
4.4
3
19.1
1
5.6
3
3.6
2
34.6
1
2.4
1
4.6
3
4 CONCLUSION ANALYSIS
Student behavior data was adjusted to a range of 0 to
100 for all resources, and 60 points were used as the
eligibility standard. Referring to Table 2 to Table 4,
taking the course "Nursing Management" as an
example, the Kmeans algorithm is used to analyze the
behavior of students in digital teaching resources as
follows.
4.1 Video Teaching Resources
By comparing the cluster center data in Table 2, the
center values of three clusters with serial numbers 5,7
and 10 respectively are higher than 60, and the
proportion of students corresponding to the fourth
table) is 61.57%, while the center values of two
clusters marked 1 and 3 are generally less than 60, and
the resource value decreases significantly in some
areas, and the proportion of these students is 2.82%.
Such data show that most students hold a positive
attitude towards video teaching resources, show a
certain enthusiasm for learning, and can complete the
task of video learning. Nevertheless, we still need to
pay attention to the use of video resources in the two
clusters of serial numbers 1 and 3, actively collect
their feedback, and optimize and adjust the video
resources according to the feedback, so as to improve
the overall quality of teaching resources.
According to the center of figure three point data
vertical research, we found that 28 and 32 resources
related cluster center value of the average are not
more than 60, at the same time the central numerical
fluctuation is relatively high, this trend shows the
students on the two resources, and the difference
between students, so the research team need for the
two teaching video appropriate modification and
optimization.
4.2 Number of Discussions
According to table 2, table 3 data analysis, found that
the core data are not break the boundaries of 60, at the
same time the standard deviation performance is low,
it shows that most students lack on the behavior of
posts, course discussion enthusiasm is not enough,
and these discussion frequency directly mapping the
student initiative in course interaction, it became the
key channel communication between time and space
between teachers and students. Therefore, course
makers need to reconsider how to set the discussion
topic and how to plan the content of the topic
discussion, enhance the role of teachers in the
guidance of students' discussion and q & A, and
enhance the activity of the teacher team in the q & A
discussion page.
4.3 Number of Chapter Studies
After observing the details of Table 2 and Table 3, it
is found that the average number of times that
students use in the learning process of chapters is low,
and the standard deviation of their distribution is
relatively low, showing that learners can master the
teaching resources with a small number of attempts.
Students using the platform; however, whether the
course resources are challenging, which may absorb
the content and key points of the course without
repeated learning, which indicates that teachers
should consider the depth and difficulty of designing
course resources.
4.4 Section Test
In Table 1 and Table 2, except for cluster 3, the
chapter test scores of each central point exceeded 60
points, and the standard deviation showed a high
degree of dispersion. This shows that most students
have a good grasp of the chapters. However, for the
eight students in Cluster 3, the should fluctuations,,
should to particularly attention.
4.5 Homework
According to the data analysis of the second and third
tables, the scores of all job nodes are generally above
60 points, and the score volatility is low, meaning that
the standard deviation is small. This suggests that the
performance assessment conducted through the
submitted assignments reflects the students' relatively
good mastery of the course. In addition, the digital
education content provided by the platform plays a
positive role in improving students' learning
effectiveness.
5 CONCLUSIONS
In the course of "nursing management", we collected
data on the use of digital teaching resources within a
semester and standardized the data. Then, the Kmeans
algorithm is used to cluster the data, and combine the
error square sum SSE and the "elbow" point method
Design and Implementation of a Student Behavior Analysis System Based on the Kmeans Algorithm
267

to determine the most appropriate clustering number
of clusters and the most optimal clustering effect.
Through thorough analysis of clustering results, we
find that the use of video resources is generally good,
but the 28th and 32nd resources need to be further
optimized; students 'participation in the discussion
shows the lack of the course in encouraging students'
communication and interaction; the challenge of the
course content needs to be improved; and it can
effectively reflect students' learning situation. The
improvement proposed by the study aims to
continuously improve the quality of digital teaching
resources.
REFERENCES
Franca, R. L. S., Silva, F. C., Costa, F. B., Strunz, K., &
Rajapakse, A. D. (2023). One-terminal traveling wave-
based transmission line protection for lcc-hvdc systems.
Electric Power Systems Research, 223
Tan, S. N., Liu, J. L., Du, X., Yang, H. J., & Cao, Y. L.
(2023). Stability analysis of two-terminal hvdc
transmission systems using siso open-loop gains.
Frontiers in Energy Research, 11
Wang, D. J., Zhao, J. B., Wang, C. Y., Zhu, X. Y., Zhou, Z.
X., Li, W. B., . . . Meng, J. H. (2023). An adaptive linear
active disturbance rejection control method for hvdc
transmission system. Energy Reports, 9, 3282-3289.
Wang, Y. W., Wu, L. J., & Chen, S. Y. (2023). A simplified
model of the hvdc transmission system for sub-
synchronous oscillations. Sustainability, 15(9)
Wenhong, W., Wei, P., Cencen, H., Baiqun, R., & Guobing,
L. (2023). The improved 2dofs-pll for mmc-hvdc
transmission system. Frontiers in Energy Research, 11
Zaky, M. S., Ahmed, H. E., Elsadd, M., & Elgamasy, M.
(2023). Protection of hvdc transmission systems for
integrating renewable energy resources. Engineering
Technology & Applied Science Research, 13(6),
12237-12244.
Li, Z. C. (2023). Traffic accident prediction based on an
artificial bee colony algorithm and a self-adaptive fuzzy
wavelet neural network. International Journal of
Computing Science and Mathematics, 17(3), 254-265.
Deng, H. (2022). Construction of college english teaching
information resource integration model based on fuzzy
clustering algorithm. Mobile Information Systems,
2022
Dolbier, C. L., Vanacore, S. M., Conder, L., & Guiler, W.
(2023). A mixed-methods investigation of covid-19
pandemic-specific stress in college students. Journal of
American College Health.
Wang, W. (2022). College english teaching platform
optimization under cross-media and mobile internet
environment. Computational Intelligence and
Neuroscience, 2022
INCOFT 2025 - International Conference on Futuristic Technology
268
