
Abstract of Power Plant Equipment Defect Trend Analysis Method
Based on Apriori Algorithm
Fanqi Huang, LingLing Ming, Qiang Liu, Chuanhe Sun and Lixue Liang
China Southern Power Grid Energy Storage Co Ltd, China
Keywords: Apriori Algorithm, Power Plant Equipment Defects, Trend Analysis.
Abstract: As an important supporting industry in the national economy, the stability of equipment operation in the power
industry is extremely important. However, defects in power plant equipment will always constrain power
productivity. In this paper, this paper proposes a method for analyzing the defect trend of power plant
equipment based on Apriori algorithm. Based on the collection and preprocessing of important data such as
maintenance records and fault reports of power plant equipment, the Apriori algorithm is used to complete
the mining of the correlation rules between equipment defects, and carry out in-depth analysis of these rules,
so as to find the common factors that cause equipment defects and predict future trends. Finally, certain
countermeasures should be put forward to facilitate the scientific improvement of power plant equipment
management, improve the reliability of its equipment operation, and ensure the safety and stability of power
production.
1 INTRODUCTION
The operation of equipment in the power industry
needs to maintain a certain degree of reliability,
stability and safety. However, judging from the
current situation, due to the aging of equipment, the
influence of environmental factors, improper
operation, etc. (Atilgan, 1990), the problem of power
equipment defects always exists and cannot be
solved, which will have a direct impact on the
reliability and safety of power production (Crouch,
1993). Therefore, how to effectively prevent and
control equipment defects has become a key problem
that power companies need to solve as soon as
possible. In this regard, this paper will propose a
method to better promote the further optimization of
power plant equipment management (Esterby, 1993).
2 RESEARCH METHODS
First, Theoretical Analysis Method. In the initial part
of this paper, the researcher uses the theoretical
analysis method to analyze the solution strategy of
power plant defects, and based on this, the Apriori
algorithm is introduced (Hess, A and Iyer, H, et al.
2001), and then the algorithm is applied to the
analysis of power plant equipment defect trends.
Based on the elaboration of this theory, this paper can
better analyze the defect data in power plant
equipment, find the correlation between equipment
faults, and provide a basis for subsequent prediction.
In the process of research, this paper combines an
example of power plant equipment defects to carry
out a detailed research process, so as to better get
closer to the research topic (Kisi and Santos, et al.
2001). This paper mainly analyzes the data collection
and preprocessing, the mining of association rules
and trend prediction in this case, which can be
conducive to the effective combination of theory and
practice, and shows people vivid research results
(Okabe, 1982). When analyzing the association rules
and predicting the trend, this paper not only finds
some patterns from the data, but also puts forward
targeted and reliable countermeasures and
improvement suggestions based on actual business
scenarios (Porter and Rao et al. 2022). The
application of this method can ensure that the
research results are further close to the actual needs,
and its operability is also relatively strong. Based on
these research methods, this paper will dig deep into
the various valuable information contained in the
defect data of power plant equipment, and provide
reliable data and theoretical basis for power plant
116
Huang, F., Ming, L., Liu, Q., Sun, C. and Liang, L.
Abstract of Power Plant Equipment Defect Trend Analysis Method Based on Apriori Algorithm.
DOI: 10.5220/0013536500004664
Paper published under CC license (CC BY-NC-ND 4.0)
In Proceedings of the 3rd International Conference on Futuristic Technology (INCOFT 2025) - Volume 1, pages 116-121
ISBN: 978-989-758-763-4
Proceedings Copyright © 2025 by SCITEPRESS – Science and Technology Publications, Lda.

managers, so as to help people solve related problems
(Rokaya and Al Azwari, 2022).
3 RESEARCH PROCESS A. DATA
COLLECTION
3.1 Data Sources and Collection
Methods
First, equipment maintenance records. First of all,
from the power plant maintenance management
system, obtain the maintenance records of the
equipment, which mainly include the name of the
equipment and the maintenance time, maintenance
personnel, maintenance type and other information.
The result is shown in formula in Equation 1.
22 2
0
d ln( )
()
d
x
kn k
fz
z
−
=
(1
)
Secondly, the use of automation means, such as
writing scripts, the use of data capture tools, etc., to
regularly extract some of the latest maintenance
record data from the maintenance management
system; First of all, collect the fault reports submitted
by the employees and operators of the power plant,
which need to contain the specific description of the
equipment failure, the time of occurrence, and the
scope of impact (Sloane, 1982). The result is shown
in formula in Equation 2.
1
2
000
() [()] exp j ()d
z
Tz E nz k nz z
−
=
(2)
it is necessary to set up an online fault reporting
system to facilitate employees, so that they can report
equipment defects at any time, and ensure the
timeliness and integrity of their data; First of all, the
equipment should be inspected regularly, and the
inspection results should be recorded, such as the
operation status and abnormal conditions of the
equipment, potential problems, etc (Thevi. and
Schanzer, 2010). Secondly, the electronic inspection
system can be used to collect inspection records, or
the paper form can be used to record them, and then
they can be digitally processed. The result is shown
in formula in Equation 3.
()
// // 0
1
x
E
RE=+
(3)
First, the specific operation of the power plant
equipment is recorded, such as the daily equipment
operation time and various parameters such as
temperature. Secondly, based on the equipment
control system and data acquisition equipment, the
operation data of the equipment is obtained in real
time and stored as log files (or database records). The
result is shown in formula in Equation 4.
// 0y
E
RE
⊥
=
(4
)
3.2 Data Field
In the process of data collection, people should design
some appropriate numerical fields, which are
conducive to subsequent data analysis and modeling.
The result is shown in formula in Equation 5.
0
// 0
0
x
HRE
ε
μ
⊥
=
(5
)
The data fields need to include the device
name/number, the type of fault (mechanical fault,
electrical fault, etc.), and the time when the fault
occurred (year, month, day, etc.). hours, minutes,
seconds), fault description, maintenance measures,
maintenance personnel, equipment parameters (such
as temperature or pressure, etc.), Equipment running
time, inspection time and inspection results, etc. The
result is shown in formula in Equation 6.
()
0
// // 0
0
1
y
HRE
ε
μ
=−
(6
)
3.3 Data Quality Control
In order to ensure the quality and reliability of the
data, these measures need to be taken: first, regularly
check and verify the data, find and correct the data
with errors and missing problems, second, carry out
necessary cleaning and preprocessing for the data,
such as removing duplicate data or dealing with
outliers, etc., and third, establish a reasonable data
review and review mechanism to ensure a high degree
of consistency and accuracy of the data. The result is
shown in formula in Equation 7.
Abstract of Power Plant Equipment Defect Trend Analysis Method Based on Apriori Algorithm
117
()
0
// // 0
0
1
y
HRE
ε
μ
=−
(7
)
3.4 Data Storage and Management
In order to facilitate subsequent data analysis and
mining, the collected data should be reasonably
stored and managed to improve the effectiveness of
storage and management. First, database storage. All
data is stored in a database for easy access and
management. Second, file backup. Regularly and
effectively back up data to prevent data loss and
damage. Third, access control. Carry out the
necessary permission control on the data to ensure
that only authorized personnel can access and modify
the data. Therefore, data collection is a crucial step in
the process of trending power plant equipment
defects. Only when the collected data is sufficient and
accurate can it provide a solid foundation for
subsequent data analysis and model building. The
result is shown in formula in Equation 8.
// 0y
E
RE
⊥
=
(8)
4 DATA PREPROCESSING
4.1 Data Cleaning
First, remove duplicate data. Check whether there are
duplicate records in the dataset, such as device name,
occurrence time, fault type, and other consistent data,
and delete them; second, deal with missing values.
For records with missing values in certain fields,
more measures need to be taken, such as removing
records with real value or replacing missing values
with averages and medians, replacing missing values
with mode, using machine learning models to predict
missing values, and third, dealing with outliers.
Outliers in the dataset can be identified and
eliminated, such as data records where the failure
occurred beyond a reasonable range. Outliers can be
detected using statistical analysis or machine learning
methods, for example.
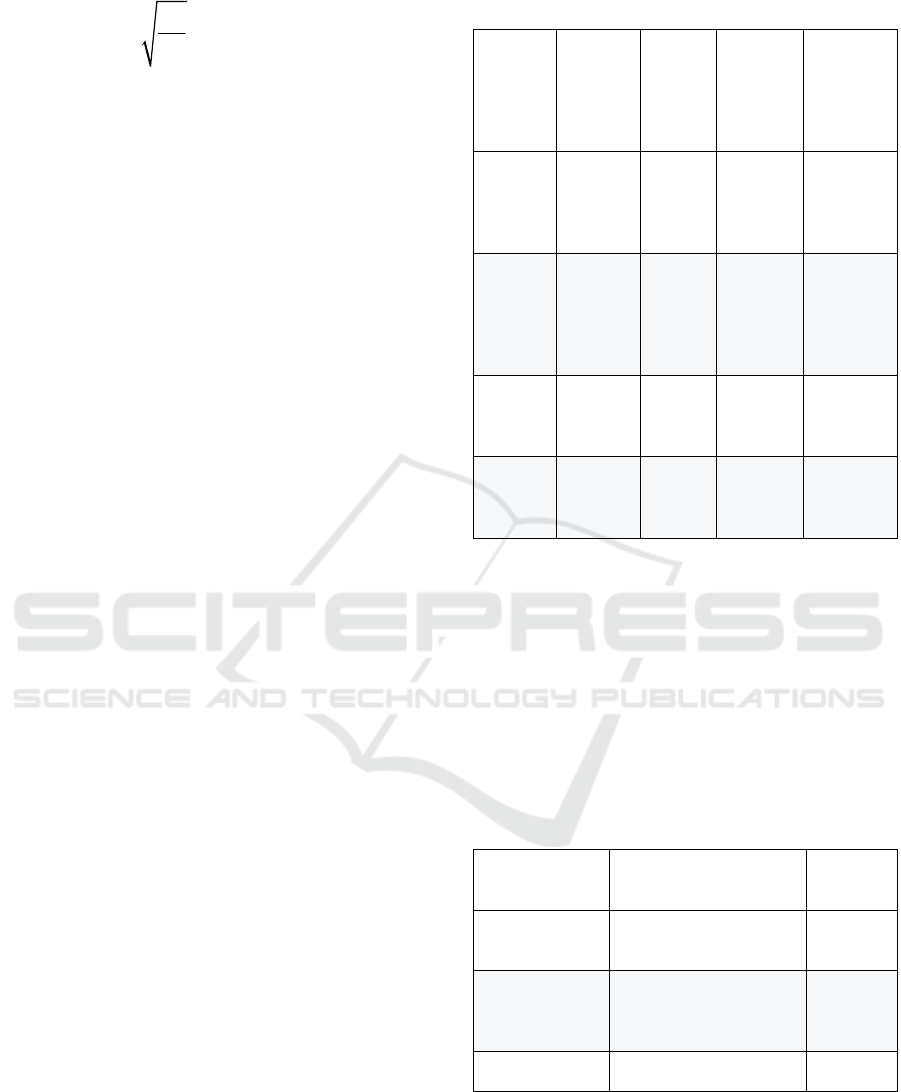
Table 1: Overall defect analysis of the equipment
serial
numb
er
The
name
of the
devic
e
Che
ck
the
date
The
type
of
defect
Defect
level
1
Heati
ng
syste
m
2023
-05-
01
Dense
pores
Moder
ate
2
Flush
the
water
syste
m
2023
-05-
10
Not
melte
d
Mild
3
Unit
A
2023
-05-
15
Not
solder
e
d
Severe
4
Unit
B
2023
-05-
20
Hole
decay
Moder
ate
4.2 Data Conversion:
Convert the data into the format required for the
Apriori algorithm. First, encode various discrete data
such as equipment name or fault type into numbers
and symbols; second, convert time data into discrete
time periods, such as monthly and quarterly statistics;
third, for continuous data, we should carry out
discretization processing, and divide the values into
different intervals and different levels.
Table 2: Repair results
Fix the
situation
Reason for the
extension
remark
Fixed
The construction
p
eriod is insufficient
not
To be fixed
The quality of
maintenance is not
strict
not
Fixe
d
not not
4.3 Feature Engineering
First, based on business requirements, some new
characteristic variables can be derived, such as
equipment failure frequency and mean time between
failures, etc., and second, the original features are
INCOFT 2025 - International Conference on Futuristic Technology
118
combined and transformed to obtain representative
features with the best prediction ability.
4.4 Data Set Segmentation
Directly divides the dataset into training sets and test
sets, so as to facilitate subsequent model training and
evaluation.
Based on the above data preprocessing, the data
quality and practicability can be guaranteed, so as to
lay a solid foundation for the subsequent analysis of
the Apriori algorithm. In addition, based on feature
engineering, the valuable information contained in
the data can be further mined and the accuracy and
reliability of the analysis process can be improved.
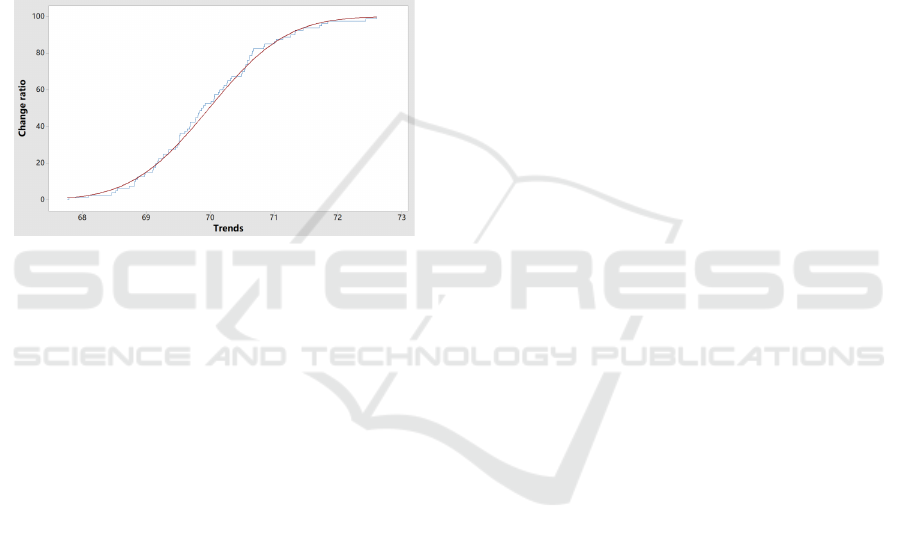
Figure 1: Shows the overall change ratio
The mining of association rules.is based on the
Apriori algorithm, which can carry out association
rule mining on the preprocessed data. As a classic,
frequent itemset mining algorithm, the Apriori
algorithm can discover the collection of items that
frequently appear in the dataset and generate
association rules. First, frequent itemset mining. The
Apriori algorithm can be used to mine frequent
itemsets on the preprocessed data. The algorithm is
based on an iterative approach and discovers frequent
itemsets, i.e., set items that often occur together. To
do this, people need to set a minimum support
threshold to filter out the set of frequent items to
ensure that people can find reliable association rules
and improve their representativeness, and second,
generate association rules. Correlation rules should be
generated based on the set of frequently mined items
and using metrics such as confidence level.
Confidence is also a measure of the credibility of a
rule, which indicates the probability that a conclusion
condition will occur at the same time if a precondition
occurs. In addition, based on the setting of the
minimum confidence threshold, you can also filter
out rules with strong correlation. These rules allow
people to better recognize and understand the
potential relationships between different attributes in
the data, and thirdly, rule evaluation and screening.
Evaluate and filter the generated association rules.
Not only do you have to have confidence, but you also
have other metrics, such as lift. Then, the rules are
sorted and filtered to find the high-quality rules that
have greater significance and value for business
decisions. Firstly, the excavated association rules are
visually displayed, so as to intuitively present the
relationship between different attributes and their
influence. Secondly, the business decision-makers
and domain experts are explained accordingly, and
analyzed and interpreted in combination with the
actual business scenarios.
4.5 Analysis of Association Rule
Interpretation and Classification.
First, conduct a careful analysis of the excavated
correlation rules and understand the meaning behind
each rule and its business implications. Secondly,
according to the characteristics of the rules, they are
classified and sorted, for example, according to the
type of equipment, the type of failure, the degree of
impact and other dimensions, and second, the analysis
of relevance. First, based on the rules after
classification, we can find the correlation between
different devices and devices. For example, some
fault types tend to occur on some devices at the same
time, or some devices often cause other device
failures. Secondly, some potential reasons behind
these associations are analyzed, such as whether there
is a device-equipment dependency or process flow,
common components, etc., and thirdly, the mining of
common factors. Conduct a deeper analysis of the
rules to uncover common factors that may contribute
to the occurrence of equipment defects. These factors
may include environmental conditions and improper
operation, aging equipment, etc. In addition, based on
the comparison and analysis of different association
rules, it is necessary to find out the specific
performance and influence degree of these common
factors in different equipment failures; First, the
historical data is combined with the mined correlation
rules to predict the trend of equipment defects that
may occur in the future. Secondly, the changes in the
time dimension in the rules are analyzed to find out
whether there is a significant increase or decrease
trend in the types and frequency of certain faults. The
results of the analysis are fed back directly to the
management of the power plant, so as to provide a
certain basis for the formulation of more targeted
maintenance plans and preventive measures. At the
same time, the analysis results are continuously
tracked, and the maintenance strategy can be adjusted
Abstract of Power Plant Equipment Defect Trend Analysis Method Based on Apriori Algorithm
119
at any time to ensure that it can respond to the defect
trend of the equipment. Based on the in-depth
analysis of association rules, it can help people to
fully understand the internal relationship between
power plant equipment defects, find out the common
influencing factors of problems, and predict the future
or trend, so as to provide sufficient scientific
decision-making support for power plants.
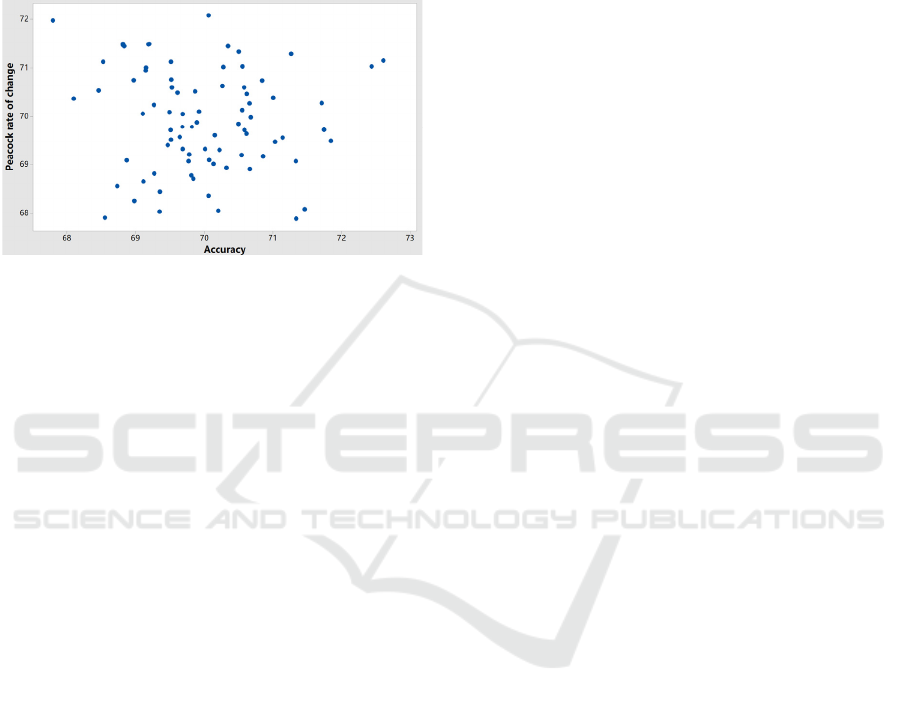
Figure 2: Accurate rate of change
5 ACTUAL CASE ANALYSIS
5.1 Background:
The boiler equipment in a thermal power plant has
serious defects, which affects the safe and stable
operation of the unit. Based on this research, this
paper uses the Apriori algorithm to mine various
important correlation rules, and now further analyzes
these rules to predict the future trend of contingent
equipment defects, and proposes certain
countermeasures: first, trend prediction. Based on the
in-depth analysis of the excavated correlation rules, it
can be seen that, firstly, rule 1 - "Boiler pipe corrosion
fault -> boiler water level abnormality". The support
and confidence of this rule have been increasing year
by year in the last 2 years. Combined with historical
data, it is predicted that abnormal boiler water level
failures caused by pipe corrosion problems will be
further exacerbated in the next 1 year. Secondly, Rule
2 – Boiler Flue Blockage -> Abnormal increase in
boiler temperature. The support and confidence of
this rule have remained relatively high in the last three
quarters, and it shows obvious seasonal fluctuations.
That is, in the autumn and winter of each year, it is
noticeably more prominent. Therefore, it can be
predicted that in the next 1 year, the temperature
anomaly caused by the blockage of boiler pipes will
become more serious in the autumn and winter; Based
on the trend prediction conclusions, this paper
proposes these countermeasures: a. Increase the
regular inspection and maintenance of boiler pipes,
find and repair corrosion problems in time, and avoid
water level abnormalities caused by pipeline failures.
b. Before the autumn and winter of each year,
organize personnel to comprehensively clean the
boiler flue to ensure the smooth flow of the flue, so as
to avoid failure caused by excessive temperature. c.
Establish a comprehensive equipment status
monitoring and early warning mechanism, and grasp
the operation of the equipment in real time, and find
some signs in time. d. Improve the emergency plan,
formulate targeted and reliable emergency response
measures, and improve the efficiency and success rate
of fault handling. e. Strengthen the training of
enterprise personnel equipment maintenance and
operation skills, and improve the professional level
and sense of responsibility of personnel.
6 CONCLUSIONS
OF this paper show that the power plant equipment
defect trend analysis method based on Apriori
algorithm has the following advantages:First, the
correlation between defects and defects of excavated
equipment. Based on the Apriori algorithm to analyze
the maintenance and failure data of power plant
equipment, people can find that there are some
potential correlations between equipment failures,
such as some types of faults tend to occur at the same
time, or some equipment failures will lead to various
failures of other equipment. This can help people
better recognize and understand the internal
mechanism of defects in power plant equipment, and
secondly, identify the common factors that contribute
to defect problems. After analyzing the association
rules, the system can further uncover the common
factors that contribute to the problem of equipment
defects, such as aging or improper operation of the
equipment, environmental conditions, etc. This can
provide a certain basis for the formulation of
subsequent preventive measures, and thirdly, predict
the future defect trend. The system can combine
historical data and the associated rules mined to
predict the future or occurrence of equipment defect
trends, such as certain fault types and fault frequency,
whether they show an increasing or decreasing trend.
This helps people prepare for power plants in
advance, and fourth, improves the effectiveness and
relevance of equipment management. Based on the
previous summary, power plants can develop more
targeted and reliable equipment maintenance plans
and contingency plans, such as increasing inspections
of equipment that are prone to failure or enhancing
INCOFT 2025 - International Conference on Futuristic Technology
120

the prevention of certain types of failures during
specific seasons. This can greatly improve the
effectiveness and relevance of device management.
REFERENCES
Atilgan, T. (1990). An automated-method for trend
analysis. Paper presented at the 9th Symp on
Computational Statistics ( Compstat 1990 ), Dubrovnik,
Yugoslavia.
Crouch, S. R. (1993). Trends in kinetic methods of analysis.
Analytica Chimica Acta, 283(1), 453-470.
Esterby, S. R. (1993). Trends analysis-methods for
environmental data. Environmetrics, 4(4), 459-481.
Hess, A., Iyer, H., & Malm, W. (2001). Linear trend
analysis: A comparison of methods. Atmospheric
Environment, 35(30), 5211-5222.
Kisi, Ö, Santos, C. A. G., da Silva, R. M., & Zounemat-
Kermani, M. (2018). Trend analysis of monthly
streamflows using sen's innovative trend method.
Geofizika, 35(1), 53-68.
Okabe, A. (1982). A qualitative method of trend curve
analysis. Environment and Planning A, 14(5), 623-627.
Porter, P. S., Rao, S. T., & Hogrefe, C. (2002). Linear trend
analysis: A comparison of methods. Atmospheric
Environment, 36(18), 3055-3056.
Rokaya, M., & Al Azwari, S. (2022). Social media data
analysis trends and methods. International Journal of
Computer Science and Network Security, 22(9), 358-
368.
Sloane, C. S. (1982). Visibility trends .1. Methods of
analysis. Atmospheric Environment, 16(1), 41-51.
Thevis, M., & Schanzer, W. (2010). Doping prevention:
Methods, analysis, trend of development. Deutsche
Zeitschrift Fur Sportmedizin, 61(7-8), 153-156.
Abstract of Power Plant Equipment Defect Trend Analysis Method Based on Apriori Algorithm
121
