
Robots Performance Monitoring in Autonomous Manufacturing
Operations Using Machine Learning and Big Data
Ahmed Bendaouia
1,3 a
, Salma Messaoudi
2
, El Hassan Abdelwahed
2 b
and Jianzhi Li
1,3
1
Institute for Advanced Manufacturing (IAM), University of Texas Rio Grande Valley, U.S.A.
2
Cadi Ayyad University, UCA, Faculty of Sciences Semlalia, Computer Systems Engineering Laboratory (LISI),
Marrakech, Morocco
3
Manufacturing and Industrial Engineering Department, University of Texas Rio Grande Valley, U.S.A.
Keywords:
Additive Manufacturing, Autonomous Experimentation, Fault Detection, Machine Learning, Deep Learning,
Anomaly Detection, Predictive Maintenance.
Abstract:
Additive manufacturing has revolutionized industrial automation by enabling flexible and precise production
processes. Ensuring the reliability of robotic systems remains a critical challenge. In this study, data-driven
approaches are employed to automatically detect faults in the UR5 robot with six joints using Artificial In-
telligence. By analyzing sensor data across different combinations of payload, speed, and temperature, this
work applies feature engineering and anomaly detection techniques to enhance fault prediction. New features
are generated, including binarized anomaly indicators using the interquartile range method and a difference-
based time feature to account for the sequential and irregular nature of robot time data. These engineered
features allow the use of neural networks (including LSTM), Random Forest, KNN, and GBM models to clas-
sify anomalies in position, velocity, and current. A key objective is to evaluate which anomaly type is the
most sensitive by analyzing error metrics such as MAE and RMSE, providing insights into the most critical
factors affecting robot performance. The experimental findings highlight the superiority of Gradient Boost-
ing Machine and Random Forest in balancing accuracy and computational efficiency, achieving over 99%
test accuracy while maintaining short training times. These two models outperform the others, which show
a noticeable gap either in training time or test accuracy, demonstrating their effectiveness in improving fault
detection and performance monitoring strategies in autonomous experimentation.
1 INTRODUCTION
Industrial robotics has become a cornerstone of mod-
ern manufacturing, enabling automation, precision,
and efficiency across various domains, including ad-
ditive manufacturing. The increasing complexity
of robotic systems demands robust fault detection
mechanisms to ensure reliability, reduce downtime,
and optimize predictive maintenance. Autonomous
robotic systems, such as the UR5 robot, operate un-
der dynamic conditions involving variations in pay-
load, speed, and temperature. These factors signif-
icantly influence system behavior, leading to unex-
pected anomalies that, if undetected, may compro-
mise production quality and system longevity.
Recent advancements in machine learning (ML)
and deep learning (DL) have demonstrated their ef-
a
https://orcid.org/0000-0003-0017-9285
b
https://orcid.org/0000-0002-2786-6707
fectiveness in real-time fault detection for industrial
robotics (Wescoat et al., 2021). Traditional rule-based
monitoring systems struggle to adapt to evolving pat-
terns of anomalies caused by environmental and op-
erational variations. Instead, ML techniques such as
Random Forest, Gradient Boosting Machine (GBM),
and deep neural networks have proven to be effective
in detecting irregularities and classifying fault types.
Deep learning models, particularly Long Short-Term
Memory (LSTM) networks, are well-suited for han-
dling sequential dependencies in robotic time-series
data, enabling the identification of subtle deviations in
system behavior. Despite the growing application of
ML and DL in anomaly detection, several challenges
remain. Robotic fault detection involves multiple per-
formance metrics, such as position, velocity, and cur-
rent, each exhibiting varying levels of sensitivity to
operational disturbances. Identifying the most sensi-
tive metric is crucial for prioritizing predictive main-
82
Bendaouia, A., Messaoudi, S., Abdelwahed, E. H., Li and J.
Robots Performance Monitoring in Autonomous Manufacturing Operations Using Machine Learning and Big Data.
DOI: 10.5220/0013526800003967
In Proceedings of the 14th International Conference on Data Science, Technology and Applications (DATA 2025), pages 82-96
ISBN: 978-989-758-758-0; ISSN: 2184-285X
Copyright © 2025 by Paper published under CC license (CC BY-NC-ND 4.0)

tenance efforts and minimizing false alarms. Com-
putational efficiency must also be considered, as real-
time applications require rapid inference with mini-
mal latency. Ensuring the robustness of ML-based
monitoring across different operating conditions is es-
sential to generalize the fault detection framework to
diverse industrial scenarios.
This study proposes a comprehensive machine
learning framework for fault detection and sensitiv-
ity analysis in industrial robotics. The research eval-
uates various ML and DL techniques, including Ran-
dom Forest, GBM, k-Nearest Neighbors, Neural Net-
works, and LSTM, for anomaly detection in the UR5
robot. Sensitivity analysis is conducted to deter-
mine which performance metric—position, velocity,
or current is most susceptible to anomalies by an-
alyzing error metrics such as Mean Absolute Error
(MAE) and Root Mean Squared Error (RMSE). The
computational efficiency of different models is as-
sessed in terms of training time and inference speed
to ensure suitability for real-time industrial applica-
tions. Additionally, a structured data pipeline is de-
veloped, integrating feature engineering, outlier de-
tection, and big data processing frameworks to en-
hance model reliability and scalability. The pro-
posed approach is validated using real-world data
from the National Institute of Standards and Technol-
ogy (NIST, 2017). The dataset includes controller-
level measurements such as joint positions, velocities,
currents, torques, and temperatures under varying op-
erational conditions(Qiao et al., 2017a; Qiao et al.,
2017b). Advanced feature engineering techniques,
including difference-based transformations and in-
terquartile range-based binarization, are applied to
improve anomaly detection capabilities. The models
are trained on six independent datasets corresponding
to different combinations of payload, speed, and tem-
perature, preserving temporal consistency and assess-
ing the generalizability of the model. The analysis
also reveals that the velocity anomalies ( y velocity)
are the most sensitive in most conditions, except in
high-stress environments where the current anomalies
( y current) dominate. These insights contribute to the
refinement of predictive maintenance strategies and
the optimization of real-time fault detection frame-
works in autonomous additive manufacturing opera-
tions.
The remaining of this paper is structured as fol-
lows. Section 2 highlights the literature review
and similar applications of ML for fault detection
in additive manufacturing. Section 3 presents the
methodological framework, including data prepro-
cessing, feature engineering, and model selection.
Section 4 discusses the experimental results, high-
lighting model comparisons and sensitivity analy-
sis. Section 5 provides an in-depth discussion of the
findings, focusing on their implications for industrial
robotics. Finally, Section 6 concludes the study and
outlines potential future research directions.
2 LITERATURE REVIEW
Ensuring the reliability of robotic systems in au-
tonomous additive manufacturing operations requires
advanced machine learning-based fault detection, pre-
dictive maintenance, and human-robot collaboration.
This section reviews the current state of the art in
these domains, highlighting key methodologies and
technological advancements.
2.1 Machine Learning for Fault
Detection and Predictive
Maintenance
Machine learning plays a critical role in improv-
ing the reliability of robotic systems by enabling
fault detection, predictive maintenance, and real-time
anomaly detection. Several studies have demon-
strated the effectiveness of ML algorithms such as
Random Forest, Long-Short-Term Memory networks,
and Gradient Boosting Machines in diagnosing faults
in robotic manipulators (Wescoat et al., 2021; Van
and Ceglarek, 2021). Feature engineering techniques,
including binarized anomaly indicators and time-
sequential features, improve the precision of these
models in classifying anomalies in position, velocity,
and current (Scime and Beuth, 2018; Qi et al., 2019).
Research has also integrated deep learning methods
such as BN-LSTM for modeling energy consump-
tion, optimizing power efficiency while maintaining
performance (Zhang et al., 2024). In addition, predic-
tive maintenance strategies have been employed using
Digital Twin technology to synchronize real-time sen-
sor data with virtual models for improved fault predic-
tion and process control (Ko et al., 2019; Malik and
Brem, 2021).
2.2 Collaborative Robotics and
Human-Robot Interaction
The emergence of collaborative robots (cobots) in
industrial applications has redefined traditional au-
tomation paradigms by facilitating human-robot inter-
action (HRI). Cobots integrate artificial intelligence
(AI) to enhance adaptability and task execution, re-
ducing programming complexity, and enabling intu-
Robots Performance Monitoring in Autonomous Manufacturing Operations Using Machine Learning and Big Data
83
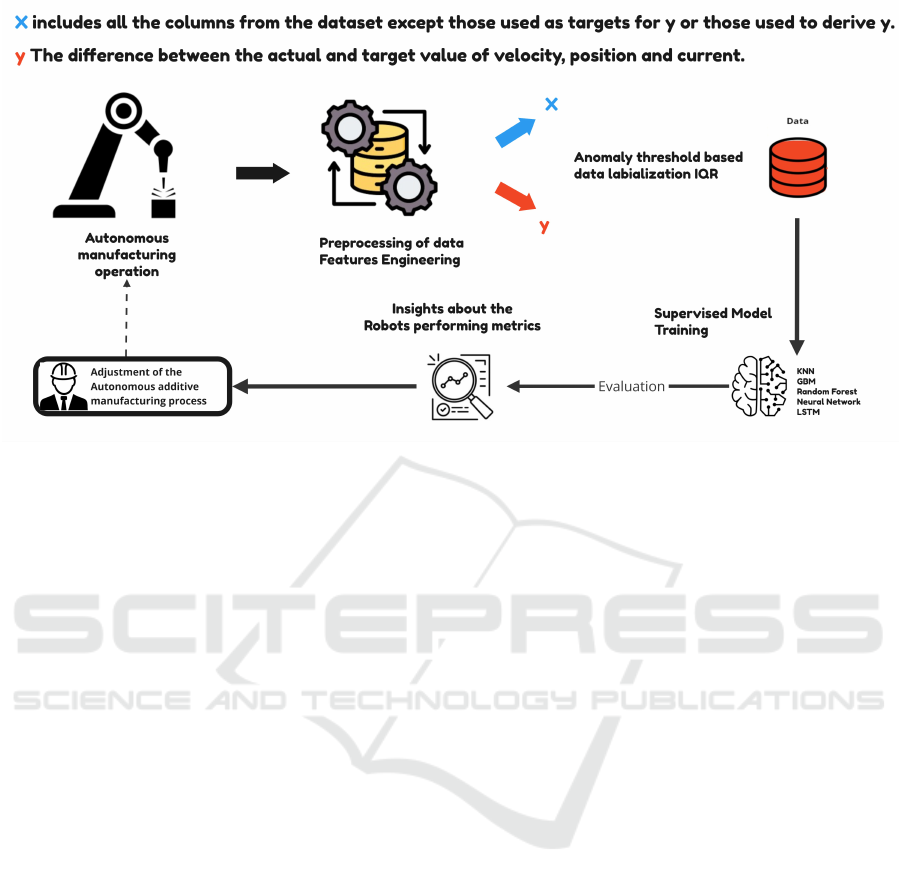
Figure 1: Anomaly Detection Workflow for Robot Operations.
itive teaching methodologies such as lead-through-
learn programming (Canfield et al., 2021; Zaatari
et al., 2019). Studies have explored the integra-
tion of zero moment control in collaborative weld-
ing robots to improve motion stability and process
monitoring (Antonelli and Astanin, 2016; Ferraguti
et al., 2023). In addition, the role of AI in cobot
applications spans various domains, including predic-
tive control, anomaly detection, and adaptation based
on reinforcement learning to dynamic environments
(Borboni et al., 2023; Rozo et al., 2016). Further-
more, research in Industry 4.0 has emphasized the in-
tegration of robotic wireless sensor networks for real-
time process planning and geospatial data manage-
ment, further enhancing smart manufacturing frame-
works (L
˘
az
˘
aroiu et al., 2022; Butt, 2020).
2.3 Autonomous Additive
Manufacturing and Digital Twin
Integration
Advancements in AM have increasingly leveraged
AI-driven process optimization, real-time monitor-
ing, and defect prediction techniques to enhance re-
liability and efficiency. Autonomous robotic AM
frameworks incorporating deep reinforcement learn-
ing have demonstrated improvements in adaptive tool
path planning and material deposition accuracy (Fel-
brich et al., 2022; Fan et al., 2025). Multi-robot sys-
tems for aerial AM have further expanded the po-
tential of decentralized robotic fabrication, enabling
autonomous 3D printing in hard-to-access locations
(Zhang et al., 2022; D
¨
orfler and Gerke, 2022). The
integration of digital twin frameworks with machine
learning algorithms has facilitated continuous knowl-
edge engineering in AM, improving material prop-
erty predictions and defect classification (Raza et al.,
2022; Djuric et al., 2016). Moreover, the incorpo-
ration of cyber-physical systems and real-time AI-
driven control has enhanced the scalability and effi-
ciency of intelligent AM solutions (Sharma and Cu-
pek, 2023; Alghamdy et al., 2023).
The reviewed literature underscores the need to
integrate AI-driven anomaly detection, predictive
maintenance, and collaborative robotics to improve
the reliability of autonomous AM operations. Fu-
ture research should explore hybrid methodologies
that combine digital twin frameworks, reinforcement
learning, and real-time edge computing to further ad-
vance the robustness and adaptability of robotic AM
systems.
3 METHODOLOGY
The primary objective of this study is to establish
a framework to identify the most sensitive variable
among robot performance metrics (RPM), position,
velocity, and current in robot performance, using ma-
chine learning and deep learning techniques. The
framework allows the real-time monitoring of the
RPM to assess and alert when an anomaly is detected.
Sensitivity is assessed by evaluating the mean abso-
lute error and the root mean squared error, allowing
us to rank these three variables according to their sus-
DATA 2025 - 14th International Conference on Data Science, Technology and Applications
84

ceptibility to faults. Understanding which variable
is deviating is crucial for optimizing fault detection
strategies and improving predictive maintenance in
autonomous additive manufacturing operations.
To achieve this, various state of the art machine
learning methods, such as k-Nearest Neighbors, Gra-
dient Boosting Machine, and Random Forest, are
compared with deep learning models like neural net-
works and long-short-term memory. This compari-
son not only assesses their accuracy and precision in
fault detection, but also assesses their ability to clas-
sify anomalies into the three categories while con-
sidering computational efficiency in terms of train-
ing and inference time. By balancing these aspects,
this study aims to determine the most effective model
for anomaly detection while identifying which of the
three variables should be prioritized in the monitoring
and maintenance of industrial robotic systems.
The figure 1 summarizes the anomaly detection
workflow. Data are collected from robot sensors and
preprocessed separately for six distinct datasets, each
corresponding to a unique combination of payload,
speed, and temperature. This division is crucial be-
cause the robot-time column is sequential within each
dataset but would lose its temporal consistency if dif-
ferent combinations were merged, as each represents
an independent operating condition set at the begin-
ning of data collection. The first input features ”X”
represent all the columns in the dataset except those
used to calculate ”y”, while ”y” denotes the target
variables used for anomaly detection. Four target
variables are used: the first target detects anoma-
lies globally, serving as an initial detection mecha-
nism, while the other three (y pos, y velocity, and
y current) classify the specific type of anomaly (po-
sition, velocity, or current). Each of the six datasets
is used to train machine learning and deep learning
models independently. The models are then evalu-
ated for their fault detection and classification perfor-
mance, ensuring that the best-performing approach is
selected for reliable and efficient anomaly detection in
industrial robotic applications. The massive amount
of time-series data is processed through a big data
pipeline to guarantee proper streaming and storing of
data.
3.1 Data Collection and Preprocessing
3.1.1 Data Description
The data used for this study is a series of experi-
ments conducted on the Universal Robots UR5 robot
by the National Institute of Standards and Technology
(NIST, 2017). The main goal of these experiments
was to measure the degradation of the accuracy of the
position of the robot arm over time, which is essen-
tial to assess robot health. We have conducted the
preprocessing, cleaning, and preparation of the robot
fault detection data for model training and framework
validation. The dataset consists of six subsets, each
corresponding to different combinations of tempera-
ture (normal or cold start), payload (1.6 or 4.5), and
speed (half speed or full speed). Each dataset con-
tains 115 columns, ensuring a consistent feature struc-
ture across all datasets. However, the number of rows
varies for each dataset, as detailed in table 1, which
provides the exact number of observations along with
the corresponding temperature, payload and speed
conditions for each dataset. In total, there are 153,644
observations in all six datasets. These columns in-
clude engineered features, binary classification labels,
target variables (y), and other relevant parameters that
are partially present in the datasets.
These data are essential for building robot health
monitoring algorithms and tools, thus supporting re-
search in robot health management and predictive
maintenance.The data include different compositions
of several factors influencing robot performance:
• Payload: Two different weight values (1.6 and
4.5) are used in the experiments to observe the
impact of weight on the degradation of robot per-
formance.
• Speed: Tests were performed at different speeds
(half speed and full speed), to simulate realistic
scenarios in which the robot could operate.
• Temperature: Temperature is a key factor influ-
encing the accuracy of robots. Therefore, tests are
performed under two conditions: normal temper-
ature and cold start.
• Test: Each test is performed in a specific exper-
imental setting to observe the impact of previous
variables on robot performance.
Each joint of the UR5 robot is monitored using a
7-dimensional measurement system, capturing criti-
cal parameters that characterize its performance and
condition. These seven dimensions are summarized
in Table 2. Each of these features helps analyze the
behavior of the joint under different conditions such
as speed, payload, and temperature variations. Since
the UR5 robot has six joints and each joint is char-
acterized by the 7-dimensional measurement system,
the total number of measurable features amounts to
42 core features before considering actual and target
values where applicable. However, because position,
velocity, and current include both actual and target
values, the total number of features expands to 60
features, as detailed in Table 3. In addition to these
Robots Performance Monitoring in Autonomous Manufacturing Operations Using Machine Learning and Big Data
85
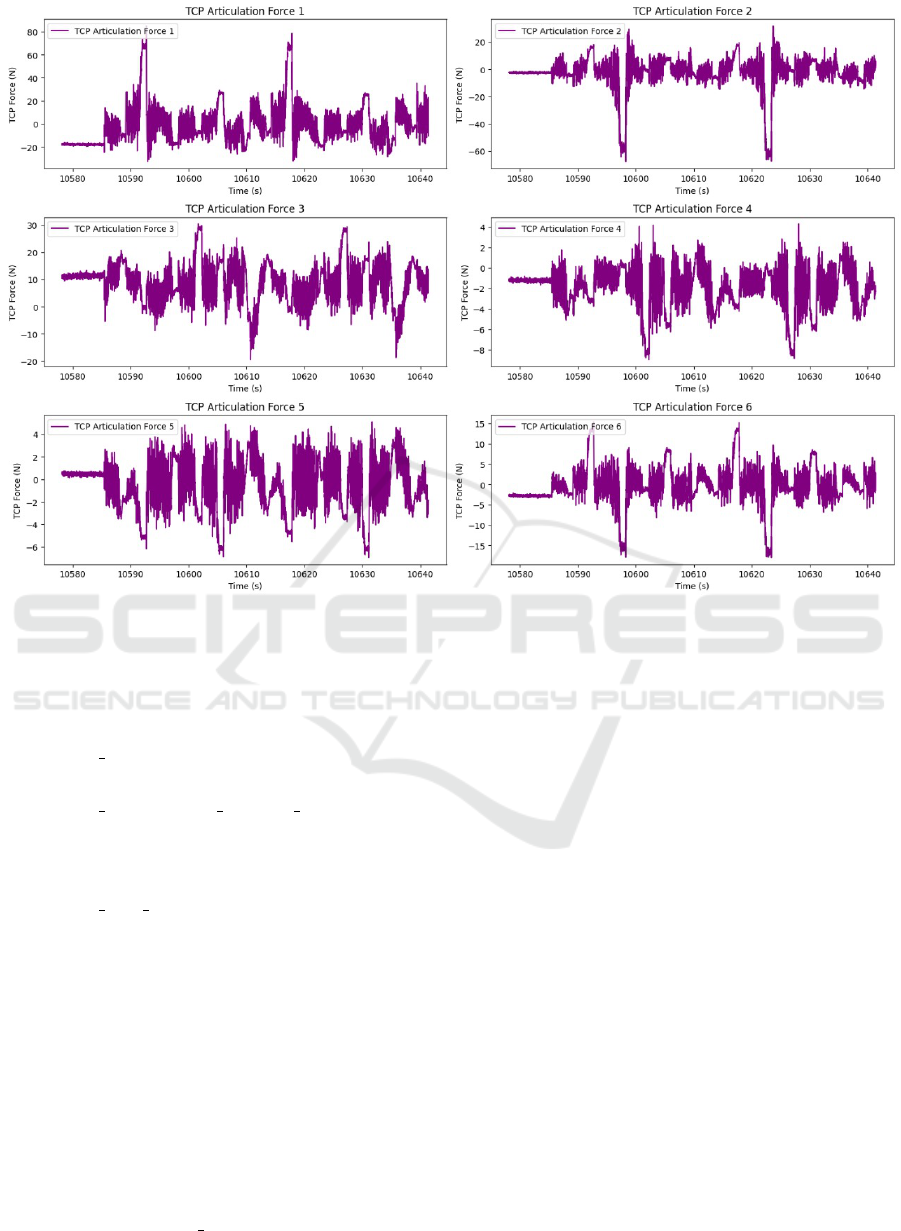
Figure 2: Visualization of TCP Articulation Forces for the First Combination of Payload, Temperature, and Speed: (1.6,
normal, half speed).
60 core features, the data set includes additional vari-
ables that provide further insight into the overall state
of the robot.
• ROBOT TIME: Time elapsed since the controller
was started.
• ROBOT CARTESIAN COORD TOOL: Carte-
sian coordinates (x, y, z) and rotation vector
(rx, ry, rz) representing the tool’s position and
orientation in space.
• ROBOT TCP FORCE: Generalized force mea-
surements at the Tool Center Point (TCP).
These additional features are not part of the 7D mea-
surement system since they describe the overall robot
state rather than individual joint behavior.
3.1.2 Cleaning and Pre-Treatment Process
Rigorous data cleaning and pre-processing were es-
sential to prepare the dataset for analysis and model
training within our proposed framework. This in-
volved merging measurement and test datasets based
on shared payload, temperature, and speed to create
six consistent and sequential datasets, preserving the
integrity of the ROBOT T IME column. Missing or
erroneous values were addressed using interpolation,
row deletion, or average substitution, depending on
context and extent.
The figure 2 illustrates the variations in the articu-
lation forces of the center point tool for the six joints
of the UR5 robot under specific conditions: a pay-
load of 1.6 kg, normal temperature, and a speed set
to half speed. The data represent the forces measured
in Newtons over time in seconds. Each subplot corre-
sponds to a specific joint (from 1 to 6), allowing a de-
tailed analysis of the force dynamics for each articula-
tion. The fluctuations in the forces reflect the interac-
tions between the robot and its working environment.
Maximum forces and sudden peaks are evident, indi-
cating moments of high strain on certain joints. Each
joint exhibits distinct patterns of fluctuations, likely
influenced by the dynamics of the payload and the
specific temperature and speed conditions. The av-
erage force levels vary across the joints, with some
maintaining relatively stable ranges. This visualiza-
tion is crucial for identifying potential anomalies or
unusual trends in the data, which could indicate per-
formance issues or the need for preventive mainte-
nance.
DATA 2025 - 14th International Conference on Data Science, Technology and Applications
86

Table 1: Overview of Datasets Based on Temperature, Payload, and Speed.
Dataset Temperature Payload Speed Number of
Observations
Data1 Normal 1.6 Half Speed 25,785
Data2 Normal 1.6 Full Speed 22,434
Data3 Normal 4.5 Half Speed 29,961
Data4 Normal 4.5 Full Speed 21,770
Data5 Cold Start 4.5 Half Speed 30,956
Data6 Cold Start 4.5 Full Speed 22,738
Table 2: The 7-dimensional measurement system per joint.
Measurement Dimension Type Description
Joint Position Actual & Target Measured and desired angular position of the joint (rad).
Joint Velocity Actual & Target Measured and desired angular velocity of the joint (rad/s).
Joint Current Actual & Target Measured and desired electrical current used by the joint motor (A).
Joint Acceleration Target Desired acceleration of the joint (rad/s²).
Joint Torque Target Desired torque applied by the joint (Nm).
Joint Temperature Actual Measured temperature of the joint (°C).
Joint Control Current Actual Measured control current applied to the joint (A).
Table 3: Breakdown of the 60 measurable features derived from the 6 joints & 7-dimensional measurement system.
Measurement Dimension Type Per Joint Total for 6 Joints
Joint Position Actual & Target 2 12
Joint Velocity Actual & Target 2 12
Joint Current Actual & Target 2 12
Joint Acceleration Target 1 6
Joint Torque Target 1 6
Joint Temperature Actual 1 6
Joint Control Current Actual 1 6
Total Features 10 per joint 60
3.2 Feature Engineering
Feature Engineering is a crucial step in the devel-
opment of machine learning models, as it allows to
transform raw data into more informative variables
suitable for prediction. In this study, several feature
engineering techniques were applied to improve the
performance of the robot fault detection model. Vari-
able transformations aim to make the data more suit-
able for machine learning, by highlighting relation-
ships or simplifying complex aspects of the system
studied.
3.2.1 Creating New Variables
One of the key steps in feature engineering is to create
new variables that better capture the relationship be-
tween different data features and robot performance
degradations. In this case, the creation of several
differences-based variables is particularly relevant. In
our framework, we have calculated the following fea-
tures:
• Diff Position: This variable represents the dif-
ference between the actual measured position of
the robot (measured TCP position) and the tar-
get position. It is crucial to evaluate the robot’s
accuracy over time and detect anomalies or per-
formance degradations. It explicitly quantifies the
gap between the expected position and the actual
position reached by the robot. This variable is ob-
tained by subtracting the nominal position values
from the measured positions.
• Diff Velocity & Diff Current: Similarly, two ad-
ditional variables, diff velocity and diff current,
are created using the same approach. These repre-
sent the differences between the actual and target
values of velocity and current, respectively. These
variables help to assess deviations in motion and
electrical performance, contributing to better fault
Robots Performance Monitoring in Autonomous Manufacturing Operations Using Machine Learning and Big Data
87
detection.
• Diff Robot Time: Another important feature
introduced is diff robot time, which represents
the difference between sequential values in the
ROBOT TIME column. Since ROBOT TIME
is sequential but not evenly spaced, this vari-
able captures the irregularity in time intervals.
Adding this feature helps machine learning and
deep learning models, especially sequential mod-
els such as LSTMs, to understand the varying time
gaps between observations, improving the accu-
racy of temporal anomaly detection.
3.2.2 Transformation into Binary Variables
Based on IQR
Outliers can be indicators of malfunctions or abnor-
mal behaviors in mechanical systems. In this project,
the interquartile range is used to detect outliers and
transform them into binary variables. Table 4 shows
the anomalies detected by this method for position,
velocity and current in different data sets. The in-
terquartile range is a statistical method that captures
values that are outside the interquartile range of the
data. IQR is defined as the difference between the
third quartile (Q3) and the first quartile (Q1):
IQR = Q
3
− Q
1
The values considered outliers are those that fall out-
side the range defined by: Suspicious value < Q
1
−
1.5 × IQR or Suspicious value > Q
3
+ 1.5 × IQR As
part of the study, some variables are transformed into
binary variables based on outlier detection. These
transformations are applied to several key variables
in the system, such as joint positions and velocity.
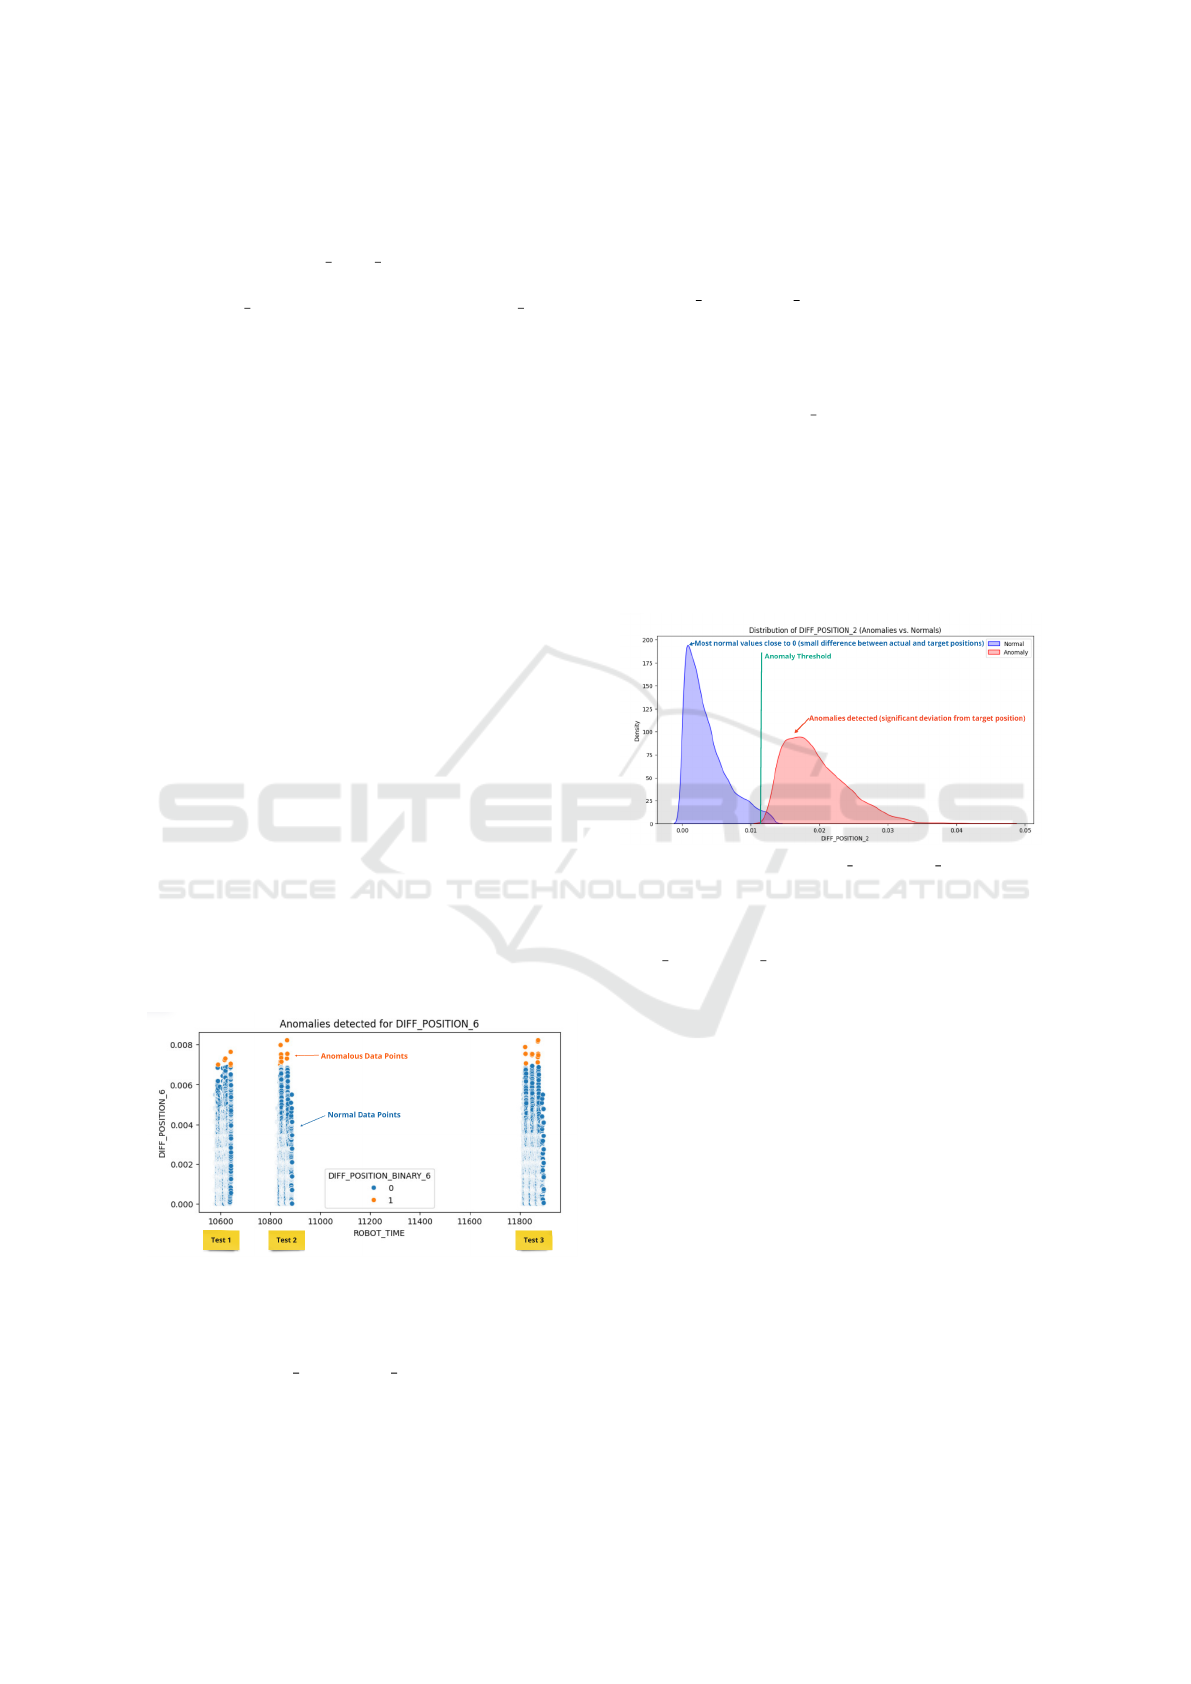
Figure 3: Anomaly Detection in Robot Joint Position
Across Multiple Test Intervals.
The figure 3 illustrates the anomaly detection re-
sults for the DIFF POSITION 6 variable, which was
introduced through feature engineering. This vari-
able represents the absolute difference between the
actual measured position and the target position of
the sixth robot joint. The data correspond to the
test configuration where payload = 1.6, speed = half
speed and temperature = normal. To identify anoma-
lies, the Interquartile Range method was applied to
the DIFF POSITION 6 values. Points detected as
anomalies (shown in orange) represent significant de-
viations from the expected position, indicating pos-
sible faults or inaccuracies in the robot’s movement.
Normal values are represented in blue. The x-axis
corresponds to ROBOT TIME, which represents se-
quential time steps. However, there are visible gaps
between the three intervals. This occurs because the
dataset consists of three separate test runs, where data
was collected during a certain time period, followed
by a pause in collection, and then resumed for the next
test. As a result, the figure shows three distinct time
segments in which the measurements were recorded
sequentially.
Figure 4: Distribution of DIFF POSITION 2 (Normal vs.
Anomalous Values).
This figure 4 represents the distribution of the
DIFF POSITION 2 variable, which corresponds to
the difference between the actual position and the tar-
get position of joint 2 for the specific combination of
normal temperature, payload of 1.6, and half speed.
In blue: Distribution of normal values (not consid-
ered anomalies). Most of these values are very close
to 0, indicating that the actual position of joint 2
generally matches the target position. This means
that there are no significant positioning errors in most
cases.
In red: Distribution of anomalous values detected us-
ing the interquartile range method. These values are
concentrated mainly around 0.015, indicating a sig-
nificant deviation between the target and actual po-
sitions of joint 2 in certain cases. These deviations
are considered anomalies, suggesting unusual vari-
ations in the robot’s movement. This visualization
highlights the distinction between normal values and
anomalies, clearly showing that most discrepancies
are minimal, but there are cases where the error be-
comes significant.
DATA 2025 - 14th International Conference on Data Science, Technology and Applications
88

Table 4: Percentage of anomalies for Position, Velocity, and Current across datasets.
Dataset Position Anomalies (%) Velocity Anomalies (%) Current Anomalies (%)
Data1 5.81% 5.63% 1.41%
Data2 8.57% 7.74% 1.99%
Data3 4.66% 4.89% 1.86%
Data4 7.44% 8.09% 1.59%
Data5 5.25% 5.32% 4.82%
Data6 7.24% 7.90% 4.70%
Total 6.39% 6.37% 2.81%
3.2.3 Advantages of Binarizing Variables
Transforming some variables into binary values helps
simplify model interpretation, because binary classi-
fication models can often better handle variables that
clearly indicate the presence or absence of certain
behaviors such as an anomaly or failure. Binariza-
tion helps quickly identify anomalies in robot sys-
tems, facilitating early fault detection. Machine learn-
ing models, especially neural networks, can handle
binary variables more efficiently, reducing computa-
tional complexity, and improving model performance.
The use of binary variables is common in classifica-
tion models, as it allows to predict the presence or
absence of a failure explicitly.
3.2.4 Feature Selection and Dimensionality
Reduction
Besides variable creation and transformation, it is
also crucial to select the most relevant features for
model training. Some variables may be redundant
or not very informative for failure prediction and can
therefore be eliminated to avoid making the model
unnecessarily complex. Techniques such as feature
importance-based, feature selection, or dimensional-
ity reduction with Principal Component Analysis can
be applied to optimize the model and reduce the risk
of overfitting. Feature engineering is a fundamental
step for the success of the study. The creation of new
variables, such as diff position, and the transforma-
tion of variables into binaries, based on interquartile
range and outliers, not only allow better capture ab-
normal behaviors, but also to increase the predictive
capacity of the model. These transformations help to
build a robust model capable of detecting failures in
varied conditions, based on the experimental data. By
strategically applying these techniques, we were able
to prepare the data for training the machine learning
model and improve the performance of the robot’s
predictive monitoring system.
3.3 Preparing Data for Training
Data preparation is a critical step in the process
of building a accurate AI models. Ensure that the
datasets are in the right format for training the model,
leading to more accurate and robust results. The num-
ber of input variables used for training the models cor-
responds to the number of features in X, which is 92
features. This is calculated as follows:
• 60 features from the 7D data.
• 13 features from non-7D data (force components
Fx, Fy, Fz, Tx, Ty, Tz; Cartesian tool coordinates
x, y, z, rx, ry, rz; and robot time).
• 19 features from feature engineering (6 joints with
3 features each, plus 1 feature for the difference in
robot time).
Thus, the total number of features in X is 92. Data
preparation includes several data preprocessing tech-
niques, such as normalization. In this study, nor-
malization was done using the Scikit-learn Standard-
Scaler method, which standardizes variables by trans-
forming them so that they have a mean of zero and a
standard deviation of 1. The formula used for normal-
ization is:
X
normalized
=
(x − µ)
σ
Or :
• x is the original value of the variable.
• µ is the mean of the variable.
• σ is the standard deviation of the variable.
Thus, each variable is rescaled to have a normal dis-
tribution with a mean of 0 and a standard deviation of
1. Normalization is applied to all continuous numeric
variables to ensure consistency and reduce biases aris-
ing from differences in scale during model training.
Normalized variables include robot positions (x, y, z),
joint speeds, accelerations, and currents for each joint,
as well as temperature and torque. These quantitative
measures exhibit significant variability, and normal-
ization ensures that all features contribute equally to
Robots Performance Monitoring in Autonomous Manufacturing Operations Using Machine Learning and Big Data
89

the learning process. These steps ensure that the data
is in an optimal format for training the model, facil-
itating more accurate prediction of robot failures and
degradations. The next step is to train the model us-
ing the prepared data to detect anomalies and improve
autonomous monitoring of the robotic system.
3.4 Model Architecture
The state of the art machine learning and deep learn-
ing algorithms compared in this study are k-Nearest
Neighbors, Gradient Boosting Machine, Random For-
est, Standard Neural Network, and Long Short-Term
Memory.
The models were trained using four distinct target
variables to address both the detection and classifica-
tion of anomalies. The first target, referred to as the
global target (CIBLE), was designed to detect the pres-
ence of anomalies without specifying their type. In
addition, three specific targets—y_pos, y_velocity,
and y_current—were used to identify anomalies re-
lated to position, velocity, and current data, respec-
tively. Each model was trained separately using the
global target to evaluate its performance in general
anomaly detection, as well as with the specific targets
to assess its ability to accurately identify the type of
anomaly.
3.5 Optimizing Data Management for
Sequential and Structured Data in
Robotics
HBase was chosen as the data storage tool due to
its suitability for our case study (see Table 5). Its
columnar storage model efficiently handles structured
sensor data (joint positions, velocities, currents, and
timestamps). Designed for sequential data process-
ing, HBase ensures optimal time-series management
while offering fast access and horizontal scalability
for large datasets. Its column-oriented architecture al-
lows quick retrieval of timestamped sensor readings,
and its seamless integration with Apache Spark en-
ables advanced data processing. These features make
HBase an ideal choice for storing and analyzing in-
dustrial robot data efficiently.
3.6 Selection of Data Processing
Frameworks for Autonomous
Experimentation
Choosing the right data processing framework is crit-
ical to ensuring the effectiveness of autonomous ex-
perimentation with the industrial robot. The table
below(Table 6) compares several major frameworks
based on key characteristics. Apache Storm is a
real-time streaming engine designed for low-latency
data processing, which can be useful for immediate
anomaly detection but does not support batch process-
ing or machine learning integration. Apache Spark
provides a hybrid approach that allows both batch
and streaming processing, making it particularly use-
ful for post-analysis of anomalies and training ma-
chine learning models, although it has higher latency
compared to Flink or Storm. Apache Flink is an
advanced real-time streaming framework that offers
stateful data processing with minimal latency, making
it an excellent choice for predicting anomalies before
they occur. Apache Kafka is a messaging system that
ensures fast and reliable data transmission from the
robot’s sensors to other processing frameworks, play-
ing a key role in maintaining a smooth data pipeline.
Dask is a framework optimized for parallel comput-
ing, making it suitable for handling large-scale experi-
mental data and optimizing machine learning models;
however, unlike Spark or Flink, it does not support
real-time streaming but is highly efficient for batch
analytics. For this project, HBase was selected as
the primary storage solution due to its ability to han-
dle structured time-series data efficiently. In terms
of data processing, Apache Flink is the most suitable
framework because it enables real-time anomaly de-
tection with low latency and stateful stream process-
ing, which aligns with the need for continuous mon-
itoring of the UR5 robot’s operations. Additionally,
Apache Kafka will be used to facilitate data transmis-
sion between the robot’s sensors and the processing
framework, ensuring a reliable and scalable data flow.
For batch analysis and model training, Apache Spark
will be employed as it offers efficient large-scale data
processing and machine learning integration. This
combination of frameworks ensures a robust, scal-
able, and efficient architecture for autonomous exper-
imentation and anomaly detection in the UR5 robot,
enabling real-time issue detection, performance op-
timization, and improved decision-making through
data-driven insights.
4 EXPERIMENTAL RESULTS
AND FINDINGS
All models are trained using the preprocessed
datasets, each corresponding to a different combina-
tion of temperature, speed, and payload. The met-
rics used for evaluation include training time for the
computational efficiency of each model, the precision
to measure the model’s ability to correctly identify
DATA 2025 - 14th International Conference on Data Science, Technology and Applications
90
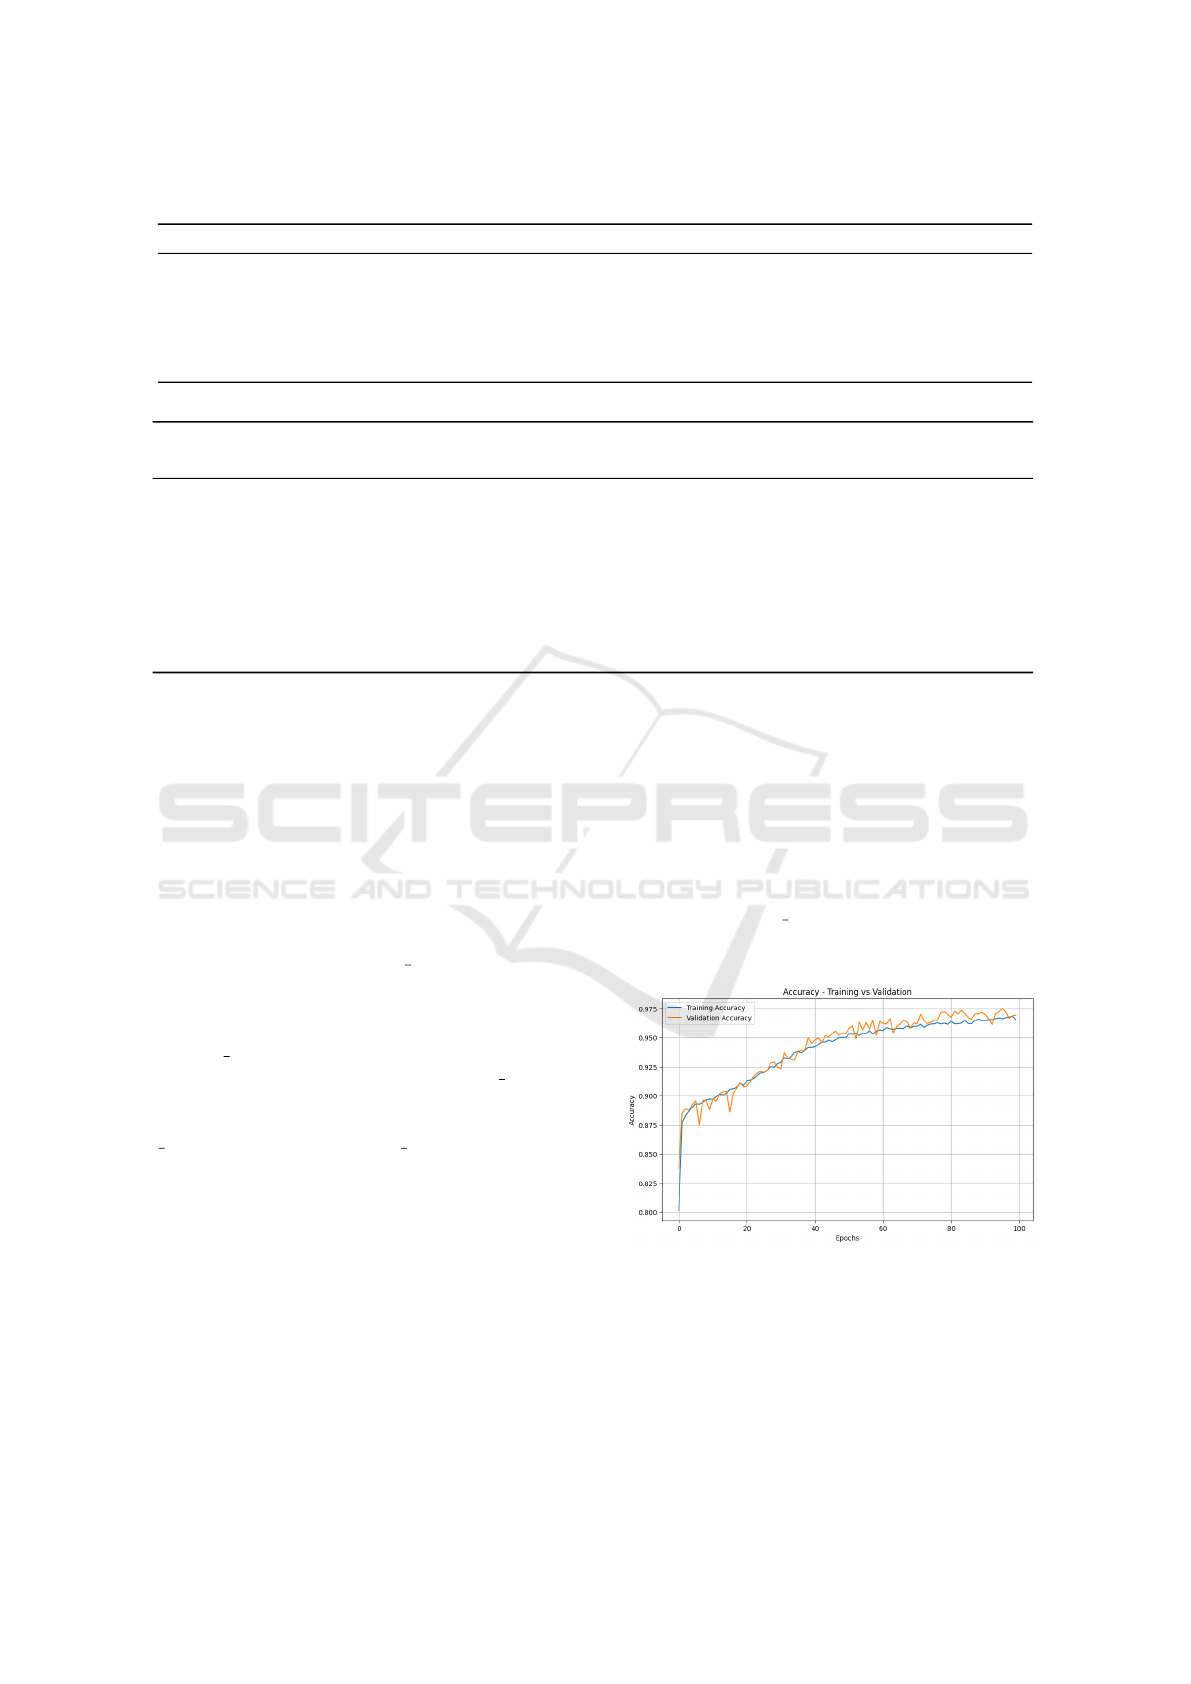
Table 5: Comparison of Hadoop, Hive, MongoDB, HBase, and Apache Flink.
Feature Hadoop Hive MongoDB HBase Apache Flink
Data Model File System File System Document-Oriented Column-Based Stream-Based
Architecture Model Master-to-Slave Master-to-Slave Peer-to-Peer Master-to-Slave Distributed
Structured Data Yes Yes Yes Yes Yes
Sequential Data Handling Yes No No Yes Yes
Integration with Spark Yes Yes Yes Yes Yes
Fast Random Access Yes No No Yes No
Table 6: Comparison of Data Processing Frameworks for Autonomous Experimentation with the Industrial Robot.
Feature Apache
Storm
Apache
Spark
Apache Flink Apache
Kafka
Dask
Processing Type Streaming Hybrid (Batch
& Streaming)
Streaming Messaging Parallel Com-
puting
Real-time Processing Yes Partial Yes Yes No
Batch Processing No Yes No No Yes
Low Latency Yes No Yes Yes No
Fault Tolerance Yes Yes Yes Yes Yes
High Scalability Yes Yes Yes Yes Yes
ML Integration No Yes Yes No Yes
anomalies (Class 1) and normal states (Class 0) and
RMSE, MAE to assess the model’s prediction accu-
racy and error magnitude. The experimental results
demonstrate the performance of machine learning and
deep learning models in anomaly detection for the
UR5 robot. For the LSTM model, the architecture
consists of one hidden LSTM layer with 128 units,
followed by ReLU activation and a 20% Dropout reg-
ularization to prevent overfitting. The output layer
is a single neuron with a sigmoid activation function
for binary classification. For the KNN model, the
number of neighbors is set to n neighbors=5, mean-
ing each prediction is based on the five closest neigh-
bors using the default Euclidean distance metric. For
the GBM model, the evaluation metric used is log
loss (eval metric=’logloss’), which measures the log-
arithmic loss for classification. The random state=42
is set to ensure result reproducibility. For the RF
model, the number of trees in the forest is set to
n estimators=100, and random state=42 is used for
reproducibility. For the Neural Network (NN) model,
the architecture includes:
• Hidden layer 1: Dense layer with 128 neurons and
ReLU activation.
• Dropout layer (20%) to reduce overfitting.
• Hidden layer 2: Dense layer with 64 neurons and
ReLU activation.
• Dropout layer (20%).
• Output layer: Single neuron with sigmoid activa-
tion for binary classification.
• Loss function: Binary cross-entropy, suitable for
binary classification tasks.
• Optimizer: Adam, which dynamically adjusts the
learning rate.
• Evaluation metric: Accuracy.
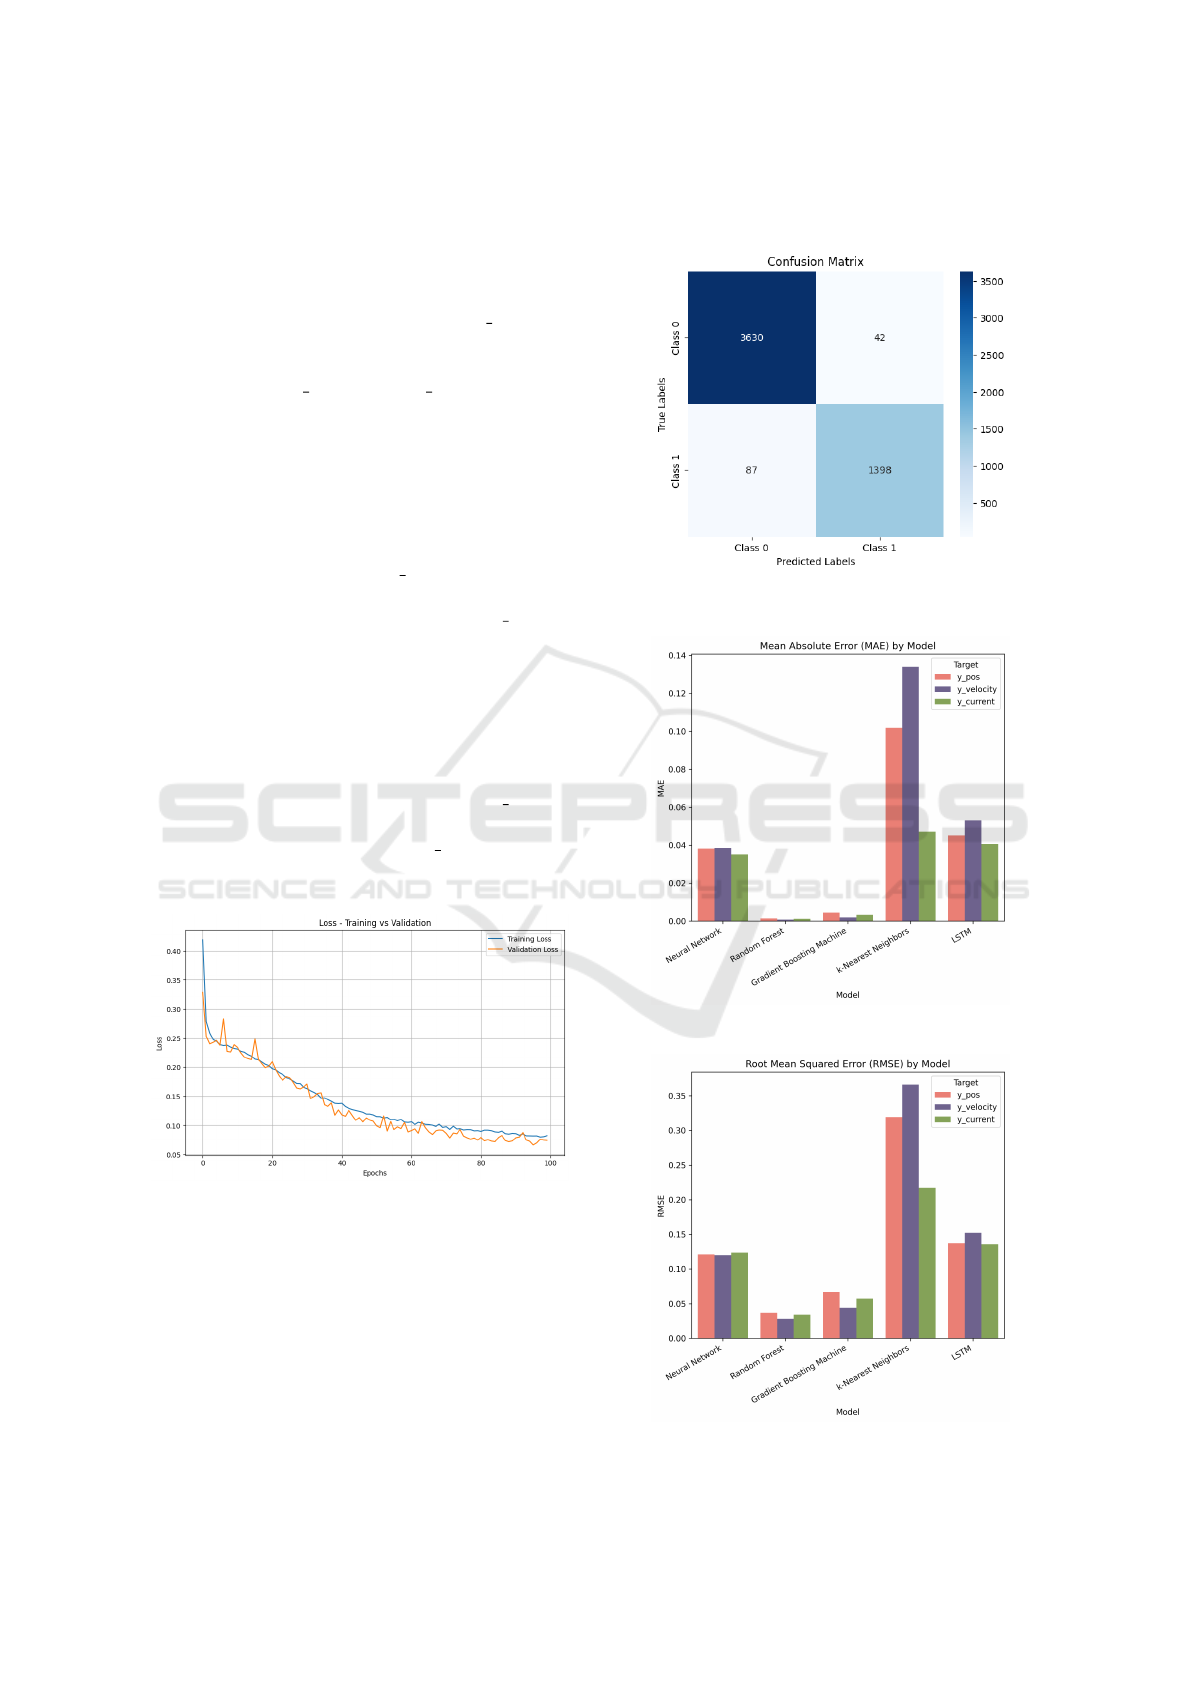
The loss and accuracy curves show a stable con-
vergence of the LSTM model trained on the first com-
bination (Temperature = normal, payload = 1.6, Speed
= half speed), with y pos as the target. The steady de-
crease in loss and increase in accuracy over epochs
demonstrate the effectiveness of the training process.
Figure 5: LSTM Accuracy in Fault Detection for First Com-
bination.
The figures 5 & 6 illustrate the accuracy and loss
curves, confirming the model’s ability to progres-
sively improve its performance. These results indicate
that the LSTM effectively learns from the data while
avoiding overfitting because of the applied regulariza-
Robots Performance Monitoring in Autonomous Manufacturing Operations Using Machine Learning and Big Data
91
tion techniques.
The confusion matrix in figure 7 highlights the
performance of the model in correctly and incor-
rectly classified instances. This matrix demonstrates
the model’s capability to distinguish between anoma-
lous and non-anomalous cases based on y pos. Sim-
ilarly, the same analyses—accuracy and loss curves,
as well as confusion matrices—were conducted for
the other targets (y velocity and y current) to assess
the model’s ability to classify specific anomaly types.
These findings further validate the robustness and ver-
satility of the neural network in handling global and
type-specific anomaly detection tasks.
To analyze the performance of different models on
the first combination of payload, speed, and temper-
ature, we compare their errors across the three tar-
get variables (Figure 8 & 9). y current demonstrates
the most stability with consistently lower MAE and
RMSE values across all models, whereas y velocity
appears to be the most sensitive target, showing
higher variations in error metrics, particularly in mod-
els like k-Nearest Neighbors and LSTM, which strug-
gle to maintain accuracy for this variable.
The combinations are based on variations in speed
(half/full), temperature (normal/cold start), and pay-
load (1.6/4.5). In all combinations except the last
one (cold start, full speed, payload 4.5), y velocity
is the most sensitive variable with the highest RMSE.
However, in the last combination, y current becomes
the most sensitive, indicating a significant increase in
RMSE (Figure 10).
Figure 6: LSTM Loss in Fault Detection for First Combi-
nation.
The table 7 presents the performance of five ma-
chine learning models: gradient boosting machine,
k-nearest neighbors, random forest, neural network,
and LSTM—evaluated across four different targets
(y_pos, y_velocity, y_current and y). For each
model, the test accuracy, RMSE, MAE, and training
time are reported. The results highlight each model’s
ability to detect anomalies and classify their types
(position, velocity, current), as well as the computa-
tional efficiency of the training process.
Figure 7: LSTM confusion matrix in Fault Detection for
First Combination.
Figure 8: MAE Comparison Across Models.
Figure 9: RMSE Comparison Across Models.
DATA 2025 - 14th International Conference on Data Science, Technology and Applications
92

Figure 10: RMSE values for the LSTM model across dif-
ferent experimental conditions.
5 DISCUSSION
The experimental analysis demonstrates the effective-
ness of machine learning and deep learning tech-
niques for the real time monitoring of industrial
robots in autonomous operations, under the first com-
bination of conditions: temperature (normal), speed
(half speed), and payload (1.6 kg). Five models, Ran-
dom Forest, Gradient Boosting Machine, k-Nearest
Neighbors, Deep Neural Networks, and Long Short-
Term Memory—were evaluated based on test accu-
racy, MAE, RMSE, and training time for real time
integration purposes. Among all tested models, Ran-
dom Forest emerged as the best performing model.
It achieved the highest test accuracy across all target
variables (y pos, y velocity, y current, and y), consis-
tently exceeding 99% accuracy for most cases. Addi-
tionally, it maintained relatively short training times,
ranging from 12 to 14 seconds, making it a highly
efficient choice for real-time and industrial applica-
tions. The ensemble learning mechanism of Random
Forest, which aggregates multiple decision trees, en-
ables robust and reliable predictions while minimiz-
ing overfitting. This stability across different targets
makes it an ideal candidate for detecting anomalies
in the UR5 robot. Other models also exhibited com-
petitive performance. Gradient Boosting Machine
demonstrated excellent predictive capability, achiev-
ing test accuracies above 99%, with significantly low
MAE and RMSE values. However, despite its strong
accuracy, GBM required slightly more training time
( 1.2–1.4 seconds per target) compared to Random
Forest. While GBM is a highly efficient model, it
does not generalize as well across different targets as
Random Forest does. Deep Neural Networks showed
strong predictive capability, particularly for y pos,
y velocity, and y current, with accuracies exceeding
98%. However, its performance on the combined tar-
get (y) dropped to 92.75%, indicating potential limi-
tations in handling multi-dimensional fault detection
scenarios. Furthermore, DNN models required signif-
icantly longer training times (56–123 seconds per tar-
get), making them less practical for real-time deploy-
ment despite their high accuracy. Similarly, LSTM
performed well for sequential data, achieving over
97% accuracy for y pos, y velocity, and y current.
However, its accuracy dropped to 93.14% for y, and
it had the highest training time (225–306 seconds per
target), making it computationally expensive. While
LSTM is well-suited for capturing long-term depen-
dencies in time-series data, its efficiency trade-off
makes it less viable for real-time anomaly detection
in industrial settings. In contrast, KNN exhibited
the lowest performance among the models tested. Its
test accuracies ranged from 86.60% to 95.29%, with
significantly higher MAE and RMSE values com-
pared to other models. However, it had the short-
est training times ( 0.01 to 0.02 seconds), making it
a viable option when computational speed is priori-
tized over predictive accuracy. Although KNN is not
the best choice for precision-driven applications, its
simplicity and speed could be useful in cases where
quick approximations are needed. Considering the
balance between accuracy, robustness, and compu-
tational efficiency, Random Forest is selected as the
best model for detecting and classifying anomalies in
the UR5 robot under these conditions. While GBM
offers competitive accuracy, Random Forest provides
greater stability across all targets and faster inference
times, making it ideal for industrial real-time appli-
cations. These findings highlight the importance of
leveraging ensemble learning methods for predictive
maintenance and fault detection in autonomous ad-
ditive manufacturing operations. By incorporating
sensor-based features (joint positions, velocities, cur-
rents, torques) and engineered variables (differences
between target and actual values), the models ef-
fectively distinguish between normal and anomalous
states, offering valuable insights into robotic system
performancemetrics.
5.1 Limitations and Future Work
Although the results are promising, several limita-
tions warrant discussion. First, current models were
trained and evaluated on a data set that, while repre-
sentative, may not capture the full range of variabil-
ity encountered in real-world scenarios. Factors such
as sensor noise, environmental conditions, and task-
specific variations could affect model performance.
The reliance on pre-engineered features, such as bi-
nary transformations based on the interquartile range,
while effective for anomaly detection, may lead to a
loss of nuanced information. Future work could ex-
Robots Performance Monitoring in Autonomous Manufacturing Operations Using Machine Learning and Big Data
93
Table 7: Comparison of the Performance of Different Models and Targets for the First Combination: Temperature (normal),
Speed (half speed), Payload (1.6).
Model Target (Y) Test Accuracy (%) MAE RMSE Training Time (s)
Neural Network
y pos 98.10 0.0382 0.1211 95.31
y velocity 98.10 0.0385 0.1201 121.25
y current 97.91 0.0351 0.1238 56.42
y 92.75 0.1105 0.2294 123.96
Random Forest
y pos 99.86 0.0014 0.0368 12.82
y velocity 99.92 0.0008 0.0279 12.34
y current 99.88 0.0012 0.0341 13.13
y 97.75 0.0225 0.1500 14.21
Gradient Boosting Machine
y pos 99.55 0.0045 0.0668 1.26
y velocity 99.81 0.0019 0.0440 1.05
y current 99.67 0.0033 0.0574 1.36
y 99.44 0.0056 0.0750 1.37
k-Nearest Neighbors
y pos 89.82 0.1018 0.3191 0.017
y velocity 86.60 0.1340 0.3661 0.015
y current 95.29 0.0471 0.2171 0.014
y 87.03 0.1297 0.3602 0.013
LSTM
y pos 97.50 0.0452 0.1374 232.58
y velocity 96.76 0.0531 0.1523 306.26
y current 97.38 0.0406 0.1358 225.78
y 93.14 0.1055 0.1284 265.25
plore the use of unsupervised learning techniques or
feature extraction methods to enhance data represen-
tation without predefined thresholds. The models re-
quire further validation in live industrial environments
to assess their scalability, robustness, and adaptabil-
ity. Transfer learning techniques could be explored
to adapt DNNs to new robotic systems without re-
training from scratch. Similarly, hyperparameter op-
timization and the integration of domain knowledge
into machine learning models could further improve
their performance. Although recent trends highlight
the effectiveness of transformers for time series anal-
ysis, this study does not incorporate them. However,
future work could investigate their potential to en-
hance temporal dependency modeling and improve
anomaly detection in robotic systems. Additionally,
the methodology could be extended to other types of
robots, requiring adjustments based on their mechan-
ical characteristics and sensor configurations.
6 CONCLUSION
In this study, we explore a data-driven approach for
fault detection and anomaly classification in indus-
trial robots, specifically the UR5 welding robot. Us-
ing sensor data and machine learning techniques,
we developed a robust system capable of identifying
anomalies under different operating conditions, con-
sidering variations in temperature, speed, and pay-
load. Our approach combines feature engineering,
statistical thresholding, and supervised learning, mak-
ing it an effective strategy for the monitoring of
robotic systems in autonomous additive operations.
The results demonstrate that Random Forest out-
performed other models, achieving the highest ac-
curacy while maintaining a relatively low computa-
tional cost. GBM also delivered strong performance,
particularly in terms of efficiency, making it a suit-
able alternative when fast predictions are required.
Deep learning models, including Neural Networks
and LSTM, showed promising results, particularly in
capturing complex temporal dependencies, but their
longer training times limit their practicality for real-
time fault detection. The KNN model, while compu-
tationally efficient, exhibited lower accuracy, making
it less suitable for high-precision applications. Be-
yond model performance, this research aligns with the
principles of autonomous experimentation, where the
iterative cycle of data collection, model training, and
performance evaluation leads to continuous improve-
ment of the system. The integration of machine learn-
ing with robotic fault detection enables a data-driven
self-optimization framework, reducing the need for
DATA 2025 - 14th International Conference on Data Science, Technology and Applications
94

manual intervention to diagnose faults. This shift to-
wards automation enhances industrial efficiency by
enabling real-time anomaly detection and proactive
maintenance strategies, ultimately improving robot
reliability and operational lifespan. Future work will
focus on further refining model performance, integrat-
ing real-time deployment strategies, and exploring re-
inforcement learning for adaptive fault detection. Ad-
ditionally, expanding the dataset with diverse oper-
ational scenarios and environmental factors will en-
hance the robustness of the models, ensuring their ap-
plicability across a wider range of industrial settings.
This study highlights the potential of AI-driven pre-
dictive maintenance, paving the way for smarter and
more autonomous robotic systems in manufacturing
and beyond.
ACKNOWLEDGEMENTS
This material is based upon work supported by the
U.S. Department of Defense under the Office of
Local Defense Community Cooperation (OLDCC)
Award Number MCS2106-23-01. The views ex-
pressed herein do not necessarily represent the views
of the U.S. Department of Defense or the United
States Government. We would like to acknowledge
the National Institute of Standards and Technology
(NIST) for making their raw data available.
REFERENCES
Alghamdy, M., Almutairi, F. M., and Ahmad, R. (2023).
Job-scheduling model for an autonomous additive
manufacturing: a case of 3d food printing. Unknown
Journal, 217:1234–1242.
Antonelli, D. and Astanin, S. (2016). Qualification of a col-
laborative human-robot welding cell. Procedia CIRP,
41:352–357.
Borboni, A., Reddy, K. V., Elamvazuthi, I., AL-Quraishi,
M. S., Natarajan, E., and Ali, S. S. A. (2023). The ex-
panding role of artificial intelligence in collaborative
robots for industrial applications: A systematic review
of recent works. Robotics and Computer-Integrated
Manufacturing, 11(1):111.
Butt, J. (2020). Exploring the interrelationship between ad-
ditive manufacturing and industry 4.0. Unknown Jour-
nal, 4(2):13.
Canfield, S. L., Owens, J. S., and Zuccaro, S. G. (2021).
Zero moment control for lead-through teach program-
ming and process monitoring of a collaborative weld-
ing robot. Unknown Journal, 13(3):031016.
Djuric, A. M., Urbanic, R. J., and Rickli, J. L. (2016). A
framework for collaborative robot (cobot) integration
in advanced manufacturing systems. Unknown Jour-
nal, 9(2):457–464.
D
¨
orfler, K. and Gerke, M. (2022). Additive manufactur-
ing using mobile robots: Opportunities and challenges
for building construction. Cement and Concrete Re-
search, 158:106772.
Fan, H., Liu, C., Bian, S., Ma, C., Huang, J., Liu, X., Doyle,
M., Lu, T., Chow, E., Chen, L., Fuh, J. Y. H., Lu,
W. F., and Li, B. (2025). New era towards autonomous
additive manufacturing: a review of recent trends and
future perspectives. International Journal of Extreme
Manufacturing, 7(3):032006.
Felbrich, B., Schork, T., and Menges, A. (2022). Au-
tonomous robotic additive manufacturing through dis-
tributed model-free deep reinforcement learning in
computational design environments. Construction
Robotics, 6(1):15–37.
Ferraguti, F., Villani, V., and Storchi, C. (2023). My-
welder: A collaborative system for intuitive robot-
assisted welding. Unknown Journal, 89:102920.
Ko, H., Witherell, P., Ndiaye, N. Y., and Lu, Y. (2019). Ma-
chine learning based continuous knowledge engineer-
ing for additive manufacturing. In 2019 IEEE 15th
International Conference on Automation Science and
Engineering (CASE). IEEE.
L
˘
az
˘
aroiu, G., Andronie, M., Iatagan, M., Geam
˘
anu, M.,
S
,
tef
˘
anescu, R., and Dijm
˘
arescu, I. (2022). Deep
learning-assisted smart process planning, robotic
wireless sensor networks, and geospatial big data
management algorithms in the internet of manufactur-
ing things. Unknown Journal, 11(5):277.
Malik, A. A. and Brem, A. (2021). Digital twins for collab-
orative robots: A case study in human-robot interac-
tion. Unknown Journal, 68:102092.
NIST, U. (2017). Degradation measurement of robot arm
position accuracy. Accessed: 2025-02-06.
Qi, X., Chen, G., Li, Y., Cheng, X., and Li, C. (2019).
Applying neural-network-based machine learning to
additive manufacturing: Current applications, chal-
lenges, and future perspectives. Unknown Journal,
5(4):721–729.
Qiao, G., Schlenoff, C., and Weiss, B. A. (2017a). Accu-
racy degradation analysis for industrial robot systems.
Accessed: 2025-02-07.
Qiao, G., Schlenoff, C., and Weiss, B. A. (2017b). Quick
positional health assessment for industrial robot prog-
nostics and health management (phm). In 2017 IEEE
International Conference on Robotics and Automation
(ICRA), pages 1815–1820. IEEE.
Raza, A., Deen, K. M., Jaafreh, R., Hamad, K., Haider,
A., and Haider, W. (2022). Incorporation of machine
learning in additive manufacturing: a review. Interna-
tional Journal of Advanced Manufacturing Technol-
ogy, 122(3):1143–1166.
Rozo, L., Calinon, S., Caldwell, D. G., Jimenez, P., and
Torras, C. (2016). Learning physical collaborative
robot behaviors from human demonstrations. Un-
known Journal, 32(3):513–527.
Scime, L. and Beuth, J. (2018). A multi-scale convolu-
tional neural network for autonomous anomaly detec-
Robots Performance Monitoring in Autonomous Manufacturing Operations Using Machine Learning and Big Data
95

tion and classification in a laser powder bed fusion
additive manufacturing process. Additive Manufac-
turing, 24:273–286.
Sharma, N. and Cupek, R. (2023). Real-time control and
optimization of internal logistics systems with collab-
orative robots. Unknown Journal, 225:248–258.
Van, M. and Ceglarek, D. (2021). Robust fault tolerant con-
trol of robot manipulators with global fixed-time con-
vergence. Unknown Journal, 358:699–722.
Wescoat, E., Krugh, M., and Mears, L. (2021). Random for-
est regression for predicting an anomalous condition
on a ur10 cobot end-effector from purposeful failure
data. Procedia Manufacturing, 53:644–655.
Zaatari, S. E., Marei, M., Li, W., and Usman, Z. (2019).
Cobot programming for collaborative industrial tasks:
An overview. Unknown Journal, 116:162–180.
Zhang, K., Chermprayong, P., Xiao, F., Tzoumanikas, D.,
Dams, B., Kay, S., Kocer, B. B., Burns, A., Orr,
L., Alhinai, T., Choi, C., Darekar, D. D., Li, W.,
Hirschmann, S., Soana, V., Ngah, S. A., Grillot, C.,
Sareh, S., Choubey, A., Margheri, L., Pawar, V. M.,
Ball, R. J., Williams, C., Shepherd, P., Leutenegger,
S., Stuart-Smith, R., and Kovac, M. (2022). Aerial
additive manufacturing with multiple autonomous
robots. Nature, 609(7928):709–717.
Zhang, Z., George, A., Alam, M. F., Eubel, C., Vallabh,
C. P., Shtein, M., Barton, K., and Hoelzle, D. J.
(2024). An additive manufacturing testbed to evalu-
ate machine learning-based autonomous manufactur-
ing. Unknown Journal, 146(3):031008.
DATA 2025 - 14th International Conference on Data Science, Technology and Applications
96
