
A Simulation Tool to Assess the Impact of Deviation Plans on Disruptive
Events of Urban Traffic
Davide Andrea Guastella
1,2 a
, Mois
´
es Silva-Mu
˜
noz
2,3 b
, Eladio Montero-Porras
2 c
and Gianluca Bontempi
2,3 d
1
Aix Marseille University, CNRS, LIS, Marseille, France
2
Machine Learning Group, Universit
´
e Libre de Bruxelles, Brussels, Belgium
3
FARI Institute, Universit
´
e Libre de Bruxelles-Vrije Universiteit Brussel, Brussels, Belgium
Keywords:
Urban Traffic, Simulation Models, Road Deviation Planning, Decision Making, Digital Twin.
Abstract:
Urban traffic management faces growing challenges in evaluating and mitigating the impact of disruptive
events, such as road closures, on vehicular traffic flow. This paper presents the design and development of
an interactive tool to define and assess the impact of road deviation plans on vehicular traffic. The proposed
tool targets traffic management experts and is expected to support them in defining and comparing alternative
solutions to mitigate disruptive events (e.g. road/tunnel closures for maintenance). The proposed tool, called
TrafficTwin, can be adapted to different areas of the town, make use of different traffic models (either synthetic
or calibrated) and visualize several quantitative statistics to assess and compare alternative deviation plans.
We evaluate the proposed tool using a synthetic traffic model and assess the pertinence of the simulation tool
to support the decision-making process in transportation infrastructure management.
1 INTRODUCTION
A challenge in the traffic domain is to provide man-
agement experts and decision-makers with methods
to assess policies to optimize traffic and avoid con-
gestion, a major responsible of CO
2
emission (Hus-
sain et al., 2023). On the one hand, the impact of
the control strategies on road infrastructures is not ap-
parent until they are deployed in real-world motor-
way applications (Ku
ˇ
si
´
c et al., 2023a). On the other
hand, testing in real-life settings is costly, risky, and
often unfeasible (Argota S
´
anchez-Vaquerizo, 2021).
In this context, urban traffic simulation models have
become an indispensable asset: these tools provide a
lens through which it is possible to analyze control
strategies in silico. They rely on computational mod-
els to test these strategies before deploying them in
the real world. One key requirement for traffic mod-
els is realism. If the dynamics of simulated traffic
are close to reality, then traffic management experts
can assess the traffic resulting from the deployment of
a
https://orcid.org/0000-0002-6865-1833
b
https://orcid.org/0000-0002-0943-883X
c
https://orcid.org/0000-0002-2380-8630
d
https://orcid.org/0000-0001-8621-316X
some control strategy in the real world (Siebke et al.,
2023).
Research on what-if scenario modeling is gener-
ating increasing interest within the scientific commu-
nity. The growing complexity of decision-making
tasks requires the implementation of strategies that
enable the evaluation of the impact of various choices.
This is particularly crucial in traffic management,
where congestion can be significantly affected by a
single decision, especially in the case of disruptive
events. Therefore, it is essential to have efficient com-
putational methods that help predict and mitigate con-
gestion issues.
Ku
ˇ
si
´
c et al. (Ku
ˇ
si
´
c et al., 2023b) propose a digital
twin of the Geneva motorway, integrating real-time
traffic data from motorway traffic counters. These
data include vehicle counts, speeds, and categories,
updated every minute. The data are provided as input
to the SUMO simulator to provide accurate simula-
tion of traffic conditions. The authors use SUMO’s
calibrator objects, which adjust traffic demand in the
simulation in real time according to the input traffic
data. The proposed model allows for evaluating traf-
fic control strategies, such as variable speed limits, in
a cost-effective, real-time environment. The authors
Guastella, D. A., Silva-Muñoz, M., Montero-Porras, E., Bontempi and G.
A Simulation Tool to Assess the Impact of Deviation Plans on Disruptive Events of Urban Traffic.
DOI: 10.5220/0013518900003970
In Proceedings of the 15th International Conference on Simulation and Modeling Methodologies, Technologies and Applications (SIMULTECH 2025), pages 51-61
ISBN: 978-989-758-759-7; ISSN: 2184-2841
Copyright © 2025 by Paper published under CC license (CC BY-NC-ND 4.0)
51

measure the GEH statistics (below 5) and compare the
real and simulated traffic flow to evaluate the accuracy
of the digital twin.
Naing et al. (Naing et al., 2021) propose a dy-
namic framework for short-term microscopic traffic
forecasting using Long Short-Term Memory (LSTM)
neural networks. By integrating real-time data into
a traffic simulation, the system dynamically updates
the LSTM parameters, enabling more accurate pre-
dictions of vehicle behavior, especially in “Just-in-
Time” decision-making contexts. To perform what-if
analysis, multiple simulations are branched from the
base simulation, each one exploring different scenar-
ios based on varying traffic conditions or decisions.
The authors evaluate the proposed framework on real-
world traffic data from US Highway 101, demonstrat-
ing that the dynamic LSTM-based model outperforms
traditional models such as the Krauss car-following
model, in terms of accuracy and efficiency.
However, interactive simulation tools specifically
designed for what-if analysis of disruptive events are
limited. Adreani et al. (Adreani et al., 2022) introduce
a novel scenario model and editor, integrated into
the open-source Snap4City.org platform, to define
general processes and what-if scenarios for analysis
across different domains. The authors present a case
study on traffic flow reconstruction in the city of Flo-
rence, Italy, using the scenario editor and data-driven
tools to analyze and reconstruct traffic patterns in the
area of interest. This enables the performance of
what-if analysis, aiding in informed decision-making.
The traffic flow reconstruction relies on solving a fluid
dynamic problem formulated using partial differen-
tial equations (PDEs). PDE models often assume ho-
mogeneity in traffic flow, neglecting real-world varia-
tions such as driver behavior, heterogeneity in vehicle
dynamics, or localized phenomena (e.g., sudden lane
changes or road closures). Moreover, authors assume
the availability of data of traffic flow entering/exiting
in the area of interest, which is not always possible.
Additionally, a major limitation of the current
state-of-the-art is the lack of tools to quantitatively
and visually assess the impact of mitigation strategies.
An example is the evaluation of road deviation plans,
whose effects of deployment are often unknown. We
define a deviation plan as a set of rules that dictate
how traffic is redirected to avoid congestion. In a real-
world environment, this corresponds to strategic road
closures or the placement of road signals.
In this paper, we present a novel tool (called
TrafficTwin) for assessing the impact of alternative
road deviation plans on vehicular traffic. The main
contributions of this work are: (i) an interactive tool
to model disrupting events, such as road closures, and
the related deviation plans to divert traffic and avoid
closed roads, (ii) a simulation-based method to eval-
uate deviation plans with different traffic demands,
synthetic or calibrated, (iii) an interactive dashboard
to visualize the differences between scenarios. We
use the SUMO package to simulate realistic traffic
patterns. The proposed tool targets experts in traffic
management to define easily simulation models and
perform what-if analysis in case of disrupting events
that cause road closures. We introduce the features of
the proposed tool by showcasing a realistic case study
in the city of Brussels.
2 THE TrafficTwin
ARCHITECTURE
TrafficTwin is composed of the following compo-
nents, as shown in Figure 1:
• the data sources, currently supporting static files
containing the traffic demand definition (when us-
ing calibrated traffic), and the definition of devia-
tion plans;
• the server component, responsible for the simula-
tion of urban traffic (using SUMO), data aggrega-
tion and management;
• the message broker, based on RabbitMQ (Rab-
bitMQ, 2024), for handling the data exchange be-
tween client and server;
• the client component, allowing traffic manage-
ment expert to define virtual traffic, road closures
and deviation plans;
• the dashboard component, allowing presenting
the result of modification in urban infrastructures
through graphical plots.
.csv
Data sources Server Message broker Client UI
Figure 1: Main components of TrafficTwin. The sys-
tem consists of four components (from left to right): data
sources, a server that simulates urban traffic using SUMO
and manages data, a message broker (RabbitMQ) facilitat-
ing data exchange and a client interface for traffic experts to
define virtual scenarios.
In the following, we describe the core components
of the proposed tool.
SIMULTECH 2025 - 15th International Conference on Simulation and Modeling Methodologies, Technologies and Applications
52
2.1 Client Component (User Interface)
The graphical user interface allows three main func-
tionalities: (i) the definition of deviation plans, each
including the closed roads and the specification of
how the vehicles must be diverted to avoid closed
roads, (ii) traffic modeling, where the user can specify
the level of congestion in simulated traffic, and (iii)
dashboard, where it is possible to analyze the impact
of roadworks in traffic congestion. In the following,
we describe the functionalities of each part of the user
interface.
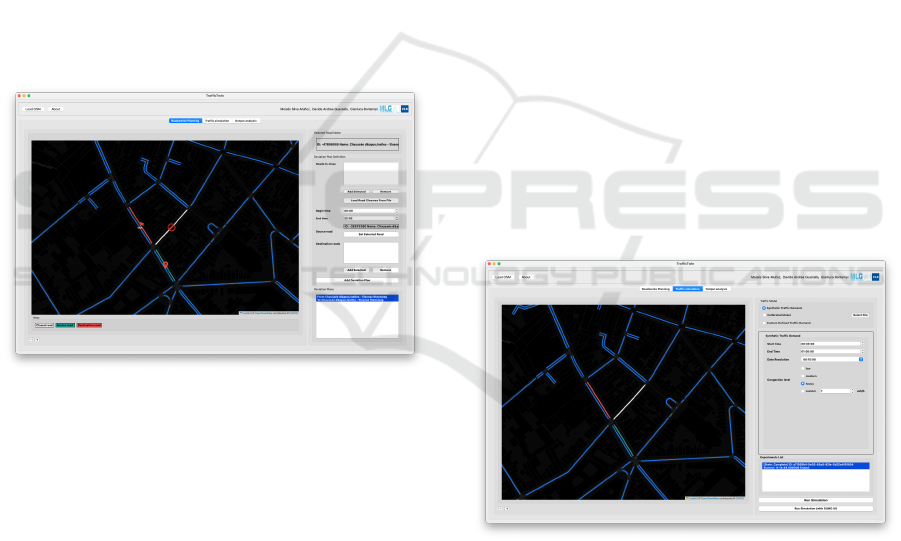
Definition of Deviation Plans
The panel for managing disrupting events (Figure 2)
enables the definition of road closures and deviation
plans. Herein, a deviation plan consists of a set of
roads where vehicles cannot drive, a time interval
defining the temporal horizon of the plan, a source
road, and a set of destination roads to which vehicles
are redirected during road closures.
Figure 2: Roadworks planning in the proposed tool. On the
left a map is shown, with roads represented as blue lines.
Also, yellow lines represent closed roads, green lines the
source roads, and red lines represent the destination roads.
Simulated vehicles cannot enter the roads highlighted in
gray. In the sidebar to the right, a “Deviation Plan Defini-
tion” is set, where users can close specific roads, define time
intervals for closures, and specify rerouting plans (source
and destination roads).
We implement the deviation plans in SUMO by
properly configuring rerouters. The rerouters allows
vehicles’ routes to be modified as they travel over spe-
cific roads (the source roads in the deviation plan),
based on the available options and the current traffic
conditions (Lopez et al., 2018). When a new desti-
nation is selected, the fastest route is calculated from
the vehicles’ current position to the new destination
(see red line in Figure 2). However, it is not always
possible to determine a new alternative route. This
is mainly due to the conditions of the road network.
In this case, the rerouter has no effect and the vehi-
cle’s original route is maintained. If the edge ahead
is closed due to roadwork, the vehicle waits until the
edge is reopened, leading to congestion. However,
after a predefined time (in SUMO), the vehicle is re-
moved from the simulation.
The following XML code shows the definition of
a rerouter for use with SUMO.
<rerouter id="example" edges="-19 -17 -25
9">
<interval begin="0" end="3600">
<closingReroute id="-9" disallow="
all"/>
</interval>
</rerouter>
Using the previously defined rerouter, vehicular
traffic is prohibited on the edge with ID -9 and redi-
rected to the adjacent edges with IDs -17, -25, and 9,
respectively. The closure of edge -9 occurs between
time instants 0 and 3600 seconds. The TrafficTwin
software allows to define deviation plans through an
easy-to-use interface. In this way, it is not neces-
sary for non-expert users to have specific knowledge
on how to encode rerouters for simulating deviation
plans.
The TrafficTwin user interface (Figure 3) allows
configuring the traffic demand used by SUMO to
replicate the realistic dynamics of traffic.
Figure 3: Traffic simulation modeling interface in the pro-
posed tool. The tool displays on the right the road network
(blue lines), the closed roads (in yellow), the source roads
(in green), the destination roads (in red). The sidebar on
the right contains settings for configuring the traffic model,
including options for synthetic traffic demand, calibrated
models, or custom traffic demand inputs. Users can spec-
ify a time range for the simulation, set the data resolution,
and adjust the congestion level (low, medium, heavy, or cus-
tom).
Currently, the proposed tool supports the defini-
tion of the synthetic traffic demand (specifying the
number of vehicles per hour), and the use of traffic
A Simulation Tool to Assess the Impact of Deviation Plans on Disruptive Events of Urban Traffic
53
models generated from external calibration tools.
When using a calibrated model, the traffic demand
is generated from realistic traffic data. The traffic de-
mand consists of a set of vehicles to be inserted into
the simulation, with each vehicle defined by a time
instant (when it enters the simulation) and the set of
roads it drives on to reach its destination (Guastella
et al., 2025).
When defining synthetic traffic demand, Traf-
ficTwin allows the user to specify the number of ve-
hicles per hour to be included in the simulation. In
the resulting traffic demand, each vehicle is assigned
a random origin and destination, and its route is de-
termined using the Dijkstra algorithm (Utomo et al.,
2023).
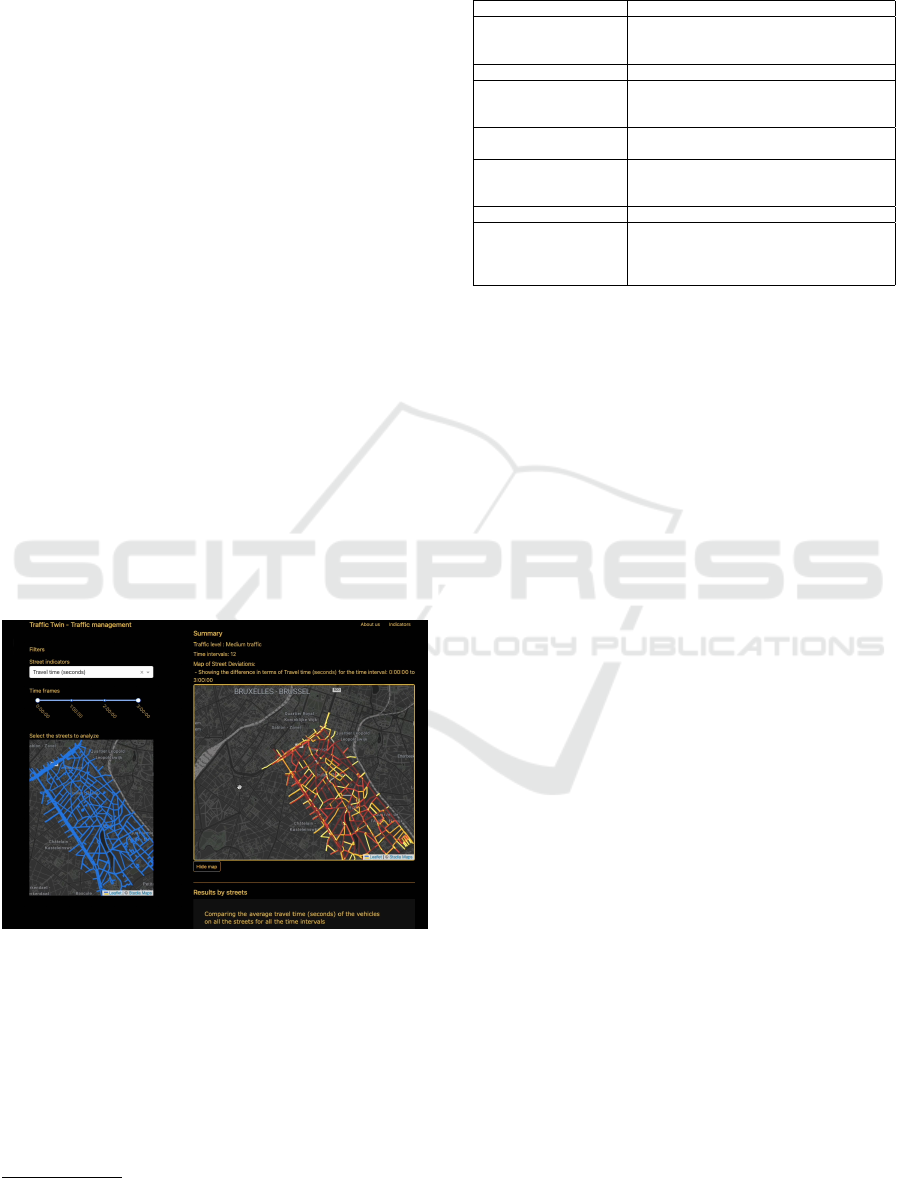
Dashboard for Simulation Analysis
TrafficTwin includes an interactive dashboard for
conducting a comparative analysis of simulation out-
comes. The dashboard visualizes different traffic at-
tributes obtained from two simulations: one in which
deviation plan configurations are active and another
where they are not. By comparing the results of the
two simulations, traffic management experts can as-
sess the impact of roadworks on traffic congestion
without any technical knowledge about the function-
ing of the simulation tool. Figure 4 shows the dash-
board, developed as a web application using Dash
1
).
Figure 4: Interface for analyzing the simulated traffic with
and without roadworks.
Table 1 lists the attributes that can be analyzed
with the dashboard.
2.2 Server Component
The server component is responsible for performing
traffic simulations by using the open-source simulator
1
https://dash.plotly.com. Last visited: February 6, 2025
Table 1: Traffic attributes that can be analyzed with the
dashboard available in TrafficTwin.
Attribute (unit) Description
Edge Occupancy (%)
Occupancy of the edge/lane in %. A value of
100 would indicate vehicles standing bumper
to bumper on the whole edge (minGap=0).
Edge Density (#veh/km) Vehicle density on the edge
Waiting Time (s)
The total number of seconds vehicles were
considered halting (speed <speedThreshold).
Summed up over all vehicles
Average Speed (m/s)
The mean speed on the edge/lane within the
reported interval.
Time Loss (s)
The total number of seconds vehicles lost due
to driving slower than desired (summed up
over all vehicles)
Travel Time (s)
Time needed to pass the edge/lane.
Sampled Seconds (s)
The number of vehicles that are present on the
edge/lane in each second summed up over the
measurement interval (may be subseconds if a
vehicle enters/leaves the edge/lane).
SUMO. This tool allows emulating the complex dy-
namics of traffic, including stop-and-go patterns, traf-
fic lights, and junctions. In SUMO, the road network
is modeled as a graph, where the edges represent the
roads and the vertices represent the junctions. Vehi-
cles in SUMO are defined by an identifier, departure
time, and route through the road network. A vehicle
can be described in more detail, including properties
such as departure and arrival times, the lane to use,
and maximum and minimum speeds. Also, each ve-
hicle can be associated with a class that defines its
type (for instance, private vehicles, taxis, coaches,
trucks, or bicycles). Each class has different proper-
ties that determine how vehicles move within the road
network.
We assume that the user can generate synthetic
traffic or use a pre-existing (calibrated) traffic model.
The former case is useful when no realistic traffic
model is available, or when the user wants to deter-
mine the impact of different deviation plans under un-
known traffic conditions. The latter case is useful for
evaluating deviation plans in a realistic traffic condi-
tion, that is, in a simulation model where vehicles fol-
low realistic routes (similar to real traffic flow).
We use the randomTrips tool provided
with SUMO to generate synthetic traffic demand.
randomTrips generates a set of random routes (ran-
dom departure and destination points) for a given
road network. Each route is associated with at least
one vehicle. To generate realistic traffic demand,
the randomTrips tool allows, through the parame-
ter --insertion-rate to specify the number of ve-
hicles per time interval. In this way, it is possible to
simulate the variation of traffic during peak hours.
The randomTrips tool first generates a set of
origins and destinations for the specified number of
vehicles, with this number provided as input. The
randomTrips tool uses the Dijkstra algorithm to find
routes connecting the origin and destination for all ve-
SIMULTECH 2025 - 15th International Conference on Simulation and Modeling Methodologies, Technologies and Applications
54

hicles. The parameters used to generate random traf-
fic for each simulation are the insertion rate and the
fringe value: the former refers to the number of ve-
hicles per hour to be introduced into the simulation;
the latter determines the probability that an edge at
the boundary of the modeled road network is selected
as the origin or destination of a vehicle. This allows
modeling vehicles whose origin or destination is over
the modeled road network.
We input the following parameters to generate
random traffic (Guastella et al., 2023):
• network: the road network definition;
• begin: begin time of the simulation;
• end: end time of the simulation;
• insertion rate: the expected number of vehicles
per hour. By varying this parameter, it is possible
to control the amount of traffic in the simulation.
This is modeled in the “Traffic Modeling” inter-
face.
The output of randomTrips is a list of vehicles,
each associated with a route. The set of vehicles is in
XML format. The calibrated traffic models supported
by TrafficTwin are in the same XML format, contain-
ing a list of vehicles associated with the starting time
and an edge list that constitutes their route. This can
be generated starting from real traffic count data and
using standard tool such as RouteSampler (Behrisch
and Hartwig, 2022), included with SUMO.
2.3 Communication Between Client and
Server
We use RabbitMQ (RabbitMQ, 2024), an open-
source message broker that acts as an intermediary
between the client (user interface) and the server
through a message queuing technique. Message queu-
ing is a method of communication between applica-
tions or components. With message queueing, client
and server can remain independent while processing
their individual tasks. Messages are typically small
requests, responses, status updates, or simple pieces
of information. A message queue temporarily stores
these messages, allowing applications to send and re-
ceive them as needed. One advantage of this approach
is that systems are loosely coupled-they do not need
to know the physical location of other components;
a simple name is sufficient to reach them. This en-
ables systems to evolve independently without affect-
ing one another, as the reliable delivery of messages
is managed by the broker.
RabbitMQ uses an Erlang-based implementa-
tion of the Advanced Message Queuing Protocol
(AMQP), an open standard protocol that defines how
a system can exchange messages (RabbitMQ, 2024).
The protocol defines a set of rules that the communi-
cating system must follow. It also defines the repre-
sentation of messages and commands exchanged be-
tween several systems.
In the proposed tool, we use two message queues
to facilitate communication between the client and the
server. One queue is used to transfer requests from
the client to the server, mainly involving the execution
of simulations and uploading OpenStreetMap (OSM)
files. Communications from the server to the client
transfer the output of the simulations.
The use of message queues enables the configu-
ration and subsequent execution of numerous simula-
tions on the server.
3 EXPERIMENTAL RESULTS
This section presents a case study where TrafficTwin
is used to assess alternative deviation plans designed
to mitigate congestion when different roads are closed
due to roadworks (or other events). The case study fo-
cuses on the area of the Ixelles municipality in Brus-
sels, Belgium.
We begin by defining the road network, model-
ing the roadworks (by closing roads to vehicular traf-
fic), and establishing the deviation plans and traffic
demand (Section 3.1). We define two configurations,
each containing different deviation plans for the same
set of roadworks (closed roads). The configurations of
deviation plans differ in the choice of possible edges
where vehicles can transit in order to deviate their tra-
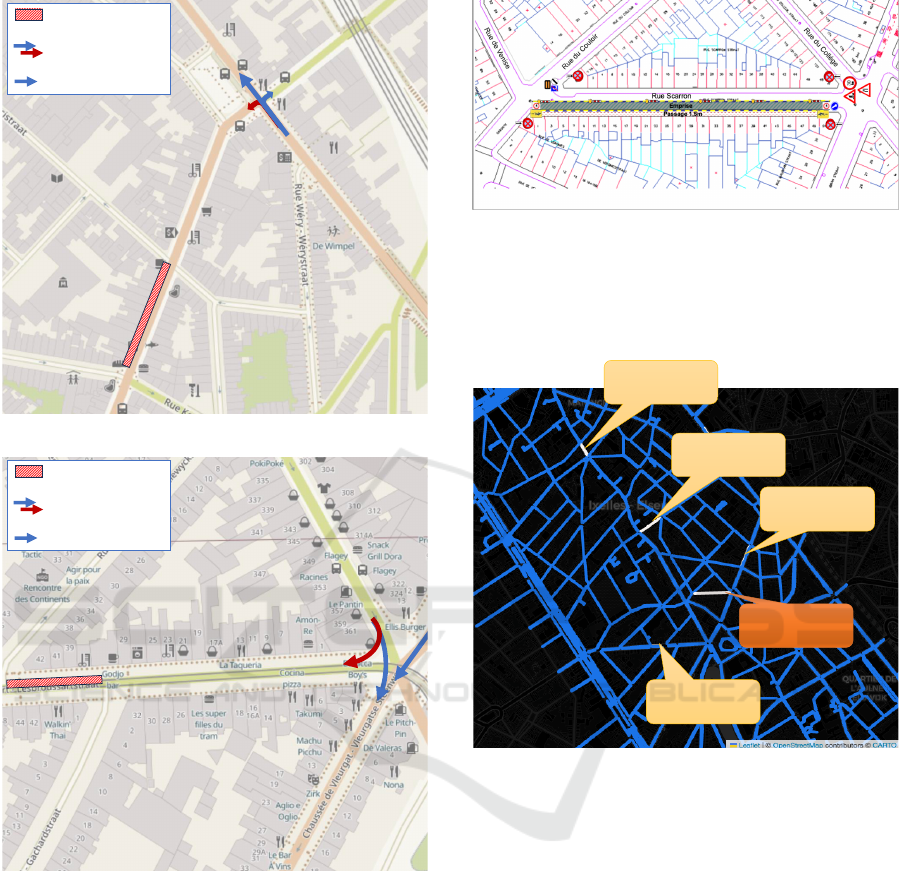
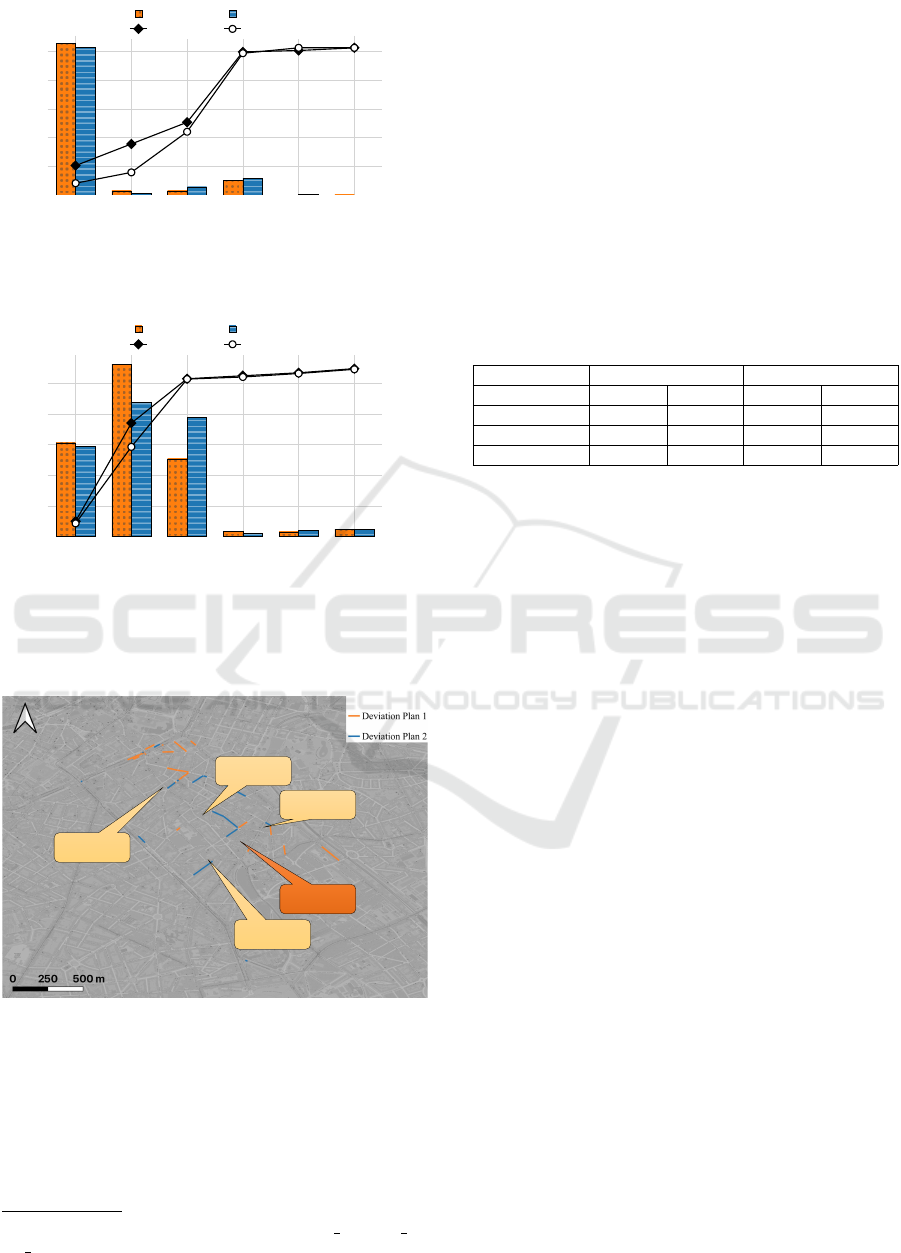
jectory to avoid closed edges. Let us consider the two
deviation plans in Figure 5. In Figure 5a we define
two possible alternatives for diverting traffic. In De-
viation Plan 1, vehicles can go left, right, or straight.
However, allowing vehicles to turn left could lead to
congestion on minor streets near the roadwork site.
For this reason, we have defined a second Deviation
Plan, where vehicles can only go straight or turn right.
Similarly to the previous case, the deviation plan 2 in
Figure 5b prevents vehicles from entering a partially
closed road. Deviation plans can be set up to model
various situations requiring traffic diversion, such as
tunnel closures, roadworks, accidents, or strikes.
In Section 3.2, we verify the effectiveness of the
first configuration by comparing the traffic statistics
with and without roadworks. In Section 3.3, we com-
pare the first configuration to the alternative one to
determine if a different deviation plan would be more
effective in reducing the impact of roadworks on ve-
hicular traffic (e.g. in terms of congestion).
A Simulation Tool to Assess the Impact of Deviation Plans on Disruptive Events of Urban Traffic
55
Closed road
Deviation Plan 1
Deviation Plan 2
(a)
Closed road
Deviation Plan 1
Deviation Plan 2
(b)
Figure 5: Two alternative deviation plans for the roadworks
(indicated as white and red rectangles) in Rue Malibran
(Figure 5a) and Rue Lesbroussarts (Figure 5b). In the main
deviation plan, vehicles can follow the directions indicated
by both red and blue arrows, whereas in the alternative de-
viation plan vehicles follow only the direction indicated by
blue arrows.
3.1 Scenario Modeling
We use OSM to extract the road network in the con-
cerned area and load it in TrafficTwin. Figure 6 shows
a roadwork plan provided by the municipality of Ix-
elles. Figure 7 shows the location of the roads (around
Rue Scarron) where we simulate the presence of road-
works.
Figure 6: Detailed roadwork plan for Rue Scarron (Ixelles,
Brussels, Belgium), outlining the restricted areas during
construction activities. This is provided by Brussels Mobil-
ity, the government agency responsible for managing and
developing transport infrastructure in the Brussels-Capital
Region of Belgium.
Chaussée
d’Ixelles
Rue du
Viaduc
Rue Malibran
Rue Scarron
Rue
Lesbroussarts
Figure 7: Location of the roadworks in the area of Ixelles
(Belgium), implemented using the proposed tool.
To assess the impact of the deviation plan on ve-
hicular traffic, we present the results of two scenar-
ios: one with roadworks, considering a configuration
of deviation plans (Figure 7), one without roadworks.
Then, we evaluate an alternative configuration of de-
viation plans to assess if this allows for minimizing
the congestion.
We consider a 1-hour traffic simulation and we
generate random traffic using the randomTrips tool
available with SUMO. By considering random traf-
fic, we can evaluate the effects of road closures under
different hypothetical traffic congestion levels.
We introduce stochasticity to better replicate real-
ity in simulation scenarios by varying i) the departure
times of vehicles (uniform distribution over [1, 60]
seconds) and ii) the edge weights so that the Dijkstra
algorithm returns different routes for the same origin-
destination pair. Weight perturbation allows us to take
into account drivers’ individual preferences.
SIMULTECH 2025 - 15th International Conference on Simulation and Modeling Methodologies, Technologies and Applications
56
This stochastic approach results in different con-
gestion outcomes with each simulation run. To cap-
ture this variability, we perform 100 simulation for
each traffic congestion level.
Finally, we analyze the simulation output. We be-
gin by edge-wise measurements returned by SUMO,
then we analyze aggregated information on individual
vehicle trips. The first analysis aims to show that, on
average, the congestion level increases when multiple
roadworks are present. The second analysis aims to
show that, on average, vehicles take longer to reach
their destinations when roadworks are in place. This
information is expected to support traffic management
experts in assessing the impact of deviation plans in a
virtual setting before real-world deployment.
3.2 Deviation Plan Assessment
(With/Without Roadworks)
This Section presents the assessment of the first devi-
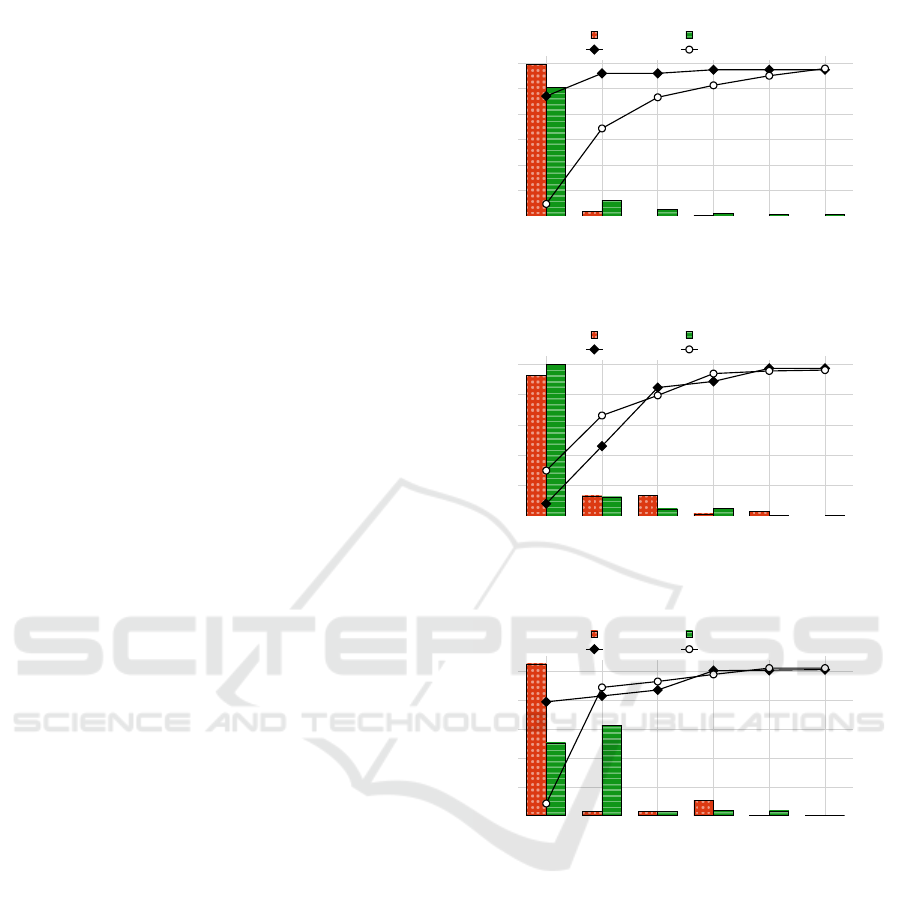
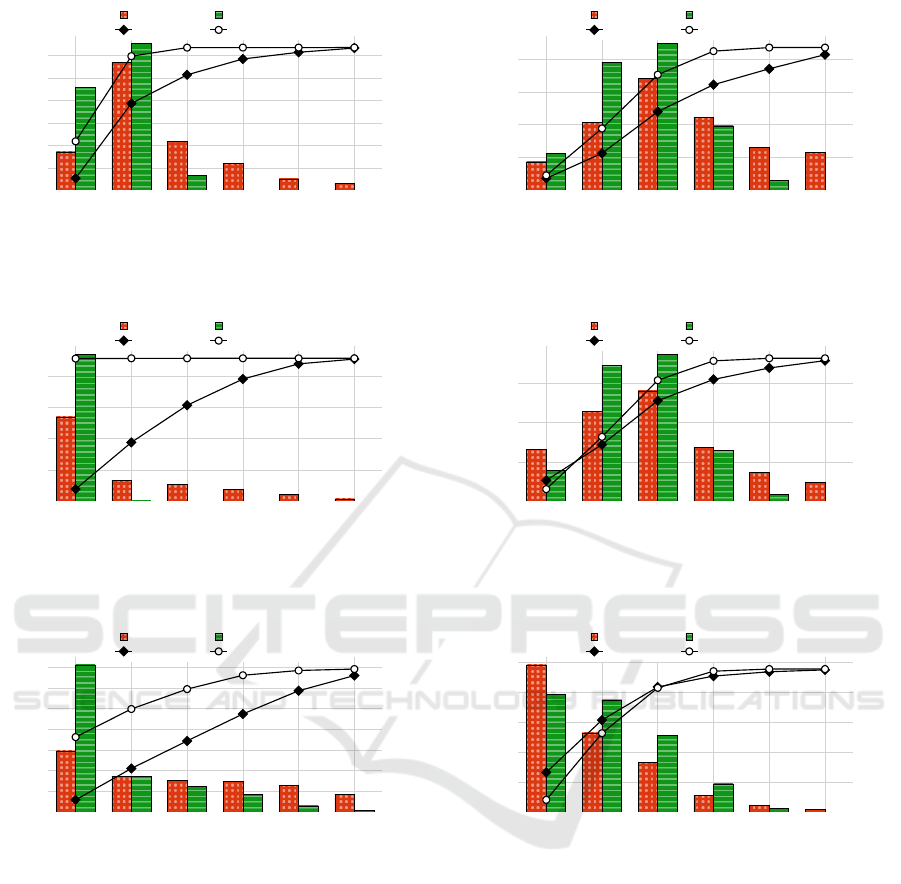
ation plan. Figure 8 shows the Pareto chart (Wilkin-
son, 2006) clustering the edges according to the av-
erage density (in #veh/km), considering the simula-
tions with and without roadworks. The line represents
the cumulative percentage of the average density. The
density measures the average spacing of vehicles per
km, obtained by dividing the number of vehicles by
the road segment length.
For 500 and 2000 vehicles, there’s no remarkable
difference in average density after road closures. Con-
trarily, when 5000 vehicles are present, the average
density is lower compared to scenarios without road
closures. Although this outcome may seem counterin-
tuitive, it can be explained by the elimination of cer-
tain bottlenecks at intersections that typically cause
congestion. Additionally, deviation plans may reroute
traffic away from areas affected by roadworks. When
vehicles are diverted, their destinations may change
as a result of the deviation plans, further contributing
to a reduction in vehicle density within the road net-
work.
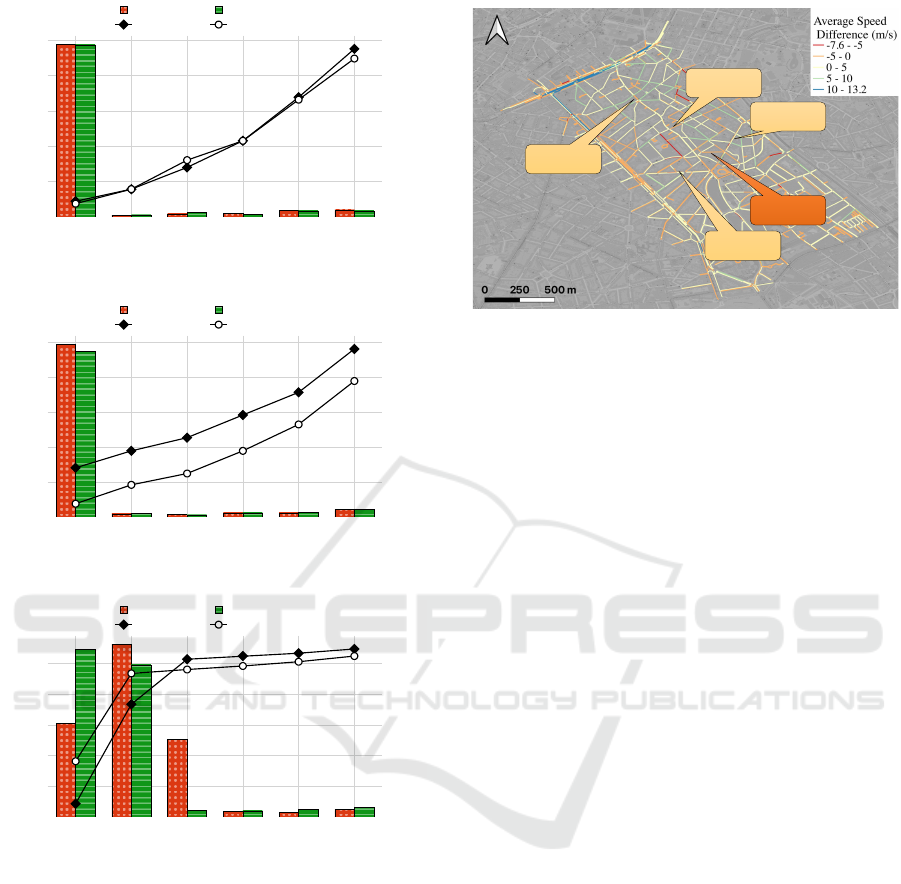
Figure 9 shows the Pareto chart clustering the
edges by average speed (in m/s), from simulations
with and without roadworks. For scenarios with 500
and 2000 vehicles, the absolute average speed dif-
ference obtained by the simulations with and with-
out roadworks is not significant. However, when con-
sidering 5000 vehicles per hour, the average speed is
higher in the case of roadworks. As for the traffic
density measure, this can be caused by the elimina-
tion of certain bottlenecks at intersections that typi-
cally cause congestion.
Figure 10 shows the road network, with edges col-
ored based on the absolute difference in average speed
[1.0, 39.0)
[39.0, 76.9)
[76.9, 114.9)
[114.9, 152.8)
[152.8, 190.8)
[190.8, 228.7)
0
100
200
300
400
500
600
80%
90%
100%
With Roadworks
With Roadworks
Without Roadworks
Without Roadworks
Density
Number of Edges
Cumulative Percentage
(a) 500 vehicles
[4.5, 61.0)
[61.0, 117.5)
[117.5, 174.0)
[174.0, 230.5)
[230.5, 287.0)
[287.0, 343.5)
0
100
200
300
400
500
80%
90%
100%
With Roadworks
With Roadworks
Without Roadworks
Without Roadworks
Density
Number of Edges
Cumulative Percentage
(b) 2000 vehicles
[66.0, 113.7)
[113.7, 161.4)
[161.4, 209.1)
[209.1, 256.8)
[256.8, 304.6)
[304.6, 352.3)
0
100
200
300
400
500
40%
50%
60%
70%
80%
90%
100%
With Roadworks
With Roadworks
Without Roadworks
Without Roadworks
Density
Number of Edges
Cumulative Percentage
(c) 5000 vehicles
Figure 8: Average density of vehicles per edge, measured
in #veh/km, using 500 (Figure 8a), 2000 (Figure 8b), and
5000 vehicles (Figure 8c). Lower values are better.
between simulations with and without roadworks, in
the 5000 vehicles scenario.
A positive speed difference indicates that the road-
works have a major impact in congestion, as in this
case the average speed is lower. Contrarily, a negative
difference indicates a higher speed in the simulation
when roadworks are applied. This can be attributed
to the configuration of deviation plans, which allow
for avoiding congested areas of the environment, re-
ducing average traffic and resulting in higher vehicles
speed. We also observe a greater difference in bound-
ary roads, particularly in the northern part of the en-
A Simulation Tool to Assess the Impact of Deviation Plans on Disruptive Events of Urban Traffic
57
[7.5, 8.3) [8.3, 9.2) [9.2, 10.0) [10.0, 10.9) [10.9, 11.7) [11.7, 12.6)
0
100
200
300
400
500
80%
With Roadworks
With Roadworks
Without Roadworks
Without Roadworks
Speed (m/s)
Number of Edges
Cumulative Percentage
(a) 500 vehicles
[7.3, 8.2) [8.2, 9.0) [9.0, 9.9) [9.9, 10.7) [10.7, 11.6) [11.6, 12.4)
0
100
200
300
400
500
80%
90%
With Roadworks
With Roadworks
Without Roadworks
Without Roadworks
Speed (m/s)
Number of Edges
Cumulative Percentage
(b) 2000 vehicles
[4.9, 6.1) [6.1, 7.3) [7.3, 8.5) [8.5, 9.7) [9.7, 10.9) [10.9, 12.0)
0
50
100
150
200
250
20%
30%
40%
50%
60%
70%
80%
90%
100%
With Roadworks
With Roadworks
Without Roadworks
Without Roadworks
Speed (m/s)
Number of Edges
Cumulative Percentage
(c) 5000 vehicles
Figure 9: Average speed of vehicles (m/s) in the simulations
with and without roadworks, using 500 (Figure 9a), 2000
(Figure 9b), and 5000 vehicles (Figure 9c). Higher values
are better.
vironment. Although this area is not directly affected
by any roadworks, this highlights how simulation can
reveal emerging traffic dynamics that may not be eas-
ily identified through analytical methods.
The results presented so far refer to network
edges. In what follows, we present individual trip
statistics.
Figure 11 compares the average duration of trips
(shorter trips are obviously preferable) with and with-
out roadworks. This is the time required by vehicles
to go from origin to destination.
Chaussée
d’Ixelles
Rue du
Viaduc
Rue Malibran
Rue Scarron
Rue
Lesbroussarts
Figure 10: Average absolute speed difference obtained by
the simulation with and without the roadworks.
Without roadworks, trip duration is generally
shorter. When roadworks are present, trips take more
time as vehicles face delays and detours due to road
closures. The comparison highlights the significant
impact roadworks have on travel time, causing con-
gestion and longer trips.
Figure 12 compares the average trip lengths with
and without roadworks. Vehicles adjust their routes
when they encounter rerouters, placed on roads near
the closed ones. As expected, this leads to longer
paths to bypass the closures and reach the destination.
However, not all destinations are reachable due to
road closures, primarily because of the limited scope
of the considered environment. For this reason, it is
possible to include in the simulator a probability for
drivers to change the destination (in our experiments
this value was set to 0.5). Note that if a vehicle does
not change its destination and the deviation plan does
not allow finding an alternative route (because both
road network configuration and deviation plan), the
vehicle remains stationary in front of the closed road
until it is reopened. In this case, SUMO teleports ve-
hicles that wait too long to avoid grid-locks.
3.3 Alternative Deviation Plans
Assessment
This Section focuses on the comparison of two al-
ternative deviation plans. Figure 13 compares the
respective average edge density and vehicle speed.
This result is obtained as the average of each attribute
after 100 simulations, using the same set of routes.
For both configurations, we show the results obtained
from 1 hour of simulation using 5000 vehicles per
hour.
The density plot does not reveal significant differ-
ences, while the speed comparison indicates that the
average speed is higher when using the first deviation
SIMULTECH 2025 - 15th International Conference on Simulation and Modeling Methodologies, Technologies and Applications
58
[1.0, 250.1)
[250.1, 499.3)
[499.3, 748.4)
[748.4, 997.6)
[997.6, 1246.7)
[1246.7, 1495.9)
0
20
40
60
80
100
120
10%
20%
30%
40%
50%
60%
70%
80%
90%
100%
With Roadworks
With Roadworks
Without Roadworks
Without Roadworks
Duration (s)
Number of Trips
Cumulative Percentage
(a) 500 vehicles
[1.0, 804.3)
[804.3, 1607.6)
[1607.6, 2410.9)
[2410.9, 3214.1)
[3214.1, 4017.4)
[4017.4, 4820.7)
0
200
400
600
800
60%
70%
80%
90%
100%
With Roadworks
With Roadworks
Without Roadworks
Without Roadworks
Duration (s)
Number of Trips
Cumulative Percentage
(b) 2000 vehicles
[1.0, 1006.9)
[1006.9, 2012.7)
[2012.7, 3018.6)
[3018.6, 4024.4)
[4024.4, 5030.3)
[5030.3, 6036.1)
0
200
400
600
800
1000
1200
1400
30%
40%
50%
60%
70%
80%
90%
100%
With Roadworks
With Roadworks
Without Roadworks
Without Roadworks
Duration (s)
Number of Trips
Cumulative Percentage
(c) 5000 vehicles
Figure 11: Average duration (in seconds) of the trips, us-
ing 500 (Figure 11a), 2000 (Figure 11b), and 5000 vehicles
(Figure 11c). Lower values are better.
plans. This suggests that the first plan is more effec-
tive in reducing congestion. The same analysis in-
dicates that, in some cases, the second configuration
outperforms the first, notably in the range [7, 8.3]. By
examining the locations of the edges where the aver-
age vehicle speed falls within this range (Figure 14),
it appears that most edges are near the roadwork sites.
This suggests that using the second plan would result
in higher average speeds on edges in the proximity of
the roadworks.
[0.0, 883.7)
[883.7, 1767.5)
[1767.5, 2651.2)
[2651.2, 3535.0)
[3535.0, 4418.7)
[4418.7, 5302.5)
0
20
40
60
80
0%
10%
20%
30%
40%
50%
60%
70%
80%
90%
100%
With Roadworks
With Roadworks
Without Roadworks
Without Roadworks
Route Length (m)
Number of Trips
Cumulative Percentage
(a) 500 vehicles
[0.0, 923.2)
[923.2, 1846.4)
[1846.4, 2769.6)
[2769.6, 3692.8)
[3692.8, 4616.0)
[4616.0, 5539.2)
0
100
200
300
0%
10%
20%
30%
40%
50%
60%
70%
80%
90%
100%
With Roadworks
With Roadworks
Without Roadworks
Without Roadworks
Route Length (m)
Number of Trips
Cumulative Percentage
(b) 2000 vehicles
[0.0, 918.2)
[918.2, 1836.5)
[1836.5, 2754.7)
[2754.7, 3673.0)
[3673.0, 4591.2)
[4591.2, 5509.5)
0
200
400
600
800
1000
30%
40%
50%
60%
70%
80%
90%
100%
With Roadworks
With Roadworks
Without Roadworks
Without Roadworks
Route Length (m)
Number of Trips
Cumulative Percentage
(c) 5000 vehicles
Figure 12: Average length (in meters) of the routes, us-
ing 500 (Figure 12a), 2000 (Figure 12b), and 5000 vehicles
(Figure 12c). Lower values are better.
In some cases, congestion is caused by vehicles
that cannot reach their destinations due to road clo-
sures. Suppose a road is closed, and this road is re-
quired for a vehicle to reach its destination. If no
alternative route is available, the vehicle will remain
stationary in front of the closed edge, waiting for it
to reopen. This situation leads to congestion, which
the simulator resolves by teleporting the vehicle af-
ter a predefined time. A teleported vehicle is removed
from the network. It is then moved along its route, but
no longer being on the street, and reinserted into the
A Simulation Tool to Assess the Impact of Deviation Plans on Disruptive Events of Urban Traffic
59
[106.8, 148.7)
[148.7, 190.6)
[190.6, 232.5)
[232.5, 274.3)
[274.3, 316.2)
[316.2, 358.1)
0
100
200
300
400
500
90%
100%
Deviation Plan 1
Deviation Plan 1
Deviation Plan 2
Deviation Plan 2
Density
Number of Edges
Cumulative Percentage
(a) Average edge density (#veh/km). Lower values are bet-
ter.
[4.5, 5.8) [5.8, 7.0) [7.0, 8.3) [8.3, 9.5) [9.5, 10.8) [10.8, 12.0)
0
50
100
150
200
250
20%
30%
40%
50%
60%
70%
80%
90%
100%
Deviation Plan 1
Deviation Plan 1
Deviation Plan 2
Deviation Plan 2
Speed (m/s)
Number of Edges
Cumulative Percentage
(b) Average speed (m/s). Higher values are better.
Figure 13: Average edge density (Figure 13a), speed (Fig-
ure 13b) obtained by the comparison of two alternative de-
viation plans.
Chaussée
d’Ixelles
Rue du
Viaduc
Rue Malibran
Rue Scarron
Rue
Lesbroussarts
speed
>5.8&<7
Figure 14: Location of the edges which average speed falls
in the range [7, 8.3] using the two deviation plan configura-
tions.
network as soon as this becomes possible
2
. To solve
this issue, a rerouted vehicle has a 50% probability of
changing its destination if it cannot reach its original
destination road.
We evaluate the number of teleported vehicles as
2
https://sumo.dlr.de/docs/Simulation/Why Vehicles
are teleporting.html. Last visited: February 6, 2025
a congestion metric to compare the effectiveness of
two deviation plan configurations by quantifying (1)
the number of vehicles that cannot reach their desti-
nation due to a closed road and (2) the number of ve-
hicles teleported due to congestion phenomena aris-
ing from the closed road and the deviation plan con-
figuration. Table 2 compares the average number of
teleported vehicles using both deviation plan configu-
rations. Each value is calculated as the average num-
ber of vehicles teleported in the 100 simulations per-
formed for each configuration.
Table 2: Average number of teleported vehicles using the
two deviation plan configurations. The lower the average
value, the more vehicles find an alternative route to reach
their destination without being teleported.
Deviation Plan 1 Deviation Plan 2
Average Std Dev Average Std Dev
500 Vehicles 0.68 0.004 0.61 0.008
2000 Vehicles 0.74 0.039 0.43 0.063
5000 Vehicles 6.4 0.58 6.13 0.59
From the results shown in Table 2, we can observe
that, on average, the number of teleported vehicles in
both deviation plan configuration is low. This indi-
cates that the majority of vehicles are able to find an
alternative route to reach their destination.
4 CONCLUSION AND FUTURE
WORKS
This paper introduces TrafficTwin, a tool to assist traf-
fic management experts in decision-making tasks, by
enabling the design and assessment of alternative de-
viation plans.
The tool is based on a client-server architecture.
The server component is responsible for simulat-
ing traffic, while the client component enables traf-
fic management experts to define deviation plans and
traffic demand through a graphical user interface. We
also developed a dashboard to visualize plots that can
be used by traffic management experts to evaluate the
impact of disruptive events.
The TrafficTwin software is based on the SUMO
package. This simulator software typically has a steep
learning curve, which poses a barrier to non-expert
users. TrafficTwin enables researchers, urban plan-
ners, and decision-makers to use SUMO’s simula-
tion capabilities without needing extensive technical
knowledge. This positions TrafficTwin as a key tool
for making SUMO accessible to non-expert users.
TrafficTwin should be intended as an enabler for
a more general digital twin solution to assist traffic
officers in decision-making. The challenges still to
SIMULTECH 2025 - 15th International Conference on Simulation and Modeling Methodologies, Technologies and Applications
60

address are: (i) continuously calibrating traffic us-
ing real-time count data, and (ii) employing machine
learning methods to suggest the best deviation plans
that minimize the impact of roadworks. For challenge
(i), the key difficulty lies in balancing off-line and
online (simulation-based) methods for traffic calibra-
tion using real-world data. Although online methods
are typically more accurate due to their reliance on
realistic vehicle dynamics, they are computationally
intensive, making the development of traffic digital
twins more challenging. For the (ii), the aim is to use
machine learning techniques to extract insights from
various traffic models. By analyzing traffic dynamics
over time, these methods can provide recommenda-
tions on where disruptive events are likely to have the
greatest impact, potentially causing significant con-
gestion effects.
Furthermore, we will investigate the integration of
our tool with Unity 3D to provide a more realistic
view of the urban environment. This will allow traf-
fic management experts to evaluate control policies
within a highly realistic digital twin before deploying
them in the real world. This virtual environment can
also be used by citizens to understand the impact of
these policies on traffic, thereby promoting alternative
forms of mobility to private vehicles.
ACKNOWLEDGEMENTS
This research work is being funded by
Paradigm.Brussels. This project was supported
by the FARI - AI for the Common Good Institute
(ULB-VUB), financed by the European Union,
with the support of the Brussels Capital Region in
Belgium. (Innoviris and Paradigm). G. Bontempi
is also supported by the Service Public de Wallonie
Recherche under grant nr 2010235–ARIAC by
DigitalWallonia4.ai. Part of this research work is
being developed in the context of TORRES (Traffic
prOcessing foR uRban EnvironmentS), a Joint R&D
Project (2022-RDIR-59b) funded by “R
´
egion de
Bruxelles-Capitale - Innoviris”.
REFERENCES
Adreani, L., Bellini, P., Bilotta, S., Bologna, D., Collini, E.,
Fanfani, M., and Nesi, P. (2022). Smart City Scenario
Editor for General What-if Analysis. Preprint; url:
doi.org/10.20944/preprints202402.1163.v1.
Argota S
´
anchez-Vaquerizo, J. (2021). Getting Real: The
Challenge of Building and Validating a Large-Scale
Digital Twin of Barcelona’s Traffic with Empiri-
cal Data. ISPRS International Journal of Geo-
Information, 11(1):24.
Behrisch, M. and Hartwig, P. (2022). A comparison of
SUMO’s count based and countless demand genera-
tion tools. SUMO Conference Proceedings, 2:125–
131.
Guastella, D. A., Cornelis, B., and Bontempi, G. (2023).
Traffic simulation with incomplete data: the case of
brussels. In Proceedings of the 1st ACM SIGSPATIAL
International Workshop on Methods for Enriched Mo-
bility Data: Emerging Issues and Ethical Perspectives
2023, EMODE ’23, page 15–24, New York, NY, USA.
Association for Computing Machinery.
Guastella, D. A., Morales-Hern
´
andez, A., Cornelis, B., and
Bontempi, G. (2025). Calibration of vehicular traffic
simulation models by local optimization.
Hussain, Z., Kaleem Khan, M., and Xia, Z. (2023). In-
vestigating the role of green transport, environmental
taxes and expenditures in mitigating the transport CO2
emissions. Transportation Letters, 15(5):439–449.
Ku
ˇ
si
´
c, K., Schumann, R., and Ivanjko, E. (2023a). A dig-
ital twin in transportation: Real-time synergy of traf-
fic data streams and simulation for virtualizing motor-
way dynamics. Advanced Engineering Informatics,
55:101858.
Ku
ˇ
si
´
c, K., Schumann, R., and Ivanjko, E. (2023b). A digi-
tal twin in transportation: Real-time synergy of traffic
data streams and simulation for virtualizing motorway
dynamics. 55:101858.
Lopez, P., Wiessner, E., Behrisch, M., Bieker-Walz, L.,
Erdmann, J., Flotterod, Y.-P., Hilbrich, R., Lucken,
L., Rummel, J., and Wagner, P. (2018). Microscopic
traffic simulation using sumo. In 2018 21st Interna-
tional Conference on Intelligent Transportation Sys-
tems (ITSC), pages 2575–2582. IEEE.
Naing, H., Cai, W., Hu, N., Wu, T., and Yu, L. (2021). Data-
driven Microscopic Traffic Modelling and Simulation
using Dynamic LSTM. In Proceedings of the 2021
ACM SIGSIM Conference on Principles of Advanced
Discrete Simulation, SIGSIM-PADS ’21, page 1–12,
New York, NY, USA. Association for Computing Ma-
chinery.
RabbitMQ (2024). Rabbitmq.
Siebke, C., Mai, M., and Prokop, G. (2023). What Do
Traffic Simulations Have to Provide for Virtual Road
Safety Assessment? Human Error Modeling in Traf-
fic Simulations. In Proceedings of the IEEE Con-
ference on Intelligent Transportation Systems, vol-
ume 24, pages 1419–1436.
Utomo, D. D., Aurelia, M., Tanasia, S. M., Nurhasanah, and
Handoyo, A. T. (2023). Implementation of dijkstra
algorithm in vehicle routing to improve traffic issues
in urban areas. In 2023 3rd International Conference
on Smart Cities, Automation & Intelligent Computing
Systems (ICON-SONICS), pages 73–78.
Wilkinson, L. (2006). Revising the Pareto Chart. The Amer-
ican Statistician, 60(4):332–334.
A Simulation Tool to Assess the Impact of Deviation Plans on Disruptive Events of Urban Traffic
61
