
TIGER: TrIaGing KEy Refreshing Frequency via Digital Sensors
Md Toufiq Hasan Anik
1
, Hasin Ishraq Reefat
1
, Mohammad Ebrahimabadi
1
, Javad Bahrami
1
,
Hossein Pourmehrani
1
, Jean-Luc Danger
2,3
, Sylvain Guilley
3,2
and Naghmeh Karimi
1
1
CSEE Department, University of Maryland Baltimore County, Baltimore, U.S.A.
2
LTCI, T
´
el
´
ecom Paris, Institut Polytechnique de Paris, Palaiseau, France
3
Secure-IC S.A.S., Technology & Strategy Division, Paris, France
Keywords:
Side-Channel Analysis, Attack Detection, Device Rekeying, Leakage Rate Characterization, Digital Sensor
for Information Leakage Estimation, Minimization of the Key Refresh Frequency, TIGER Methodology.
Abstract:
Key refreshing is a pragmatic countermeasure to side-channel attacks, designed to revoke and replace the key
promptly when an attack is either anticipated or suspected. This system-level approach rekeys the device
under attack and keeps paired devices protected if cryptography secures data in transit. The frequency of
key refreshing is critical: too infrequent, and security risks increase; too frequent, and system performance
degrades. This frequency is set pre-silicon via threat analysis but may be inefficient as leakage varies with
operating conditions. To fill the gap, we introduce a post-silicon strategy for optimal rekeying frequency. Our
proposed scheme TIGER deploys a digital sensor to monitor environmental conditions and enabling inference
at runtime by pre-characterizing the leakage rate correlated to the digital sensor measurements. The accumu-
lated leakage rate helps deduce a cutoff time for rekeying. We demonstrate the end-to-end feasibility of this
approach on an FPGA board designed for side-channel threat assessment.
1 INTRODUCTION
The implementation of cryptographic functions like
the popular AES algorithm, is sensitive to key-
recovery physical attacks like Side-Channel Analyses
(SCAs). Those consist in capturing execution traces
in order to correlate them with a sensitive variable,
depending on an AES key byte, which can be pre-
dicted exhaustively (by enumeration of the 256 secret
values) (Mangard et al., 2006, Sec. 6.2). Hopefully,
provable countermeasures, such as random mask-
ing (Mangard et al., 2006, Chap. 9) do exist against
such stealthy attacks. However, masking is costly
and even high-order masking schemes have been de-
feated in low-noise software platforms (Bronchain et
al., 2021). Thereby, masking is not a panacea. This is
particularly binding for the resource constrained In-
ternet of Things (IoT) devices.
Security regulation applicable to IoT still requires
some level of protection against SCAs. For instance,
NIST FIPS 140-3 (NIST, 2019) lists side-channel at-
tacks as a threat, in its annex F. As another example,
even low/substantial level Common Criteria certifi-
cations (such as SESIP (CEN, 2023) at levels 1-3)
require protection against unavoidable side-channel
leakage, formalized as threat “T.Leak-Inherent”.
Adversaries can choose the most favorable envi-
ronmental conditions for exploiting a system, with
factors like temperature, voltage, and clock frequency
significantly impacting the side-channel leakage rate.
The FIPS 140-3 standard mandates compliance with
leakage detection tests across all specified operational
corners. This raises the first question: which corner is
the most vulnerable? Using ISO/IEC 17825 metrics
(namely T-test (Standaert, 2019) or NICV (Shivam
Bhasin et al., 2014), this exploration can be expedited
by using the leakage metric as a figure of merit.
The second question is about the mitigation. As
masking is complex to implement in cost-effective
devices like IoT, a practical approach is lightweight
rekeying, such as fresh rekeying (Medwed et al.,
2010), which involves updating keys before they are
vulnerable to side-channel analysis. Besides, some
IoT devices might not be equipped with a masked
hardware (HW) cryptographic engine, but still those
devices must be protected. As already indicated,
masking a software (SW) implementation is bring-
ing fewer security than when in hardware (owing to
the higher leakage rate of SW relative to HW). Be-
sides, masking in SW considerably slows down the
computation. Rekeying is therefore a natural option:
it allows to improve the security via a protocol rather
than via an implementation change.
372
Anik, M. T. H., Reefat, H. I., Ebrahimabadi, M., Bahrami, J., Pourmehrani, H., Danger, J.-L., Guilley, S., Karimi and N.
TIGER: TrIaGing KEy Refreshing Frequency via Digital Sensors.
DOI: 10.5220/0013515200003979
In Proceedings of the 22nd International Conference on Security and Cryptography (SECRYPT 2025), pages 372-380
ISBN: 978-989-758-760-3; ISSN: 2184-7711
Copyright © 2025 by Paper published under CC license (CC BY-NC-ND 4.0)
It is essential for IoT devices to rekey conserva-
tively: rekeying after each block encryption is theo-
retically sound but impractical due to significant over-
head in key derivation and exchange. On the other
hand, rekeying after an attacker has gathered enough
traces is not useful. Accordingly, this paper addresses
key refreshing frequency such that it is cost-effective
yet meanwhile secure.
1.1 Contributions
We show that a fine-grain Digital Sensor (DS) is able
to sense environmental conditions. Besides, we show
that the measurement sensed by the DS is correlated
to the leakage rate, i.e., the rate at which an attacker
can recover information by analyzing side-channel.
For the first time, we introduce a notion of leak-
age rate, which is calibrated by a learning phase, and
subsequently used as a model for amount of leakage
assessment during only phases (purportedly subject to
attacks). Accordingly, we deduce a leakage rate as-
sessment method to predict at which point in time the
device is getting at risk. Consequently, we devise a
system, nicknamed TIGER, capable of sensing the en-
vironment and triggering a rekeying accordingly. We
show these working principles, both offline training
and online inference, on a real-world FPGA platform.
2 PROBLEM STATEMENT
2.1 SCA Success Dependence on
Environmental Conditions
SCA attacks rely on traces collected from targeted de-
vices when fed with different plaintexts. The leak-
age highly depends on the power consumption which
has both dynamic and static components. The en-
vironment in terms of supply voltage and tempera-
ture directly impacts the power consumption, thus,
transitively, the leakage. The dynamic component is
the predominant part and it is assessed based on the
Eq. (1) where α denotes the activity factor, C
L
shows
the load capacitance, V
dd
refers to the supply voltage,
and f stands for the operating frequency. Indeed, V
dd
affects P
dynamic
quadratically thus making changes in
the supply voltage pivotal in collecting side-channel
leakages through power traces. Hence, the primary
objective of this paper is to evaluate device security
against power SCA under varying operating voltages.
P
dynamic
= α ·C
L
·V
2
dd
· f . (1)
To mitigate the power SCA attacks, mask-
ing and hiding countermeasures have been pro-
posed (Fadaeinia et al., 2021; Anik et al., 2024),
but such protected devices are costly and may leak
when the attacker has access to more traces. Thereby
key refreshing is considered as a critical preventive
scheme against SCA (Medwed et al., 2010). How-
ever, how frequently this key refreshing should be
done is the question we answer in this paper by
proposing a scheme that takes the operating condi-
tions into account to make a balance between security
and the imposed overhead of key refreshing.
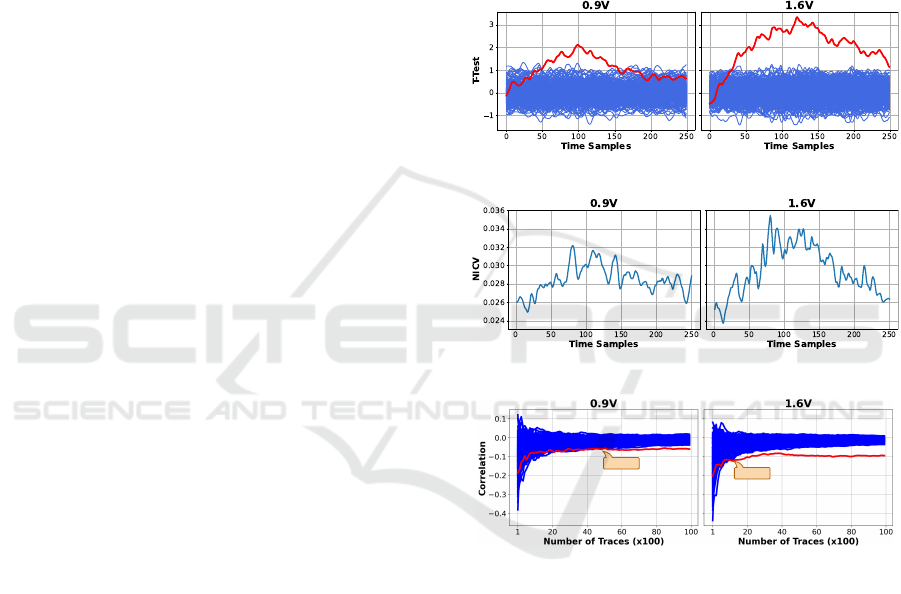
Figure 1: Change of T-test for V
dd
= 0.9 V and 1.6 V.
Figure 2: Change of NICV for V
dd
= 0.9 V and 1.6 V .
4600
1100
Figure 3: Change of minimum no. of traces for successful
CPA attacks for V
dd
= 0.9 V and 1.6 V. The red curve cor-
responds to correctly guessed key (
ˆ
k = k
∗
) whereas the 255
blue ones correspond to incorrect key guesses (
ˆ
k ̸= k
∗
).
To motivate the problem and depict how the vul-
nerability of a circuit against Power SCA changes in
different operating conditions, the reader is invited
to refer to results shown in Fig. 1, 2, and 3. As
mentioned earlier, prescribed ISO/IEC 17825 metrics,
namely T-test (Standaert, 2019) and NICV (Shivam
Bhasin et al., 2014), are common metrics to as-
sess power SCA leakage. Here, along with T-test
and NICV, we also show the minimum number of
traces for a successful CPA (Correlation Power Anal-
ysis (Anik et al., 2024) attack in two considered cor-
ner cases of operating conditions, i.e., the voltage
of 0.9 V (Left) and 1.6 V (Right). In these figures,
TIGER: TrIaGing KEy Refreshing Frequency via Digital Sensors
373

all results are shown for attacking AES (Byte 5) im-
plemented on a SAKURA-G board FPGA for the
core supply voltage equal to 0.9 V (Left) and 1.6 V
(Right). More detail on the implementation / evalua-
tion setup is given in Sec. 6. The T-test, NICV, and
the correlation results shown in Fig. 1, 2, 3 will be
discussed further in this section.
2.2 Leakage Assessment Metrics
The T-test metric T is performed to assess whether
there are significant differences between two datasets.
This test determines whether the means of two distri-
butions (here value of ‘0’ vs ‘1’ in the key bits) are
statistically different, highlighting potential vulnera-
bilities. T-test is calculated using equation (2), where
X
1
and X
2
are the sample means, s
2
1
and s
2
2
are the
sample variances, and n
1
and n
2
are the sample sizes:
T =
X
1
− X
2
r
s
2
1
n
1
+
s
2
2
n
2
. (2)
Figure 1 shows the T-test results applied to the
power traces of the targeted circuit operating in dif-
ferent voltages. Here, the mean of all T-test values
calculated for each bit individually. As depicted lower
V
dd
values result in lower T-test metrics, while higher
V
dd
yields higher T-test metrics; confirming that the
leakage increases in higher voltages.
The NICV metric is to evaluate the variance be-
tween classes in relation to the total variance indicat-
ing the extent to which an attacker can differentiate
the classes. It is calculated via Eq. (3), where
X
c
is
mean of class c, X is overall mean, n
c
is number of
samples in class c, X
i
is i-th sample, C is total number
of classes, and N is total number of samples.
NICV =
∑
C
c=1
n
c
(X
c
− X)
2
∑
N
i=1
(X
i
− X)
2
. (3)
Similar to the T-test results, the NICV data pre-
sented in Fig. 2 show a comparable trend. Lower V
dd
levels correspond to lower NICV values, while higher
V
dd
levels result in higher NICV values, indicating a
potential increase in leakage with rising voltage.
To show the impact of voltage from an offensive
perspective, we conducted CPA attacks at two oper-
ating voltages. The CPA consists in computing the
Pearson correlation coefficient between the traces X
i
and a leakage model M
i,k
(indexed by a key byte hy-
pothesis k ∈ {0,.. .,255}):
CPA
k
=
∑
N
i=1
(X
i
− X) · (M
i,k
− M
k
)
q
∑
N
i=1
(X
i
− X)
2
∑
N
i=1
(M
i,k
− M
k
)
2
. (4)
CPA attack proper consists in guessing the most likely
key
ˆ
k as that which maximizes the coefficient CPA
k
:
ˆ
k = argmax
k
CPA
k
.
Figure 3 depict the maximum correlation values for
each possible key across varying trace numbers. The
red plot represents the correct key k
∗
, while the blue
plots represent other key guesses k ̸= k
∗
. As observed,
similar to the T-test and NICV findings, lower volt-
ages require more traces to leak the key, while higher
voltages require fewer traces, confirming increased
vulnerability to CPA attacks at higher voltages.
Motivated by the above discussion and results, we
use operating voltage as a key metric for achieving
security and determining key refreshing frequency.
2.3 Threat Model
In our threat model, the adversary has physical access
to the targeted cryptographic device and is able to col-
lect power traces to extract keys. The adversary aims
to manipulate the operating voltage V
dd
within per-
missible ranges to facilitate key recovery, i.e., using
fewer traces. For example, as shown in Fig. 3, recov-
ering keys at 0.9 V requires 4600 traces, whereas at
1.6 V, only 1100 traces are needed, indicating signifi-
cantly faster key recovery at the latter case. Note that
to avoid triggering fault detection mechanisms imple-
mented by the designer, the adversary does not change
the operating voltage in a way that induces faults.
3 PREVIOUS WORK
SCA attacks extract cryptographic keys at run time by
observing power consumption, electromagnetic em-
anation, etc. Masking and hiding countermeasures
offer only partial protection and add time or com-
plexity overheads. Fresh re-keying schemes, which
periodically update the key to limit side-channel ex-
posure, have thus gained prominence. Medwed et
al.(Medwed et al., 2010) proposed separating a “re-
keying function” from the main cryptographic func-
tion (e.g., block cipher), but power analysis can still
leak the master key. To address this,(Xi et al., 2018)
uses a PUF, specifically the Subthreshold Current Ar-
ray PUF, for in-operation key updates, though it re-
quires network-wide synchronization.
Lattice-based re-keying was proposed in (Dziem-
bowski et al., 2016), proven secure under high noise,
which may not always hold. This was secured even
in (Duval et al., 2021) against noise-free measure-
ments, albeit with added computational overhead.
SECRYPT 2025 - 22nd International Conference on Security and Cryptography
374
Everspaugh et al.(Everspaugh et al., 2017) pro-
pose an updatable authenticated encryption scheme
with re-encryption indistinguishability to ensure se-
cure key rotation in clouds. Reference (Ueno et al.,
2024) employs a hierarchical scheme with multiple
rekeying components, each acting as a random ora-
cle to securely generate session keys. Key refresh-
ing schemes in (Komano et al., 2019) focus solely
on the algorithm, without addressing “when” to re-
fresh the key to balance leakage prevention and over-
head. In (Gui et al., 2020), uses an offline-calculated
Least Number of Traces (LNT) for successful SCA,
triggering key refreshing after each LNT traces dur-
ing runtime, with keys stored in a TPM. However, it
overlooks the effect of operating conditions on SCA
success, leading to unnecessary overhead.
4 SENSING OPERATING
CONDITIONS
To sense the operating conditions (voltage and fre-
quency) one can benefit from Time-to-Digital Con-
vertors (TDC) which is referred to as Digital Sen-
sor (DS) hereafter. The DS relies on a TDC works
such that if the environmental conditions change, they
will be automatically registered in the flip-flops of the
TDC delay chain. Fig. 4 shows the sensor, consist-
ing of n
1
delay elements, each feeding a D flip-flop.
The first buffer is fed by the system clock, and all flip-
flops operate under the same clock. The sensor design
methodology (number of flip-flops and buffers) is de-
tailed in (Anik et al., 2020a). These flip-flop outputs
characterize the operating condition.
n
1
buffers + Flip flops
clk
Digital
Sensor
Clock
Power Source
D Q
Q
clk
D Q
Q
clk
D Q
Q
clk
D Q
Q
clk
Figure 4: Targeted digital sensor architecture.
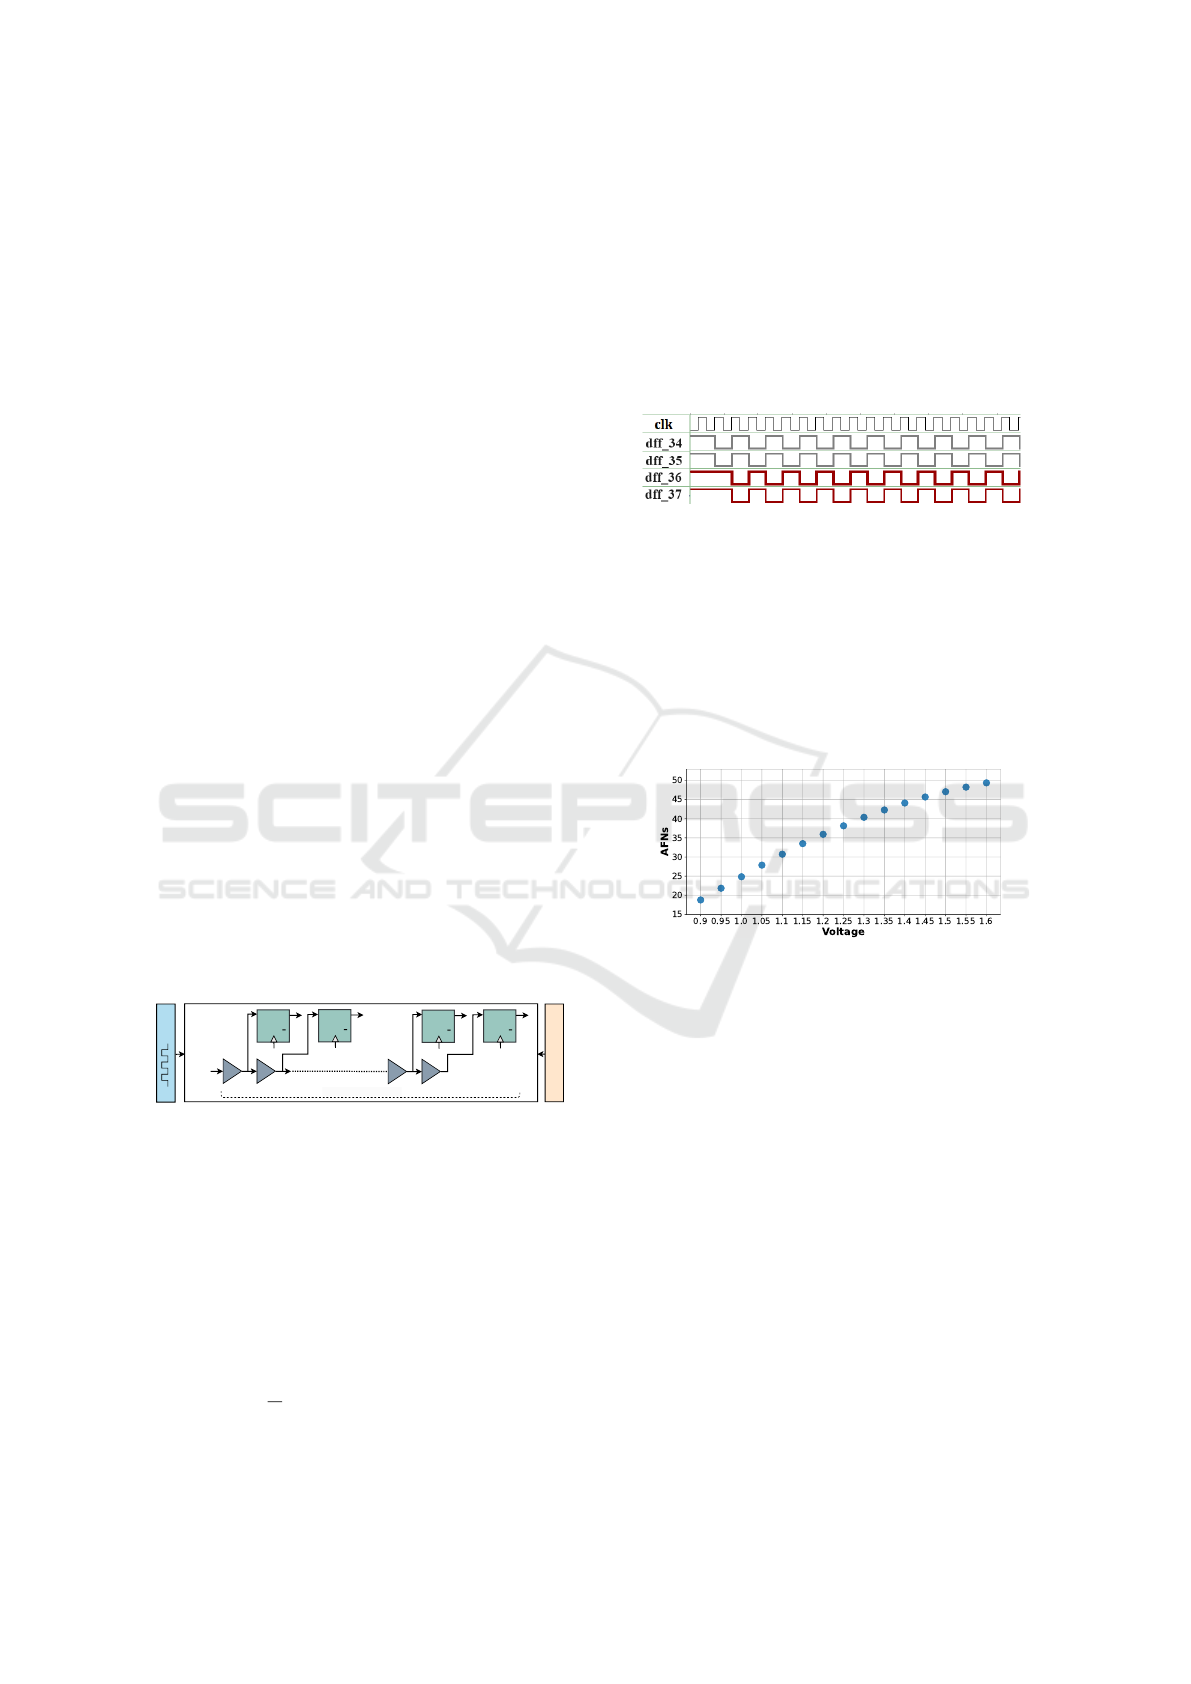
Digital Sensor Characterization. To monitor oper-
ating conditions, we use a metric (similar to (Anik et
al., 2020a)) called the Average Flip-flop Number
(AFN) which is derived based on the outputs of the
DS’ flip-flops. Since the propagation delay of the
buffers in the sensor’s delay chain (shown in Fig. 4)
changes in each operating condition, AFN can fit well
to present the operating condition. In this DS, owing
to the propagation delay along the buffer chain, DFFs
1 to i outputs are in phase A (e.g., 0 → 1 → 0), and
the remaining flip-flops’ outputs are in the comple-
mentary phase A (e.g., 1 → 0 → 1). In each clock cy-
cle CC
j
the index of the first DFF that experiences the
phase change compared to its predecessors is denoted
as FN
j
and the average of FN
j
values over n clock cy-
cles (in this paper n = 10) is used to characterize the
sensor. Note that FN
j
changes with operating condi-
tions. Figure 5 shows the outputs of the flip-flops in
the sensor (Fig. 4) with n
1
= 64 buffers and flip-flops
for V = 1.2 V. Here, AFN = 36, as the first flip-flop
that does not experience a phase change compared to
its previous ones is the 36
th
DFF.
Figure 5: Waveforms of Fig. 4 in V = 1.2 V.
The figure 6 shows how different operating con-
ditions affect AFN. For slower conditions, such as
low voltages, AFN is lower. Conversely, AFN is
higher at high voltages where the circuit operates
faster. Since AFN is related to voltage, it effectively
represents different operating conditions (Anik et al.,
2023). The sensor therefore behaves as an ad hoc
“hardware performance counter”, dedicated to device
self-protection.
Figure 6: AFN in different operating voltages.
5 TIGER METHODOLOGY
The leakage rate and in turn the number of traces
needed to extract secret information, changes with op-
erating conditions (recall Fig. 1, 2, 3). Accordingly,
we take operating conditions into account to decide
key refreshing frequency.
The methodology is studied on a classical AES
implementation with one round being computed in
one clock cycle, thus 16 bytes are computed in par-
allel. Our dynamic key refreshing methodology, so-
called “TIGER” relies on an on-chip sensor whose
outcome presents a view of the operating conditions.
Indeed, TIGER correlates the sensor outcome (AFN
values) to the leakage rate to determine the optimal
frequency for refreshing the key. TIGER consists of
three main processes: Characterization, Sensing, and
Key Refreshing; each is detailed below.
TIGER: TrIaGing KEy Refreshing Frequency via Digital Sensors
375

1. Characterization. The Characterization process
determines the leakage rate under varying operat-
ing conditions to find the number of tolerable opera-
tions (encryption/decryption) without compromising
the key. TIGER achieves this by first generating a set
of N random inputs. These N inputs feed the AES
target circuit one by one and the related power traces
(P
i,c
where 1 ≤ i ≤ N and c denotes the operating con-
dition) are collected for each input at various operat-
ing voltages ∈ [V
min
,V
max
] with the steps of V
step
.
As the next step, CPA attacks are launched on
P
i,c
traces by incrementally increasing the number of
traces by P
step
. We increase the considered traces
for the attack till either the attack is successful or we
reach the maximum number of considered traces (N).
To determine the minimum number of traces for a
successful attack on each byte of the target key in op-
erating condition c, denoted as NbTrace
b,c
, we iden-
tify when a distinguishable correct key-correlation ap-
pears. Since attacks are byte-wise, NbTrace
b,c
is as-
sessed for all bytes b ∈ {0,1, ... ,15} in operating
condition c. We then average these values to find
NbTrace
c
for each operating condition (voltage) of
c. Then NbTrace
c
values will be stored in the sys-
tem memory to be used for dynamic key refreshing as
discussed below.
Note that the calculation of NbTrace
c
from
NbTrace
b,c
for each byte depends on the chosen threat
model. In this study, we employed averaging, which
models an expected number of traces to break the
key. Alternatively, it could be worthwhile to consider
the minimum value, which would (conservatively) ac-
count for the worst-case attack.
2. Sensing. In Characterization phase, it is allowed to
fix the environmental conditions by laboratory means.
However, in practice, it is not often possible (if not at
all) to embed a voltmeter and a temperature sensor
to know the environmental condition c. This is the
justification for the Sensing process.
Sensing involves monitoring the current operating
condition using an on-chip sensor. In practice, we are
to correlate the number of traces needed for attacking
the target device with its operating condition.
To do so we need to characterize the operating
condition first. TIGER leverages the TDCs discussed
in Sec. 4 for this purpose and monitors the operat-
ing conditions via AFN value. The AFN values for
each operating condition is stored in a Lookup Table
(LUT) in the memory along with the NbTrace
c
values
discussed in the characterization after chip fabrication
and before chip deployment. This LUT is obtained
by joining the two tables obtained in Characterization
and Sensing phases. Namely, using database “join”
operator (denoted formally as “ ▷◁ ”) as follows:
c NbTrace
c
V
min
NbTrace
1
V
min
+V
step
NbTrace
2
V
min
+ 2V
step
NbTrace
3
.
.
.
.
.
.
V
max
NbTrace
N
▷◁
c AFN
c
V
min
AFN
1
V
min
+V
step
AFN
2
V
min
+ 2V
step
AFN
3
.
.
.
.
.
.
V
max
AFN
N
=
AFN
c
NbTrace
c
AFN
1
NbTrace
1
AFN
2
NbTrace
2
AFN
3
NbTrace
3
.
.
.
.
.
.
AFN
N
NbTrace
N
≜ LUT . (5)
Then at run time, the sensor extracts the AFN value
dynamically and retries the related number of traces
(NbTrace
c
) from such a LUT to use this information
in the key refreshing step discussed below.
3. Key Refreshing. In the previous stages, we char-
acterize how many traces to reveal the key at a given
AFN. Now, how can we derive a kind of “count down”
of usage of the same key? For a given operating condi-
tion c, we know that after NbTrace
c
measurements the
chip is compromised. Of course, this number is clearly
optimistic, as in practice it is difficult to perfectly syn-
chronize the traces.
In this respect, we introduce the leakage rate metric
which is defined as the following:
• At operating condition c, represented by AFN
and byte b, we characterize the number of traces
NbTrace
b
[AFN] to reveal 100% of the subkey;
• The average number of traces on all the bytes is
NbTrace[AFN];
• The leakage rate is thus defined as
LeakageRate[AFN] ≜ 1/NbTrace[AFN].
The algorithm that governs key refreshing is then
behaving cumulatively in terms of key preemption as
shown in Alg. 1. Whilst the cumulated leakage rate
remains less than 100%, the total leaked information
on the key is insufficient. However, once the cumulated
leakage rate overcomes 100%, it is time to fresh. The
cumulated leakage is subsequently reset.
Notice that some side-channel attacks (bounded by
the number of traces) can be combined with exhaus-
tive key search (bounded by computation complexity).
Such tradeoffs have been explored already (Poussier et
al., 2016) – accordingly, the value 100% can be low-
ered to any value that considers computer search as a
valid takeover in the attack path.
Assume first that the environmental conditions are
steady = c, corresponding to AFN
c
. Then, the re-
fresh condition (Percentage of leakage key ≥ 100%)
occurs for i = NbTrace[AFN
c
]. Indeed, the i-fold accu-
SECRYPT 2025 - 22nd International Conference on Security and Cryptography
376
Algorithm 1: TIGER time-keeper algorithm to trigger a key
refresh.
Initialization (upon boot or after a key refresh):
Percentage of leakage key = 0% ;
for each execution i of AES do
Measure the current AFN = AFN
i
▷ Sense with TDC depicted in
Fig. 4
Increase the Percentage of leakage key :
Percentage of leakage key +=
LeakageRate[AFN] ▷ Use LUT (5)
if Percentage of leakage key ≥ 100%
then
Refresh the key ;
goto Initialization ;
mulation of LeakageRate[AFN
i
] reaches 100% when:
i × LeakageRate[AFN
c
] = 100% = 1 ⇐⇒
i = 1/LeakageRate[AFN
c
] = NbTrace[AFN
c
] .
This is very much expected, as it corresponds to the
Characterization done precisely under same environ-
ment c. Now, when environmental conditions vary dur-
ing the use of AES, the leakage rate will adapt accord-
ingly. For instance, if the environmental conditions be-
come favorable to attacks, then the leakage rate will in-
crease and the refresh condition will occur earlier (i.e.,
for a smaller value of i). This accounts for the “Triage”
capital T in TIGER acronym: the frequency of rekeying
adapts dynamically to the instant leakage rate, which is
the leakage rate coincidental with each and every en-
cryption.
6 EXPERIMENTAL SETUP AND
RESULTS
We utilized SAKURA-G Spartan 6 FPGAs to imple-
ment a 10-round AES-128 circuit as the target for
Power SCA attacks. The SAKURA-G board contains
two FPGAs: one FPGA was designated as the target
for the attacks, while the other was used to control
the I/O via PC UART. The victim circuit operated at
48 MHz, with the AES operating in 10 clock cycles.
Power traces were collected during the last round of the
AES. The operating voltage ranged from V
min
= 0.9 V
to V
max
= 1.6 V in increments of V
step
= 0.05 V , all mea-
sured at room temperature.
A TDC-based sensor was implemented alongside
the AES circuit in the FPGA. This sensor produces
a 64-bit output and is constructed using Carry4 DSP
blocks. The Carry4 blocks are configured as buffers,
with their outputs fed back to their inputs to realize a
buffer chain. The outputs are sampled by D flip-flops
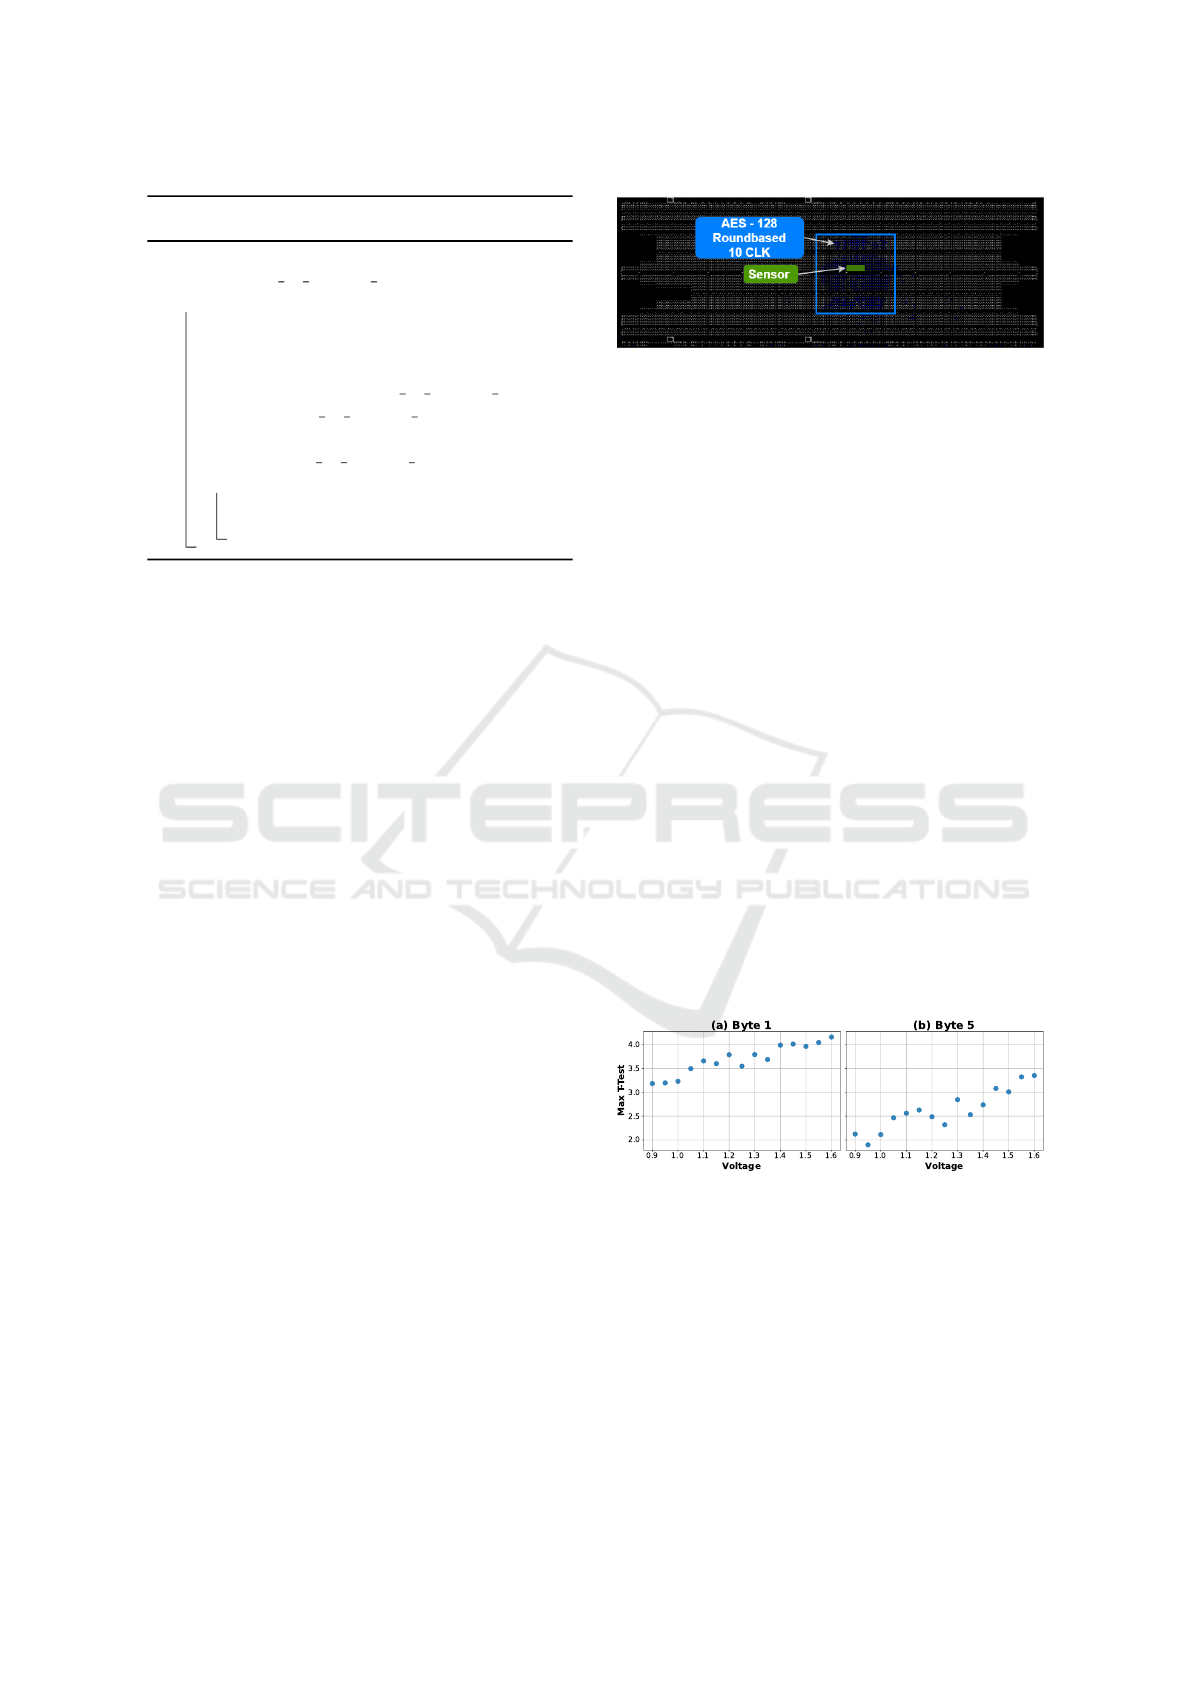
Figure 7: FPGA Layout of the AES along with the TDC.
adjacent to the Carry4 modules. A total of 16 Carry4-
based LUTs were used to implement the sensor circuit.
Sensor data was collected concurrently with the AES
operation, allowing for concomitant leakage Charac-
terization and Sensing processes, required for LUT (5)
construction in TIGER methodology exposed earlier in
Sec. 5.
6.1 Change of Leakage due to
Operating Conditions
The 1st set of results from FPGA platform analyzes the
impact of supply voltage on the leakage rate by using
T-Test, NICV, and Correlation (CPA) techniques.
1) T-test Analysis. The T-test is carried out on the last
round of AES for each byte and each bit. Although the
T-test is conducted on a bit-by-bit basis, for better in-
terpretation, we averaged the T-test values across all 8
bits in each byte. We then found the maximum T-test
value over all sample points (250 points; recall Fig. 1)
for each of the bytes. The results are shown in Fig. 8
for Byte 1 and 5 of AES in different voltages. Although
not strictly linear, a clear trend of rising T-test values at
higher voltages is evident. The key finding of this ex-
periment is that T-test values increase with higher volt-
ages, indicating higher information leakage through the
power side-channel at increased voltage levels.
Figure 8: T-test values in different operating voltages.
2) NICV Analysis. The NICV analysis is carried out
with the same conditions as that used for the T-test. The
figure 9 for two bytes shows the impact of supply volt-
age on NICV even if some outliers coming from en-
vironmental noise can be observed. The takeaway is
that NICV value increases with the voltage indicating
higher information leakage in high voltages.
3) Change of Correlation. These results investigate
the impact of correlation values with power traces as
operating voltage V
dd
changes using Hamming Dis-
TIGER: TrIaGing KEy Refreshing Frequency via Digital Sensors
377

Figure 9: NICV in different operating voltages.
tance power model. Specifically, maximum correlation
values are collected from CPA attacks, incrementally
increasing the number of traces up to N = 10, 000 in
steps of P
step
= 100, for correctly guessed keys. Fig-
ure 10 illustrates for two bytes the correlation’s sensi-
tivity to the V
dd
. Higher correlations are observed at
higher voltages confirming that higher voltages result
in lower noise impact and consequently higher Signal-
to-Noise Ratios (SNRs) and thus more successful at-
tacks.
Figure 10: Correlation variation for correctly guessed keys
in different operating voltages.
The takeaway from the above three observations is
that the experiments corroborate the dependency be-
tween the leakage and the supply voltage. Indeed,
higher voltages facilitate the disclosure of confidential
information like the AES key. This gives an answer to
the first question raised in Introduction (section 1).
6.2 Effect of Voltage on Power SCA
This experiment analyzes the impact of the operat-
ing voltage on power SCAs. Figure 11 displays the
minimum number of traces (NbTrace
b,c
; 0 ≤ b ≤ 15,
c ∈ {0.9 V,1.6 V}) required for each byte of AES
when supplied at voltages 0.9 V and 1.6 V. The re-
sults indicate successful CPA attacks for all bytes al-
beit with varying number of traces. This variability
Figure 11: No of traces byte-wise in different voltages.
underscores that not all bytes exhibit equivalent leak-
Figure 12: No. of traces for a successful attack in different
voltages.
age. For instance, at 0.9 V, Byte 0 necessitates a mini-
mum of NbTrace = 3500 traces for a successful attack,
whereas Byte 2 requires only 2500 traces, indicating
higher leakage for Byte 2 compared to Byte 0.
Similarly, it has been observed that different volt-
ages require varying NbTrace
b,c
for successful key re-
covery. For instance, Byte 0 requires 3500 traces at
0.9 V, which decreases to 1400 traces at 1.6 V. Also,
Byte 2 requires 2500 traces at 0.9 V, decreasing to 1900
traces at 1.6 V. To better quantify leakage rate, average
NbTrace
c
across all bytes is calculated.
Figure 12 shows the average number of traces (over
all 16 key bytes) required to recover the 16 key bytes
in different voltages. The results depict a nearly lin-
ear relationship, i.e., at lower voltages, more traces are
needed for a successful key recovery, whereas higher
voltages require fewer traces. For instance, compared
to 0.9 V, 1.1 V shows an 11.55% decrease in required
traces, decreasing further by up to 40.5% at 1.6 V.
This trend indicates that higher voltages exhibit higher
leakage rates, facilitating faster key recovery. Thereby
there is a need for key refreshing that takes into account
operating conditions. This confirms the criticality of
the TIGER methodology.
6.3 Key Refreshing via Digital Sensors
In this section, we explore the second question stated
in the Introduction (section 1). As depicted in Fig. 6,
the DS uses AFN values to sense operating conditions.
Accordingly, by collecting the number of traces needed
for each voltage from Fig. 12 offline and correlating
them with the AFN values in Fig. 6, we can construct a
lookup table mapping operating conditions to leakage
rates. This data is stored in the chip memory for dy-
namic use in real time to optimize the key refreshing
process.
Figure 13 depicts the number of traces versus AFN.
Although the leakage rate generally trends linearly with
voltage changes, it can be slightly influenced by noise,
which has a greater impact on FPGA than ASIC. The
takeaway is that an on-chip DS can effectively monitor
real-time operating conditions and determine the opti-
mal timing for key refreshing, enabling dynamic key
refreshing without compromising performance or se-
curity.
Figure 14 illustrates the relationship between
SECRYPT 2025 - 22nd International Conference on Security and Cryptography
378

Figure 13: No. of traces in different operating conditions
represented by AFN.
Prevention of
active Attack
(aka FIA, such as
overclocking)
Prevention of
preparative
action for active
attack (e.g.,
setting easy
injection
conditions, such
as downclocking)
Figure 14: Leakage vs. AFN.
LeakageRate and AFN values where the former has
been found using the key refreshing method presented
in Sec. 5. As observed, lower AFN values correspond
to lower LeakageRate, while higher AFN values result
in increased LeakageRate. This indicates that lower
AFN values necessitate less frequent key-refreshing
compared to higher counterparts.
In Fig. 14, a lower AFN, indicated by the red box,
represents overclocking that can cause incorrect func-
tionality in the targeted module. High temperatures,
low voltages, or overclocking can lead to circuit fail-
ure due to timing violations. Digital sensors detect
these failures and trigger necessary actions by moni-
toring a lower bound for AFN within expected oper-
ating range. Similarly, non-functional downclocking
conditions are detected at higher AFN values, shown in
blue box, where circuits lose synchronization and other
modules sample corrupted data. This demonstrates that
side-channel exploitation can only occur within the de-
vice’s operational range.
Note that if the adversary tries to deceive TIGER by
changing the operating conditions (towards slower con-
ditions) while recording power traces before the key re-
freshing process proceeds, he/she cannot benefit from
the additional power traces collected under the new
conditions. This is because these new power traces are
not aligned with the previously recorded ones. Thus,
the attack won’t be successful.
In sum, digital sensors collect operating data to cal-
culate side-channel leakage rates, enabling proactive
key refreshing for optimal security and performance.
They also detect non-functional conditions, thus miti-
gating fault injection attacks and identifying potential
side-channel accelerations.
Figure 15: Effect of process mismatch in the relation be-
tween operating voltage and No. of traces.
6.4 Effect of Process Mismatch
Process mismatch is inevitable in nano-scale designs.
This experiment investigates its impact on TIGER by
collecting the number of traces needed for a success-
ful attack under different operating conditions on two
different FPGAs. Figure 15 shows the results. For ex-
ample, at 0.9 V, FPGA 2 requires 3050 traces, while
FPGA 1 requires 2762 traces. Despite this difference,
both FPGAs show a consistent trend: fewer traces
are needed at higher voltages. Specifically, compar-
ing 0.9 V to 1.3 V, the number of traces decreases by
28.96% for FPGA 1 and 28.10% for FPGA 2. This in-
dicates that TIGER methodology remains valid despite
process mismatch. TIGER’s LUT is constructed offline
for each chip and used dynamically during operation,
so process mismatch is not a factor here.
6.5 Discussion on Temperature Impact
The AFN value of the DS represents the global oper-
ating conditions, i.e. both temperature and voltage. In
this paper, we conducted experiments at constant room
temperature. The impact of temperature in CMOS
technologies is mainly on the static power consumption
as studied and shown in (Kocanda et al., 2015), espe-
cially with recent technologies. The static part is gen-
erally negligible compared to the dynamic one, even if
it becomes more significant with recent technologies.
It turns out that the power consumption, and conse-
quently the leakage, comes mainly from the voltage,
not the temperature. As the FN value of the TDC is
sensitive to both voltage and temperature, it is neces-
sary to apply a correction factor. This can be done by
using a second TDC as presented in (Anik et al., 2020b)
to get the pair (voltage, temperature) and change the
LUT equation 5 to take into account the AFN values of
the two TDCs.
For software implementation, the leakage model is
the Hamming Weight which is sensitive to both dy-
namic and static power. Hence only a single TDC as
shown in this paper may be enough. For hardware im-
plementations, the attack takes advantage of the Ham-
ming Distance model as a leakage source. This rep-
resents only the dynamic power and the temperature
impact should be corrected as proposed above with a
TIGER: TrIaGing KEy Refreshing Frequency via Digital Sensors
379

second TDC and a new LUT equation 5. More exper-
iments are necessary to adjust these proposals on both
software and hardware implementations.
7 CONCLUSIONS AND
PERSPECTIVES
We present in this paper TIGER, a method to optimize
the key-refreshing protection against side-channel at-
tacks. It is particularly of interest for low-cost devices
as it may be less costly than the masking countermea-
sure. As the key refreshing rate has to be as low as
possible to avoid a loss in performance, we propose a
method which gives the optimal frequency according
to the operating conditions. It relies on a digital sen-
sor output, namely AFN which senses the fluctuations
of the environment potentially controlled by attackers.
The AFN value relates to the secret key leakage rate,
hence a tracking algorithm can monitor, encryption af-
ter encryption, when the secret key has been leaked
in its entirety. Accordingly, the algorithm can trigger
a “just-in-time” rekeying to prevent side-channel ex-
ploitation. This method was validated on two FPGAs
by running AES with a large range of supply voltage.
Our planned future works are to refine the relation-
ship between key-related information leakage and AFN
with multiple digital sensors, devices and different tem-
perature values.
ACKNOWLEDGEMENTS
This work was supported in part by the National
Science Foundation CAREER Award (NSF CNS-
1943224).
REFERENCES
Anik et al., M. T. H. (2020a). Detecting Failures and At-
tacks via Digital Sensors. TCAD (IEEE), 40(7).
Anik et al., M. T. H. (2020b). On-chip voltage and temper-
ature digital sensor for security, reliability, and porta-
bility. In ICCD, pages 506–509.
Anik et al., M. T. H. (2023). Aging-Induced Failure Progno-
sis via Digital Sensors. In GLSVLSI, pages 703–708.
Anik et al., M. T. H. (2024). Multi-modal Pre-silicon Eval-
uation of Hardware Masking Styles. JETTA.
Bronchain et al., O. (2021). Breaking Masked Implementa-
tions with Many Shares on 32-bit Software Platforms
or When the Security Order Does Not Matter. TCHES,
pages 202–234.
CEN (2023). CEN EN 17927:2023, Security Evalua-
tion Standard for IoT Platforms (SESIP). An effec-
tive methodology for applying cybersecurity assess-
ment and re-use for connected products.
Duval et al., S. (2021). Exploring crypto-physical dark mat-
ter and learning with physical rounding: Towards se-
cure and efficient fresh re-keying. TCHES.
Dziembowski et al., S. (2016). Towards sound fresh re-
keying with hard (physical) learning problems. In
CRYPTO, pages 272–301.
Everspaugh et al., A. (2017). Key rotation for authenticated
encryption. In CRYPTO, pages 98–129.
Fadaeinia et al., B. (2021). Masked SABL: A long lasting
side-channel protection design methodology. Access,
9:90455–90464.
Gui et al., Y. (2020). Key update countermeasure for
correlation-based side-channel attacks. J. of Hard-
ware & Sys. Security, pages 167–179.
Kocanda et al., P. (2015). Static and dynamic energy losses
vs. temperature in different CMOS technologies. In
MIXDES, pages 446–449.
Komano et al., Y. (2019). Re-keying scheme revisited:
security model and instantiations. Applied Sciences,
9(5):1002.
Mangard et al., S. (2006). Power Analysis Attacks: Reveal-
ing the Secrets of Smart Cards. ISBN 0-387-30857-1.
Medwed et al., M. (2010). Fresh re-keying: security against
side-channel and fault attacks for low-cost devices. In
AFRICACRYPT, pages 279–296.
NIST (2019). Cryptographic Module Valida-
tion Program (CMVP). Updated March
28, 2025. https://csrc.nist.gov/projects/
cryptographic-module-validation-program/
fips-140-3-standards.
Poussier et al., R. (2016). Simple Key Enumeration (and
Rank Estimation) Using Histograms: An Integrated
Approach. In CHES, pages 61–81.
Shivam Bhasin et al., S. (2014). NICV: Normalized Inter-
Class Variance for Detection of Side-Channel Leak-
age. In EMC, pages 310–313.
Standaert, F.-X. (2019). How (not) to use Welch T-test in
side-channel security evaluations. In Smart Card Re-
search and Advanced Applications, pages 65–79.
Ueno et al., R. (2024). Fallen sanctuary: A higher-
order and leakage-resilient rekeying scheme. TCHES,
2024(1):264–308.
Xi et al., X. (2018). Fresh re-keying with strong PUFs:
A new approach to side-channel security. In HOST,
pages 118–125.
SECRYPT 2025 - 22nd International Conference on Security and Cryptography
380
