
Data Breaches: What Happened over the Last 20 Years?
Faheem Ullah
1
, Liwei Wang
2
, Uswa Fatima
3
and Muhammad Imran Taj
1
1
Zayed University, U.A.E.
2
The University of Adelaide, Australia
3
National University of Sciences and Technology, Pakistan
Keywords:
Data Breach, Hacking, Natural Language Processing.
Abstract:
With the rapid development of information technology, commercial software has been inadequate in protecting
personal data resulting in multiple data breaches across industries. However, comprehensive research on data
breaches remains limited. This study investigates their yearly trend, associated costs, impacted industries, types
of compromised data, primary causes, affected regions, and tools used. Using web crawling, we collect reports
from news headlines and extract insights from the data using natural language processing. Our results indicate
a consistent upward trend in the number of data breaches over the years, with an average cost of $2.7 million
per incident. IT industry is the main target of data breaches while emails are the most common type of data
breached. Hacking is the major cause of data breaches with North America being the most targeted region.
SSH, RDP, FTP, Intruder, and Metasploit emerge as the top five tools used to breach data. Our findings show
how things have changed over the past two decades in relation to data breaches and highlight the urgent need
for enhanced security measures to mitigate evolving data losses, particularly in high-risk industries.
1 INTRODUCTION
With the rapid development of information technology,
Internet has become significant across all industries. In
October 2024, around 5.52 billion people around the
world were connected to the internet - 67.5% of world
population (DataReportal, 2025). This has resulted
in an approximately 402.74 million terabytes of data
created each day (Statista, 2025).
However, the protection of data has not kept pace
with this growth. Commercial softwares often fall
short in safeguarding sensitive information, resulting
in severe data breaches across industries. Recent high-
profile incidents, such as the Optus data breach com-
promising 9.8 million records (Optus, 2022) and Med-
ibank’s breach affecting 3.9 million customers (Bar-
baschow, 2022) highlight the impact of these events.
There are multiple data breach annual reports such
as Verizon’s Data Breach Investigation Report
1
and
IBM’s Cost of Data Breach
2
. While they give an-
nual insights, they focus on data from a single year
and large organizations. Data collection methods and
sources in these reports are also proprietary which
1
https://www.verizon.com/business/resources/reports/dbir/
2
https://www.ibm.com/security/data-breach
makes it difficult for researchers and practitioners to
build upon their findings. Current literature offers
limited insight into how the frequency, causes, and
financial consequences of data breaches have evolved
over time. There is lack of a long-term, transparent,
and publicly accessible analysis of data breaches.
The paper aims to address these gaps and provide
cybersecurity practitioners, students and business own-
ers with a coherent insight of the major data breaches
over the last 20 years. Reports of data breaches are
collected from news. We will use news websites to
build our dataset. We built an automated web crawler
to crawl headlines from cyber-security-focused news
websites and used Natural Language Processing (NLP)
to extract data for analysis. Here are the research ques-
tions asked:
•
RQ1: What is the yearly trend for data
breaches? By reviewing data breaches per year
over the last two decades, an upward trend is drawn
which helps predict their future number.
•
RQ2: How much each incident costed? Using
NLP to extract data breach cost from headlines,
we derived a rough average which is approximate
amount of money spent to cover data breach. We
also classified the cost into different levels for dis-
398
Ullah, F., Wang, L., Fatima, U., Taj and M. I.
Data Breaches: What Happened over the Last 20 Years?.
DOI: 10.5220/0013514000003967
In Proceedings of the 14th International Conference on Data Science, Technology and Applications (DATA 2025), pages 398-406
ISBN: 978-989-758-758-0; ISSN: 2184-285X
Copyright © 2025 by Paper published under CC license (CC BY-NC-ND 4.0)

tribution of data breach severity.
•
RQ3: Which industries were affected by data
breaches? By extracting organisation names from
headlines, we infered which types of organisations
were most affected by data breaches. This helps to
identify high-risk sectors and assess the potential
impact on businesses.
•
RQ4: What types of data have been breached?
NLP is good at extracting named entities but not
specified phrases like data types. We manually de-
termined the data types to find out if the headline
content contains the patterns provided to investi-
gate what data types are most targeted by hackers.
•
RQ5: What are the main causes of data
breaches? We classified the different causes into
categories to indicate causes distribution. Identify-
ing the main causes is essential for understanding
the vulnerabilities exploited so that policies can be
developed to reduce the risk of future incidents.
•
RQ6: Which regions were most affected by
the data breaches? NLP model identifies geo-
locations in text. We categorised regional informa-
tion by continent to show the detail distribution by
continents.
•
RQ7: What tools have been used to breach the
data? We gathered popular hacking attacks creates
a dictionary. Next, we used pattern matching to
count the number of times each tool appears in
headline content.
The remaining content is organised as follows. Section
2 explains the background of our work. Section 3
discusses our research methodology. Then, we present
results of the research questions in Section 4. Section 5
and 6 discuss the findings and validity threats. Finally,
we conclude the research in Section 7.
2 BACKGROUND AND RELATED
WORK
A data breach occurs when an unauthorized person
accesses and discloses confidential or sensitive infor-
mation (Cheng et al., 2017; CyberArk, 2022). In cy-
bersecurity, data breach is one of the most common
and costliest incidents (ACSC, 2022).
Web crawler is an automated script to download
and index the web page content. The goal is to un-
derstand the page content and to download the de-
sired website material. (Cloudflare, 2022; Dilmegani,
2022).NLP is a branch of AI which enables computers
to understand text and spoken words like humans. Its
applications include information classification, infor-
mation extraction, inforfmation retrieval, etc. (Chowd-
hary, 2020; IBM, 2022).
2.1 Data Breach Reports
(Thomas et al., 2017) indicate that there are 1.9 bil-
lion username-password pairs exposed through data
breaches and traded on dark web. (Baker et al., 2011)
indicate that the total data breaches in the United
States Secret Service (USSS) are 361 million in 2008,
144 million in 2009 and 4 million in 2010. (Neto
et al., 2021) show that in 2018-2019, over 430 data
breaches were major incident out of 10,000 reports.
(Holtfreter and Harrington, 2015) identify 2,280 ma-
jor data breach incidents and more than 512 million
compromised records in the US. Despite these statis-
tics, a comprehensive analysis of trends, causes, and
industry-specific impacts is needed.
2.2 Causes of Data Breaches
(Baker et al., 2011) indicate that hacking, malware and
misuse are the top 3 causes of data breaches. (Holt-
freter and Harrington, 2015) indicate that internal data
breaches were increasing faster than external ones
from 2005 to 2010. (Sawalha et al., 2024) anlayze
input formating in NLP through varying prompts and
identify that poor prompt engineering could expose
sensitive information during web crawling, contribut-
ing to data breaches. (Kuhail et al., 2024) review 57
studies on polyadic chatbots, concluding that multi-
party conversational agents are widely used to facili-
tate group interactions, but handling simultaneous in-
puts increases the chances of miscommunication and
sensitive data exposure. While these reports cover pri-
mary causes of data breaches, a comprehensive study
is needed on how these factors have evolved over time.
2.3 Cost of Data Breaches
(Khan et al., 2021) indicate that the average cost of ma-
jor data breaches in the USA reached $3.86 billion in
2018 and annual global losses from data breaches will
exceed $2.1 trillion by 2019 (Cheng et al., 2017). (Ro-
manosky et al., 2014) demonstrate that the customer
financial loss exceeded $13.3 billion due to identity
theft in 2010. While these reports cover individual data
breach costs, we will use NLP to estimate an overall
average and categorize costs based on severity levels.
Data Breaches: What Happened over the Last 20 Years?
399

2.4 Solutions for Data Breaches
Target used multiple security measures to ensure Confi-
dentiality, Integrity and Availability (Manworren et al.,
2016). (Khan et al., 2021) present a model for manag-
ing data breaches by orchestrating data breach manage-
ment techniques. (Cheng et al., 2017) present a state-
of-the-art DLPD technique to prevent and detect data
leaks. (Goldberg, 2013) indicate that organisations can
never prevent a data breach and propose an effective
mitigation and response framework. (Labrecque et al.,
2021) analyze customers’ behavior after data breaches
and propose organisational actions to reduce negative
consumer responses. (Phu et al., 2023) propose a deep
learning based approach to defend Software-Defined
Networks against data breaches by detecting and mit-
igating malicious packets in real time. (Abdulsatar
et al., 2024) alsi explore deep learning for cybersecu-
rity risk assessment in microservice architectures.
While these studies examine some aspects of data
breaches, our study aims to provide a comprehensive
analysis of trends, costs, impacted industries, types of
compromised data, primary causes, affected regions,
and tools used.
3 METHODOLOGY
The methodology
3
is shown in Figure 1. The process
starts with selection of data sources. They should
meet the following conditions: be a reputable English-
language news website, have five years or more of
historical headlines and an internal search function.
As we collect data from multiple sources, each
source required a customized crawler due to differ-
ences in website structure, search functionality, and
anti-bot mechanisms. Therefore the data source should
also meet these conditions: it should have a large num-
ber of headlines on data breaches; the internal search
function should return precise, non-fuzzy search re-
sults; the source should not have anti-DDOS protec-
tions or CAPTCHA challenges.
We used search engines to find data sources match-
ing the criteria. Five news sources have been included
in this project containing numerous data breach head-
lines based on Google recommendations: Cyware, In-
fosecurity Magazine, Portswigger, Wired, and ZDNet.
3.1 Data Collection
After data source selection, python crawler scripts
were developed to automate data collection. Web
3
https://github.com/FaheemCrest/Liwei/tree/main/Web
Crawlers
crawling was conducted in two stages: first crawl-
ing all headline URLs from the search engine’s results;
second retrieving the article content from each URL.
Before developing the script, we analyzed the inter-
nal search of each data source by using the browser’s
inspect utility. We analyze the internal search func-
tion operation including the composition of the search
query, format of the returned search results and naviga-
tion mechanisms for traversing multiple result pages.
We classify internal search functions across the
five data sources into two categories. The first returns
a results page containing ten results per query and
we use the Python library BeautifulSoup to extract
URLs for them. Since there are multiple hyperlinks,
we isolate those corresponding to search results by
identifying the div element that contains search results
using the browser’s inspect utility. Once the relevant
element is located, all their href attributes are extracted
to obtain the desired URLs.
The second data source type returns JSON format
results. Such internal search can be configured to
return customized number of results per request - even
3000 without triggering server rejection. For pulling
URLs from JSON responses we use python library
json to parse the data. Once we have the JSON object,
we use .keys() function to locate the key of the search
result URLs.
To collect as many data breach headline URLs
as possible, we compile a list of ”data breach” syn-
onyms to crawl search result URLs such as informa-
tion breach, privacy breach, data loss, and data theft.
Once the URLs are collected, they are merged into a
single file. We filtered out duplicate entries through
the built-in set function in Python.
With a file containing all the headline URLs for cur-
rent data source, we move to page content extraction
including source, URL, author, publish date, title, and
content. While source and URL are already known,
author, publish date, title, and content require finding
the corresponding HTML tag. HTML tags for author,
publish time, title, and content have the same id or
class. Hence, beautiful soap is used to extract the cor-
responding values and store them in dictionary objects.
These dictionary objects are then saved in string format
and exported to a JSON file. To remove the ” and
{}
symbols and achieve comma separated JSON strings,
python’s replace() function is used to replace all the
symbols with commas and have a parsable JSON file.
The final dataset consists of 132,064 unique breach
headlines from five news websites over a 20-year pe-
riod. The dataset is stored in JSON format and con-
verted to a structured DataFrame object for analysis.
As Table 1 shows, ZDNet provided the most headlines
while Portswigger contributed the least.
DATA 2025 - 14th International Conference on Data Science, Technology and Applications
400
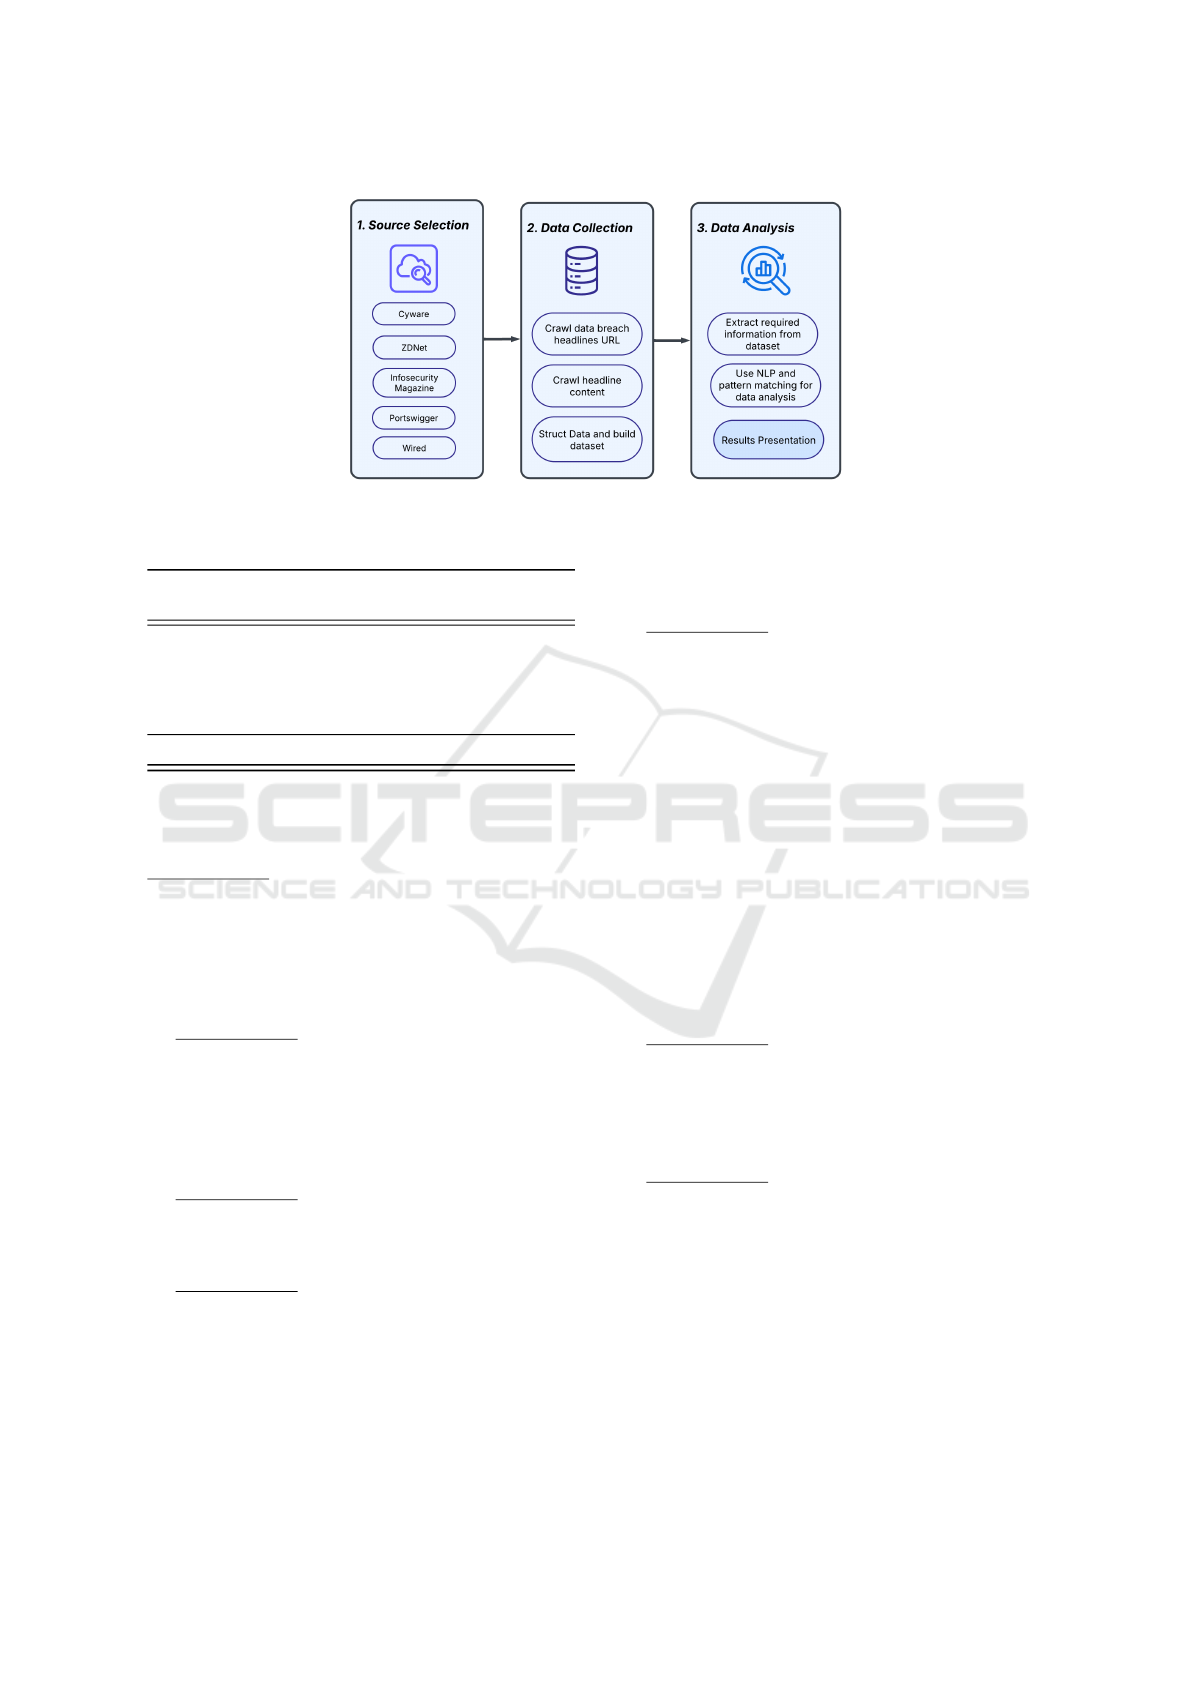
Figure 1: Methodology for studying data breaches.
Table 1: Dataset Distribution.
Source
Number of
Headlines
Percentage %
ZDNet 60,734 45.99
Cyware 37,806 28.63
Infosecurity Magazine 23,415 17.73
Wired 8211 6.22
Portswigger 1898 1.44
Total 132,064 100
3.2 Data Analysis
RQ1 Analysis.
Publishing year of all news headlines
is retrieved from the dataframe object and annual count
is determined using count() function. The results are
stored in a dictionary object, sorted in ascending order.
RQ1 is answered by the annual count of based on the
publish date tag in the data visualized through a bar
chart.
RQ2 Analysis.
To answer RQ2, NLP is used to
extract information from the headline content. We
leverage the spacy library which has a fast statistical
entity recognition system (spaCy, 2022). Dataframe
is passed into spacy to get classified currency phrases
and outliers are filtered out. Finally, we get a costs
lists of data breache incidents.
RQ3 Analysis.
Spacy is used to identify company
name or organization entities in dataframes to answer
RQ3. The value in dataframe [‘content’] is passed into
the model to extract entities classified as ‘ORG’.
RQ4 Analysis.
To investigate RQ4, data types
from the headline content are extracted and frequency
of each type in the headlines is enumerated. Training
an NLP to extract data leak types is time consuming, so
pattern matching was used for simplification. We man-
ually identified the main types of data breached. Next,
these patterns were identified in the headlines and enu-
merated. To eliminate duplicates of data breach type
in a single article, only one count was made. The main
types were identified based on the count.
RQ5 Analysis.
Pattern matching was used to count
the causes to investigate the main causes of data leak-
age. The same cause often contains different attack
surfaces. So, for each main cause category, a pattern
list was created to find patterns in the headline con-
tent. Verizon’s Data Breach Report reveals the four key
causes: hacking, malware, error, and social. Hacking
means the data breach is caused by hackers bypassing
security mechanisms and intentionally accessing infor-
mation without authorization. Malware refers to data
breach caused by malicious software that damages in-
formation assets without consent. Error means the data
breach is caused by misusing untrusted third-party re-
sources or misconfiguring the storage media. Social
data breach is by human errors and social engineering.
By counting frequency of categories in headline con-
tent, we determined which category accounted for the
largest number of causes to answer RQ5.
RQ6 Analysis.
To answer RQ6, spacy is again
used for its named entity recognition. Dataframes
are fed into the model to extract regional information
from data breach reports. The extracted geolocation
entities are categorized by continent for higher-level
distribution analysis.
RQ7 Analysis.
To investigate RQ7, pattern match-
ing is used to summarise hacking tools and count their
occurrences. We collected popular tools according
to popular penetration testing training courses (INE,
2022; Offensive-Security, 2022) namely Nmap for port
scanning, Burp Suite for website analysis, Hashcat for
password cracking, Metasploit for vulnerability ex-
ploitation, Impacket for privilege escalation and Nes-
sus for automation. After counting occurrences of each
tool in the headlines, we analyse the frequency of use.
Data Breaches: What Happened over the Last 20 Years?
401
4 RESULTS
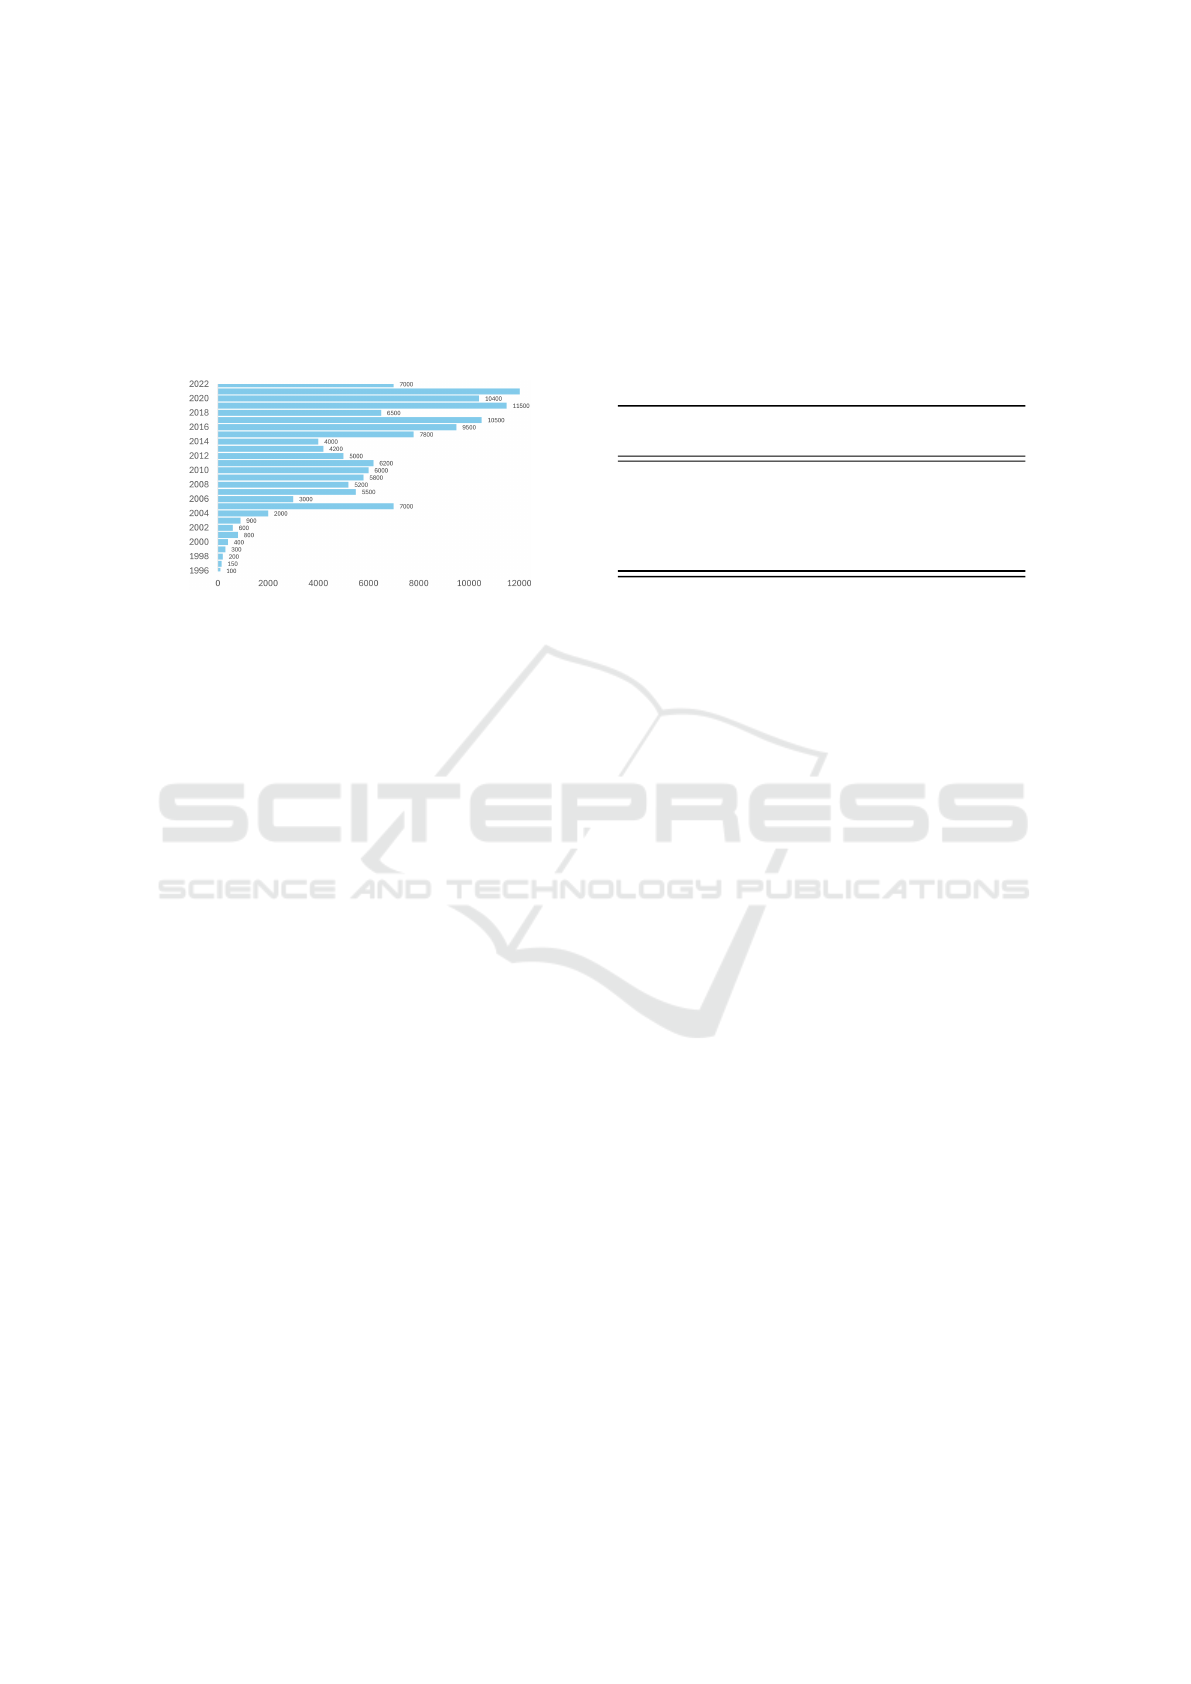
4.1 RQ1: Yearly Data Breach Trend
Figure 2 shows the number of data breaches from 1996
- 2022 from 5 different sources. The total number of
headlines having a year tag is 118,454.
Figure 2: Number of data breaches over the years.
The bar chart illustrates that data breach incidents
are growing exponentially. While only 8 cases were
recorded in 1996, a staggering number of 12,814 data
breaches were recorded in 2021. The number of re-
ported data breaches from 1996 to 2022 can be broadly
divided into three phases.
The first phase is from 1996 to 2006. Here, the
number of data breaches reported yearly was always
in the low triple digits. Since 2007 the yearly count
has never dropped to triple digits. Furthermore, the
number of breaches reported in the start of second
phase (7,207) is twice the number reported in 2006
(3000).
The second phase is from 2007 to 2015. In this
decade, the yearly reported breaches were in the low
four digits. The highest number reported in a single
year was in 2007 (7,207). However, in next phase, the
yearly data breaches (9,353) were 3 times higher than
in 2015 (3,602).
The third phase is from 2016 to 2022. In this phase,
most annual reported data breaches have exceeded
10,000 cases. Especially from 2019, as the result of
COVID-19, data breaches have become more frequent.
Based on current data, 2021 is the peak of yearly data
breaches(12,814 cases). If the current number of 2022
cases doubles by year-end, then 2022 will be the new
peak (6,839 actual, 13,678 cases if doubled).
In summary, data from five sources shows that data
breaches are rising every year. While only 8 cases were
recorded in 1996, twenty-five years later 12,814 data
breaches were recorded in 2021. Due to digitization
and pandemic era, the number of breach incidents is
increasing exponentially.
4.2 RQ2: Cost of Data Breaches
The results show that 70,588 incidents are reported
with a cost. Overall, the average cost of a data breach
over the last 20 years was $2,709,448. Table 2 shows
data breach severity levels, its corresponding cost
range, and the number of incidents.
Table 2: Cost Severity Classification.
Severity
Level
Cost
Range$
Num of
Incidents
Percentage
Low less than 10,000 55,496 78.62
Medium 10,000 - 100,000 5841 8.27
High 100,000 - 1,000,000 7098 10
Very High 1,000,000 - 10,000,000 1017 1.44
Critical More than 10,000,000 1136 1.61
As Table 2 shows, the severity of a data breach
can be classified by its cost. Those costing less than
$10,000 are of Low severity. Those costing between
$10,000 and $100,000 are of Medium severity. Those
requiring between $100,000 and $1,000,000 are High
severity. Those requiring between $1,000,000 and
$10,000,000 are Very High severity. Those spending
more than $10,000,000 are Critical.
Next, we enumerate data breach incidents by sever-
ity levels. The result shows the number of data
breaches at different severity levels. 78.6% of the
total 70,588 incidents were Low in severity, indicat-
ing that the majority of data breaches did not have a
significant impact on an organization’s finances. How-
ever, around 4% of data breaches were Very High and
Critical and had a significant negative impact on the
organization’s finances. It is these 4% of critical data
breaches that result in an average data breach cost of
$2.7 million dollars.
4.3 RQ3: Industries Affected by Data
Breaches
Table 3 shows the top 20 organisations involved in data
breaches from 5 different sources. Based on our data,
the total number of affected organisations is 116,775.
From manually review of the top 20 affected orga-
nizations, 15 of them are in information technology
(IT), 2 in the journalism industry and 3 in the gov-
ernment. The top 4 of the Top 5 are all well-known
technology conglomerates.
Based on current analysis, IT industry is most
prone to data breaches. Because of the nature of this
industry, most of the company products are electronic
and contain large amounts of high-value data. The
complex systems lead to complex and variable attack
DATA 2025 - 14th International Conference on Data Science, Technology and Applications
402
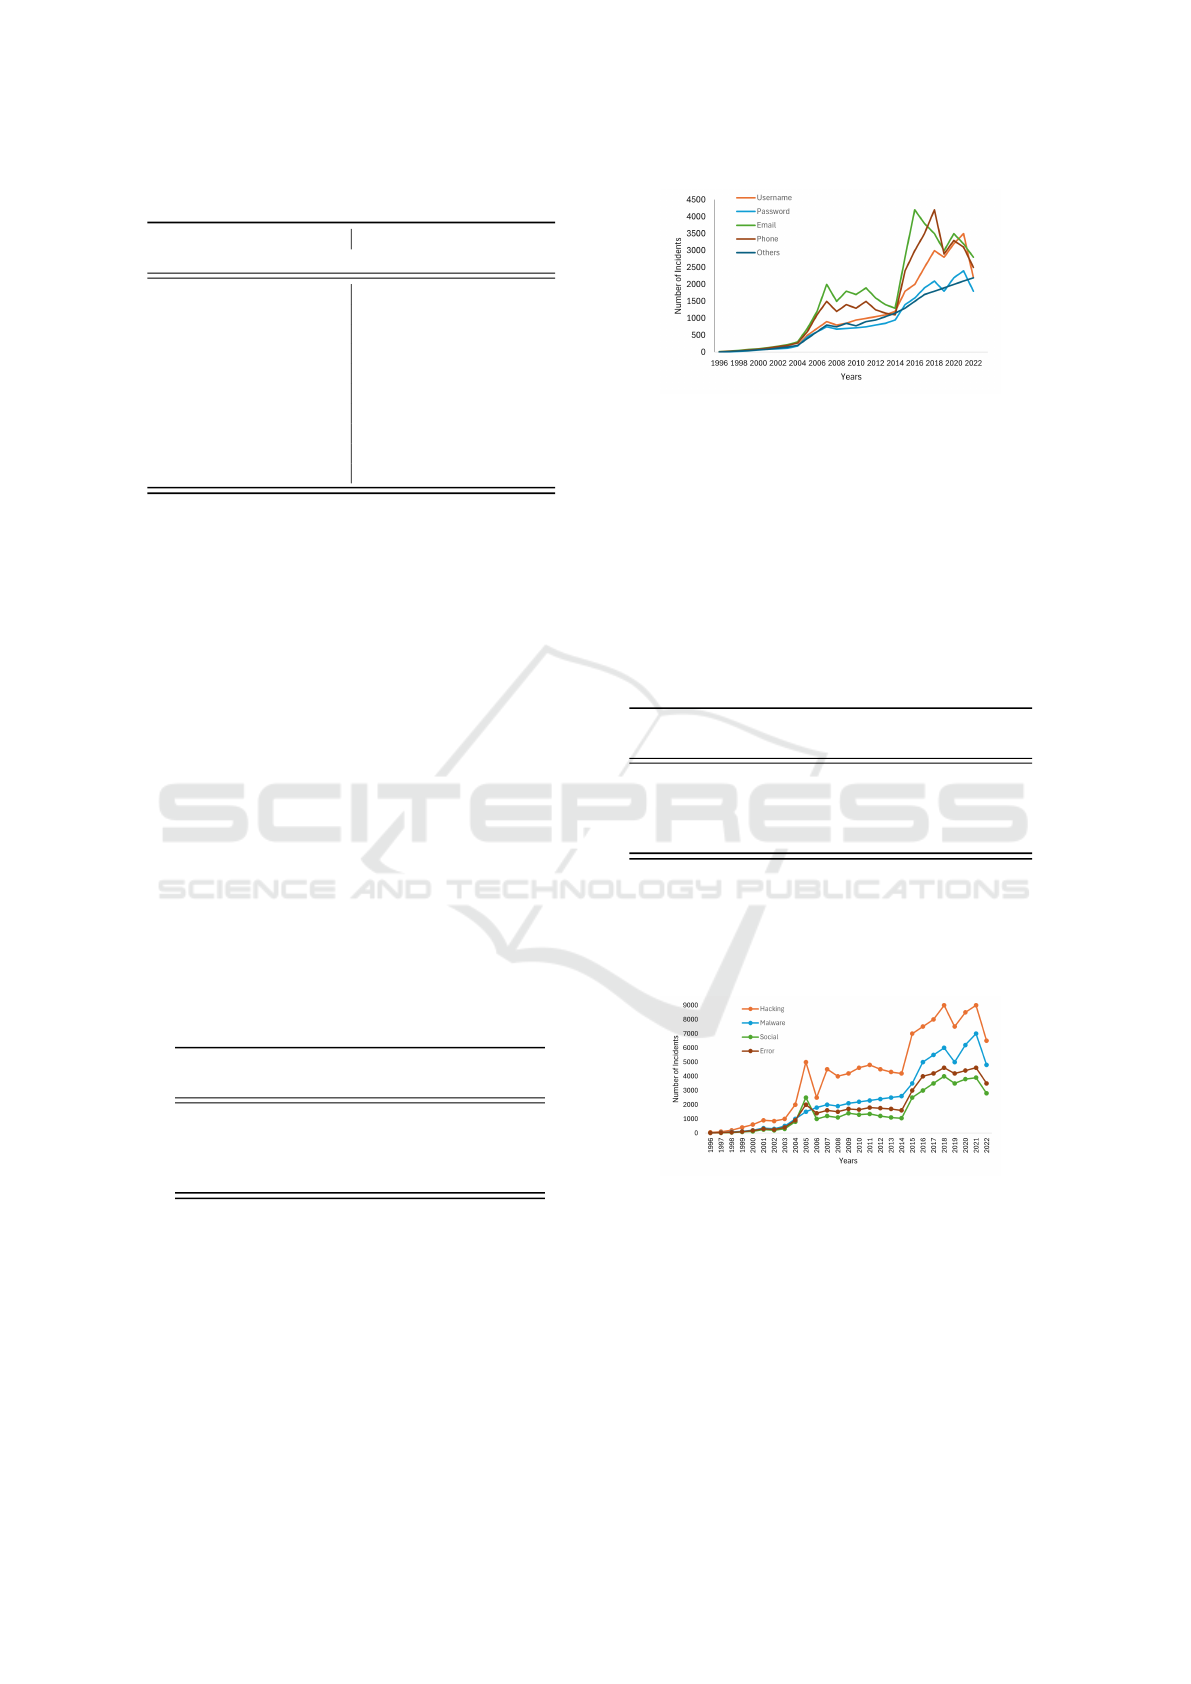
Table 3: Top 20 organisations affected by data breaches.
Organization Name Count Organization Name Count
Microsoft 23,082 Google 17,047
Apple 13,388 Facebook 11,162
FBI 7387 Amazon 7239
X 6042 IBM 5155
Intel 4621 Congress 3995
NSA 3868 TechRepublic 3676
Cisco 3665 Samsung 3616
Symantec 3439 Oracle 3281
Youtube 3010 Verizon 2918
Yahoo 2909 Reuters 2778
vectors making defence and traceability difficult. Be-
cause of this, IT industry is often the target of cyber-
criminals.
Even though IT sector is most prone to data
breaches, other industries are also affected. If the
industry is involved in data storage or electronic prod-
ucts, then there is potential for data breaches. It is also
less expensive for hackers to attack small businesses
that lack the budget and cyber security awareness com-
pared to giant tech companies.
4.4 Types of Data Breached
Table 4 contains manual summary of the top leaked
data types from a wide range of headline content.
These include Email, Phone Number, and Username
data types. It also shows the number of times data
types were exposed in data leakages. Email data was
exposed the most, accounting for 32.5%. Password
data is least exposed because of the encryption meth-
ods, only 13.3%.
Table 4: Breached data types.
Breached
Data Type
Number of
Incidents
Percentage %
Email 34,079 32.5
Phone number 25,823 24.6
Username 24,334 23.2
Password 13,934 13.3
By analysing the number of annual incidents of
each data type in Figure 3, we see that exposure trend
is on the rise. The first peak in number for each type
of data was reached in 2005. From 2016 to the present,
the number of exposures for all data types has in-
creased.
Figure 3: Number of data breaches over the years.
4.5
RQ5: Main Causes of Data Breaches
We divide the causes of data breaches into four cat-
egories namely: hacking, malware, error, and social.
See 3 for more details about the categories.
Table 5 shows the different causes, the number of
data breaches incidents, and the percentage. Hacking
causes the most data, accounting for 46.6% of total.
Social accounts for the least incidents, just 14.7%.
Table 5: Causes of Data Breaches.
Cause
Number of
Incidents
Percentage %
Hacking 70,472 46.6
Malware 35,829 23.7
Social Engineering 22,739 15
Error 22,299 14.7
By analysing the annual trends of the causes in
Figure 4, Hacking has always been the main cause
of breach incidents. Malware has become the second
leading cause of incidents since 2006.
Figure 4: Trend of data breach main causes over the years.
4.6 RQ6: Regions Most Affected by
Data Breaches
Table 6 presents the number of times and percentage
each continent was affected by data breaches. North
America was the most affected with 38.5%. Africa
and South America accounted for the least, with 1.7%
and 1.2% respectively.
By analysing the yearly count each continent was
Data Breaches: What Happened over the Last 20 Years?
403
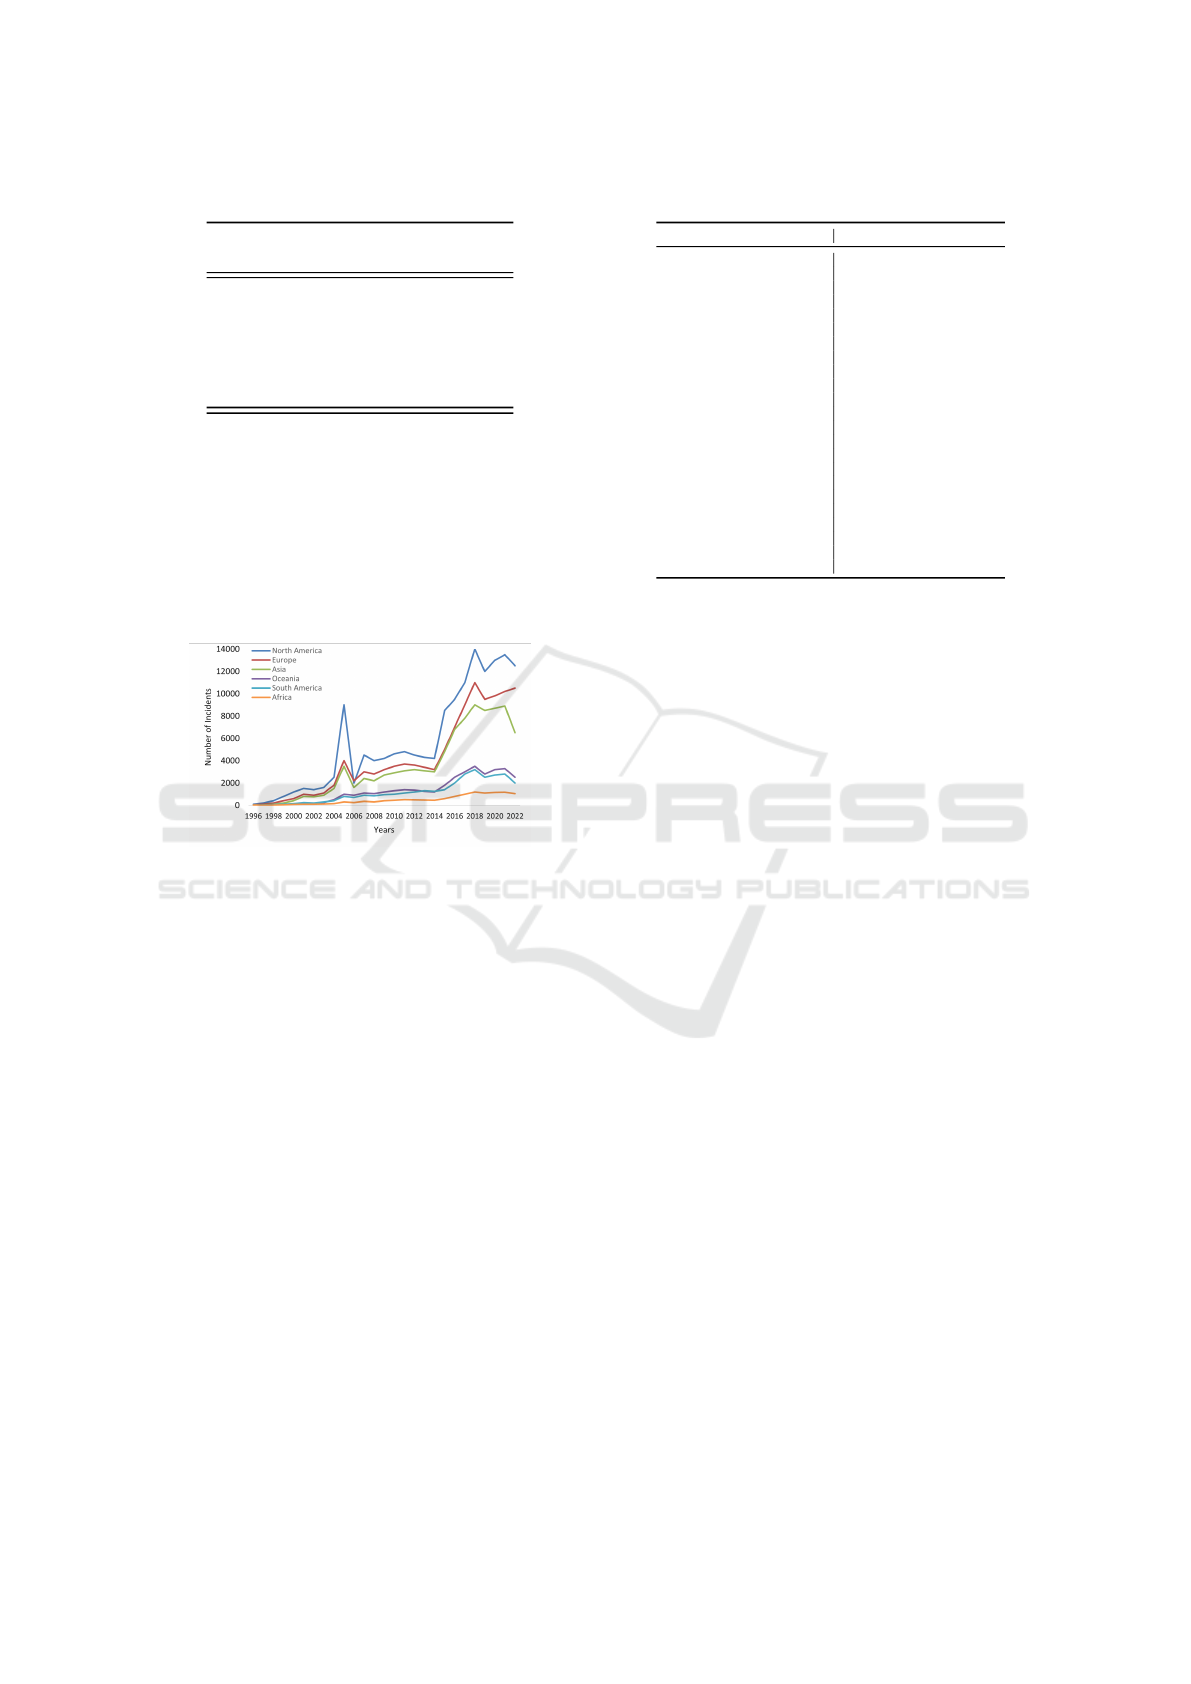
Table 6: Region categories result.
Region
Number of
Incidents
Percentage %
North America 116,959 38.5
Europe 95,662 31.5
Asia 65,046 21.4
Oceania 17,471 5.7
Africa 5320 1.7
South America 3669 1.2
affected by data breaches, in Figure 5, prior to 2015,
the number grew relatively flat except in 2007. But
from 2016 onwards, there was an explosive growth
for all continents. Until 2018, there was only a little
difference between North America and Europe. But
from 2019 onwards, the number of data breaches in
North America increased significantly and steadily
maintained the number one position.
Figure 5: The trend of affected regions over the years.
4.7 RQ7: Tools Used to Breach Data
We created a dictionary of 60 tools from (INE, 2022).
By pattern matching, we found that 46 tools appeared
in the data breach headlines shown in Table 7. The top
three are all tools for remote connection to host ser-
vices. When used successfully, hackers gain a foothold
and start trying to penetrate internal networks and col-
lect private data. In fourth place, Intruder is an auto-
mated vulnerability scanner used to scan unpatched
vulnerabilities in a victim’s hosting service. In fifth,
Metasploit is a penetration testing framework to ex-
ploit code for all the different phases of penetration
testing.
5 DISCUSSION
5.1 Comparison of Our Study with
Previous Literature
Digitilization has led to significant increase in data
breaches affecting organizations and individuals alike.
Table 7: Number of appearances of each tool in incidents.
Tool Name Count Tool Name Count
RDP 4852 SSH 4661
FTP 2267 Intruder 1397
Metasploit 1302 Mysql 466
Wget 397 Hydra 360
Telnet 277 Curl 267
Medusa 262 Burp Suite 230
Mimikatz 167 Nmap 139
GCC 115 Wireshark 83
PsExec 73 Nessus 67
Hashcat 45 SQLMap 29
Netcat 29 Ghidra 25
Maltego 24 GDB 21
John the Ripper 20 Powershell Empire 19
Nikto 18 Acunetix 14
Msfenom 11 Wpsean 8
Impacket 8 Crackmapexec 6
Winexec 5 Ettercap 4
Recon-ng 4 DNSRecon 2
Joomscan 2 JuicyPotato 2
Zennmap 1 DNSEnum 1
Wfuzz 1 Smbident 1
Enum4linux 1 Unshadow 1
Immunity Debugger 1 winPEAS 1
Our findings show upward trend in data breaches over
the past two decades, aligning with previous research.
(Deloitte, 2022) reported a rise in cybercrime after the
COVID-19 pandemic, which heightened data breaches.
We also estimate an average breach cost of $2.7 mil-
lion, which is lower than IBM’s $4.24 million from
its 2021 Cost of a Data Breach Report (IBM, 2021).
However, our findings indicate that most breaches have
relatively minor financial consequences, particularly
for small businesses, supporting (Accenture, 2021)
assertion that 43% of cyberattacks target small busi-
nesses, yet only 14% are prepared to defend against
them. Email is more frequently exposed than other
data relating to the Stanford Research partnered with
Google where more than a billion spams were filtered
by Gmail between April and August of 2020, and
breached emails were 5 times more likely to receive
spam or phishing emails (Dyrand-Systems, 2022).
Malware-based attacks have surpassed other intrusion
methods, ranking as the second-largest cause since
2010. These findings align with (Baker et al., 2011)
and (Holtfreter and Harrington, 2015), who identified
hacking, malware, and internal misuse as the primary
breach causes.
5.2 Relationships and Patterns in
Findings
The results of our study reveal notable relationships
and trends. Although the average cost of a data breach
is $2.7 million, the distribution is highly uneven. A
large number results in minimal to no damage, while
a smaller subset of high-profile ones cause large fi-
nancial losses. Additionally, most attacks target small
businesses, which often lack the resources for effective
cybersecurity. IT is identified as the most vulnerable
DATA 2025 - 14th International Conference on Data Science, Technology and Applications
404

industry. Compared to other industries, it involves
electronic systems, products, and large amounts of
high-value data. The complex systems and products
lead to a complex and variable attack vector and make
defence and traceability difficult. The likelihood of
breach is not confined to specific industries. Any orga-
nization that stores, processes, or transmits high-value
data remains a potential target. Email addresses are the
most commonly exposed data type, followed by phone
numbers. This suggests that contact information is fre-
quently targeted to facilitate phishing attacks, identity
theft, or social engineering attacks. As secondary au-
thentication becomes more common, the exposure of
mobile phone numbers is increasing. North America,
Europe, and Asia are the most affected regions. These
areas are highly digitalized and host a large number
of tech companies, financial institutions, and multina-
tional corporations, making them attractive targets for
cybercriminals. Therefore, strong regulatory frame-
works should be in place for these regions. Among
all attack vectors, hacking is dominant cause, respon-
sible for nearly half of all breaches. Malwares have
also grown significantly, becoming the second-largest
cause since 2010. This suggests a shift towards auto-
mated software-based attack methods, where malware
and exploit kits are used to compromise multiple tar-
gets simultaneously. Remote service connection tools
(e.g., SSH, RDP, and FTP) are the most commonly
used in data breaches. Automated vulnerability scan-
ning and exploitation tools rank second because of a
shift towards automated attack techniques for mass
exploitation.
5.3 Implications for Researchers and
Security Practitioners
The findings have implications for both cybersecurity
researchers and practitioners. Our study analyzes data
breach patterns across industries, causes, costs, and
geographic distributions. Our findings highlight the
rise of malware-based intrusions and automated cyber-
attacks. Future research should focus on developing
early detection models or AI-driven threat intelligence
systems to anticipate new attack patterns. Further re-
search is needed to develop cost-effective cybersecu-
rity solutions to help small organizations protect their
digital assets. For practitioners, our results highlight
the need for enhanced security measures in high-risk
industries such as IT, finance, and healthcare. It is
necessary to strengthen authentication mechanisms as
email and phone numbers remain highly targeted. Or-
ganizations should adopt multi-factor authentication
(MFA) and zero-trust security models to mitigate risks.
Small businesses must recognize that data breaches
are no longer confined to large corporations. IT sector
should implement strong cybersecurity policies like
continuous monitoring, network segmentation, and
employee awareness training.
6 LIMITATIONS OF PROPOSED
SOLUTION
Our data sources were just five English news sites.
While more sources could be included, we limited
the scope to five sources to balance the quality of
data collection within project’s timeframe constraints.
Future work can explore expanding the dataset by
incorporating more sources. Data breach incidents
are collected majorly from English-speaking countries.
Hence, those reported in other regions may be under-
represented in this study. While focusing on English
sources ensured consistency in language processing,
expanding the dataset to non-English sources could im-
prove global representation of the findings. The project
also did not find a reliable method to identify and re-
move duplicate reports of the same incident in the data
cleaning process, which may introduce bias in the data.
Large-scale data breaches in well-known organizations
receive more media coverage and may appear multi-
ple times across different sources. This may result in
an over-representation of high-profile incidents, while
smaller breaches might be under-reported. We miti-
gated this by using headline uniqueness and source
diversity, but these alone may not fully eliminate du-
plicates. Further, NLP was used to extract information
which is not as reliable as manual effort. According to
Scapy’s guidebook, our used model was about 89.8%
accurate in named entity extraction (spaCy, 2022) with
about 10% of the extracted data missing or incorrect.
This project assumes that all values mentioned in the
headline content is the cost of data leakage. How-
ever, the value information mentioned could also re-
late to market value of the company affected by the
data breach. Finally, the pattern matching is based
on search of a given pattern list. Therefore, missing
or incorrect patterns can affect the final classification
results.
7 CONCLUSION
This study is a comprehensive analysis of data breach
trends, their causes, financial impact, affected indus-
tries, and evolving attack methods. We observed an
upward trend in the number of data breaches over the
years. The average cost of a data breach over the last
Data Breaches: What Happened over the Last 20 Years?
405

20 years was $2.7 million but 78% of incidents cost
under $10,000. Although some high-profile breaches
inflate the global average, majority of data breaches
did not have a significant impact on an organisation.
While IT industry is the most affected, there are grow-
ing breach incidents in sectors handling highly sensi-
tive data like healthcare and finance. Email is the most
common type of data breached while hacking is the
major cause of data breaches. North America is the
most affected region. SSH, RDP, FTP, Intruder, and
Metasploit are the top five tools used in cyber attacks.
For future research,we will combine the extracted data
for deeper analysis. For example, studying cost trend
in data breach by regions; applying statistical valida-
tion techniques like chi-square tests and correlation
analysis; cost trend in data breach by the causes. We
can also expand the dataset by incorporating multilin-
gual sources to enhance regional coverage. We plan
to manually investigate data breaches, summarise re-
sponses of affected companies and provide solutions
that can be used by business owners.
REFERENCES
Abdulsatar, M., Ahmad, H., Goel, D., and Ullah, F. (2024).
Towards deep learning enabled cybersecurity risk as-
sessment for microservice architectures. arXiv preprint
arXiv:2403.15169.
Accenture (2021). The state of cybersecurity resilience 2021.
Technical report.
ACSC (2022). Data breaches.
Baker, W., Goudie, M., Hutton, A., Hylender, C. D., Nie-
mantsverdriet, J., Novak, C., Ostertag, D., Porter, C.,
Rosen, M., Sartin, B., Tippett, P., the Men, and of the
United States Secret Service, W. (2011). 2011 data
breach investigations report. Report.
Barbaschow, A. (2022). 3.9 million medibank customers
have had their data breached. Gizmodo Australia. Ac-
cessed: 2025-02-05.
Cheng, L., Liu, F., and Yao, D. (2017). Enterprise data
breach: Causes, challenges, prevention, and future
directions. WIREs Data Mining and Knowledge Dis-
covery, 7(5):e1211.
Chowdhary, K. R. (2020). Natural Language Processing.
Springer India, New Delhi.
Cloudflare (2022). What is a web crawler? — how web
spiders work.
CyberArk (2022). What is a web crawler? — how web
spiders work. https://www.cyberark.com/whatis/data-
breach/.
DataReportal (2025). Global digital overview. Accessed:
2025-02-05.
Deloitte (2022). Impact of covid-19 on cybersecurity.
Dilmegani, C. (2022). What is web crawling? how it works
with examples.
Dyrand-Systems (2022). You get more spam and phishing
emails if your data is breached. Accessed: 2025-02-05.
Goldberg, E. (2013). Preventing a data breach from be-
coming a disaster. Journal of Business Continuity and
Emergency Planning, 6:295–303.
Holtfreter, R. E. and Harrington, A. (2015). Data breach
trends in the united states. Journal of Financial Crime,
22(2):242–260.
IBM (2021). Cost of a data breach report 2021. Technical
report, IBM Security. Accessed: 2025-02-05.
IBM (2022). What is natural language processing?
INE (2022). Penetration testing: System security.
Khan, F., Kim, J. H., Mathiassen, L., and Moore, R. (2021).
Data breach management: An integrated risk model.
Information Management, 58(1):103392.
Kuhail, M. A., Taj, I., Alimamy, S., and Abu Shawar, B.
(2024). A review on polyadic chatbots: trends, chal-
lenges, and future research directions. Knowl. Inf. Syst.,
67(1):109–165.
Labrecque, L. I., Markos, E., Swani, K., and Pe
˜
na, P. (2021).
When data security goes wrong: Examining the impact
of stress, social contract violation, and data type on
consumer coping responses following a data breach.
Journal of Business Research, 135:559–571.
Manworren, N., Letwat, J., and Daily, O. (2016). Why you
should care about the target data breach. Business
Horizons, 59(3):257–266.
Neto, N. N., Madnick, S., Paula, A. M. G. D., and Borges,
N. M. (2021). Developing a global data breach
database and the challenges encountered. Journal of
Data and Information Quality, 13(1):Article 3.
Offensive-Security (2022). Penetration testing with kali
linux.
Optus (2022). Latest updates and support on our cyber
response. Accessed: 2025-02-05.
Phu, A. T., Li, B., Ullah, F., Ul Huque, T., Naha, R., Babar,
M. A., and Nguyen, H. (2023). Defending sdn against
packet injection attacks using deep learning. Computer
Networks, 234:109935.
Romanosky, S., Hoffman, D., and Acquisti, A. (2014). Em-
pirical analysis of data breach litigation. Journal of
Empirical Legal Studies, 11(1):74–104.
Sawalha, G., Taj, I., and and, A. S. (2024). Analyzing stu-
dent prompts and their effect on chatgpt’s performance.
Cogent Education, 11(1):2397200.
spaCy (2022). Named entity recognition. Accessed: 2025-
02-05.
Statista (2025). Global data creation volume. Online. Ac-
cessed: 2025-02-05.
Thomas, K., Li, F., Zand, A., Barrett, J., Ranieri, J., In-
vernizzi, L., Markov, Y., Comanescu, O., Eranti, V.,
Moscicki, A., Margolis, D., Paxson, V., and Bursztein,
E. (2017). Data breaches, Phishing, or Malware? under-
standing the risks of stolen credentials. In Proceedings
of the 2017 ACM Conference on Computer and Com-
munications Security (CCS ’17), pages 1421–1434.
DATA 2025 - 14th International Conference on Data Science, Technology and Applications
406
