
SCART: Simulation of Cyber Attacks for Real-Time
Eliron Rahimi
1 a
, Kfir Girstein
2 b
, Roman Malits
3 c
and Avi Mendelson
3 d
1
Computer Science Department, University of Haifa, Haifa, Israel
2
Department of Electronic Engineering, Technion Institute of Technology, Haifa, Israel
3
Department of Computer Science, Technion Institute of Technology, Haifa, Israel
fi
Keywords:
Real-Time, Cyber-Attack, Time Series Anomaly Detection, Simulation.
Abstract:
Real-Time systems are essential for promptly responding to external stimuli and completing tasks within pre-
defined time constraints. Ensuring high reliability and robust security in these systems is therefore critical.
This requires addressing reliability-related events, such as sensor failures and subsystem malfunctions, as
well as cybersecurity threats. This paper introduces a novel cyber-attack simulation infrastructure designed
to enhance simulation environments for real-time systems. The proposed infrastructure integrates reliability-
oriented events and sophisticated cybersecurity attacks, including those targeting single or multiple sensors.
We present the SCART framework and dataset, addressing a central challenge in real-time systems: the lack
of scalable testing environments to assess the impact of cyber-attacks on critical systems and evaluate the
effectiveness of defensive mechanisms. This limitation arises from the inherent risks of executing attacks or
inducing malfunctions in operational systems. By leveraging simulation-based capabilities, the framework
generates training and testing data for data-driven approaches, such as machine learning, which are otherwise
difficult to train or validate under live conditions. This development enables the exploration of innovative
methodologies to strengthen the resilience of real-time systems against cyber-attacks. The comprehensive
functionalities of the proposed infrastructure improve the accuracy and security of critical systems while fos-
tering the creation of advanced algorithms. These advancements hold the potential to significantly enhance
anomaly detection in real-time systems and fortify their defenses against cyber threats. Our code is available
at https://github.com/kfirgirstein/SCART.
1 INTRODUCTION
Real-time systems typically function as reactive sys-
tems, promptly responding to stimuli and completing
tasks within predefined time limits. The correctness
of these systems depends on both the accuracy of their
outputs and their adherence to specified timing con-
straints (Laplante et al., 2004). As the number of tran-
sistors on a single chip continues to increase exponen-
tially, the complexity of such systems grows accord-
ingly (Schoeberl et al., 2019). Today, most systems
are composed of multiple components, each of which
may be designed and tested by different teams or even
by separate companies (Wouters et al., 2017). As a re-
a
https://orcid.org/0009-0007-4424-2123
b
https://orcid.org/0009-0003-4976-0561
c
https://orcid.org/0000-0001-8989-8125
d
https://orcid.org/0000-0003-4274-6866
∗
This research was supported in part by the zero-trust
project, TII – Technology Innovation Institute, Abu-Dhabi.
sult, modern systems have become sufficiently com-
plex that it is nearly infeasible to exhaustively test and
verify all possible usage models and execution paths.
This introduces vulnerabilities to errors, incomplete
specifications, and cyber-attacks.
Real-time embedded systems are susceptible to a
variety of attacks (Papp et al., 2015), rendering their
security a significant concern. While various strate-
gies have been proposed to mitigate these issues over
time, there remains an urgent need for enhanced tools
to support the development of new protective mea-
sures and to test a system’s robustness against differ-
ent attack vectors.
Simulators, particularly digital twin systems (He
and Bai, 2021), provide an effective means for users
to validate the behavior of proposed schemes and test
new algorithms under diverse conditions and situa-
tions (Sargent, 2010). While some simulators allow
for the analysis of the effects of faults, such as sensor
damage or component malfunctions, they typically
Rahimi, E., Girstein, K., Malits, R., Mendelson and A.
SCART: Simulation of Cyber Attacks for Real-Time.
DOI: 10.5220/0013505200003970
In Proceedings of the 15th International Conference on Simulation and Modeling Methodologies, Technologies and Applications (SIMULTECH 2025), pages 27-38
ISBN: 978-989-758-759-7; ISSN: 2184-2841
Copyright © 2025 by Paper published under CC license (CC BY-NC-ND 4.0)
27

focus on systems operating under normal conditions
rather than simulating failure scenarios or security at-
tacks. These attacks may range from simple, single-
point failures to more intricate, multi-vector threats.
This paper introduces the SCART layer, a novel
abstract solution designed to augment existing real-
time system simulators. SCART augments these sim-
ulators by enabling the detection of faults and cyber-
attacks, allowing both types of threats to be incor-
porated into simulated environments. SCART’s ar-
chitecture seamlessly integrates a wide range of cy-
ber threats into simulations, including simple attacks
like single-sensor failures and more complex security
breaches that affect multiple sensors at the System-
on-Chip (SoC) level or across the entire controller.
To assess SCART’s efficacy, a series of exper-
iments were conducted with various attack scenar-
ios on multiple real-time system simulators, includ-
ing Gazebo, Airsim, and jMAVSim. These exper-
iments involved simulating specific flight paths and
evaluating 2,048 different attack configurations in-
volving sensor manipulations and combinations of
attacks. We evaluated the performance of exist-
ing anomaly detection algorithms using established
benchmark methods (Bl
´
azquez-Garc
´
ıa et al., 2021).
Notably, these algorithms identified approximately
86% of non-anomalous instances and 78% of anoma-
lous instances, underscoring the importance and ef-
fectiveness of this research. The experiments pro-
vided valuable insights into the reliability and util-
ity of SCART as a tool for generating realistic cyber-
attack scenarios.
1.1 Contributions
The key contributions of this paper are as follows:
• Introducing the SCART environment and demon-
strating its efficiency and capabilities.
• Presenting an abstract framework architecture for
integrating a cyber-attack layer into real-time sys-
tem simulations.
• Providing a proof of concept for integrating the
cyber-attack layer into a digital twin simulation
for PX4 drones.
• Developing a multi-sensor time-series dataset for
training algorithms to detect anomalies.
The remainder of this paper is structured as fol-
lows: Section 2 provides the necessary background
for understanding the work, while Section 3 reviews
related research. In Section 4, we present the SCART
architecture and a set of attack scenarios with differ-
ent implementation approaches. Section 5 describes
the dataset generation process using our framework.
We evaluate our work in Section 6, and finally, we
present our conclusions in Section 7.
2 BACKGROUND
2.1 Simulations
Simulation is a vital tool in the design and testing
of control systems. It allows users to evaluate the
performance of various schemes and algorithms un-
der different conditions. Simulators are typically cat-
egorized into two main types: functional simula-
tors, which prioritize efficiency but may sacrifice pre-
cise timing accuracy and performance simulators,
which, although slower, offer cycle-accurate results.
Certain simulators also provide advanced sensor
simulations and support both Software-in-the-Loop
(SITL) and Hardware-in-the-Loop (HITL) simula-
tions. In SITL simulations, the entire system is sim-
ulated using software on a computer, whereas HITL
simulations involve connecting physical hardware to
the computer to mimic the system’s behavior. No-
table examples include Gazebo (Kaur et al., 2021),
jMAVSim (Jing et al., 2022), and Airsim (Shah et al.,
2017), which are widely used for testing robotic and
autonomous flight algorithms. Additionally, Vehicle-
focused simulators such as CarSim and X-Plane are
also commonly used (Kaur et al., 2021).
Simulators based on the PX4 autopilot flight-
control architecture (Meier et al., 2015) are particu-
larly effective for vehicle simulations. The MAVLink
API simulator facilitates communication by trans-
mitting sensor data from the simulation environment
to the PX4 and relaying engine and actuator values
from flight code to the simulated vehicle. This ca-
pability enables real-world-like interactions with the
simulated vehicle, allowing users to control it via
QGroundControl, an offboard API, or even a radio
controller/game board. These simulators also pro-
vide capabilities for uploading waypoints and speci-
fying additional task parameters using Python pack-
ages, enhancing their flexibility for research and de-
velopment.
2.2 Embedded System Threats
Embedded systems face numerous security threats
that can compromise their integrity and potentially
endanger their users. These threats include sensor-
based attacks, which manipulate sensors to falsify
data or block access to legitimate information, such
as GPS spoofing and jamming (Humphreys, 2012).
SIMULTECH 2025 - 15th International Conference on Simulation and Modeling Methodologies, Technologies and Applications
28

(a) Gazebo. (b) jMAVSim. (c) Airsim.
Figure 1: Snapshots from vehicle simulators: Gazebo,
jMAVSim, and Airsim.
Additionally, remote exploitation involves exploit-
ing vulnerabilities to trigger unexpected behavior, as
exemplified by buffer overflows (Lhee and Chapin,
2002). In contrast, direct physical injection refers to
tampering with hardware devices through physical ac-
cess or injecting vulnerabilities manually (Parkinson
et al., 2017). Supply chain attacks also pose a po-
tential risk, where hardware, firmware, software, or
system information may be maliciously compromised
to steal, counterfeit, disrupt, or compromise device
functionality. Notable examples of supply chain at-
tacks include the Stuxnet attack (Nourian and Mad-
nick, 2018), one of the most infamous cyber-warfare
weapons, and the Hardware Trojan Horse (HTH)
(Parkinson et al., 2017), a malevolent modification of
the circuitry of an integrated circuit. These attacks
have severe consequences, including the loss of sen-
sitive information, unauthorized remote access, and
even physical harm, highlighting the critical need to
promptly identify and address these security threats to
ensure the safety and security of embedded systems.
3 RELATED WORK
Creating anomalies in time-series data can be
achieved through either data generation or threat in-
jection methods.
Data generation techniques, such as the
TSAGen tool proposed by Wang et al. (Wang et al.,
2021), generate synthetic time-series data containing
anomalies. While these methods are useful, synthetic
data often fails to accurately represent anomalies
caused by real-world phenomena, particularly those
originating from cyberattacks.Consequently, anomaly
detection algorithms trained solely on synthetic data
may struggle to identify anomalies in real systems
with high reliability.
Threat injection methods, on the other hand, in-
troduce simulated cyber threats to produce anomalies
in time-series data. Techniques like co-simulation and
multi-agent modeling and simulation have been ex-
plored in the literature for this purpose (Pan et al.,
2017). However, these methods often face challenges
in real-time systems, especially those with complex
logic or multiple interconnected sensor elements. Re-
searchers must critically assess the compatibility of
these approaches with real-time systems and con-
sider alternative methods for analyzing and defending
against cyberattacks.
In addition to these approaches, several time-
series anomaly detection benchmarks have been
developed to aid researchers. For example, the Se-
cure Water Treatment (SWaT) dataset (Goh et al.,
2017) includes real and simulated data from a wa-
ter treatment plant, enabling studies on securing wa-
ter treatment systems. Other popular benchmarks in-
clude the SKAB dataset (Katser and Kozitsin, 2020)
and the Numenta Anomaly Benchmark (NAB) (Ah-
mad et al., 2017). While reproducing these bench-
marks may be time-consuming, they offer an oppor-
tunity for researchers to evaluate their anomaly de-
tection algorithms and compare them against existing
ones.
However, it is important to note that these bench-
marks may lack the robustness and scalability needed
for certain research purposes; therefore, researchers
should exercise caution when interpreting and gener-
alizing their findings.
4 METHOD
This chapter introduces SCART’s architecture, begin-
ning with a general description of the process for
creating the layer used in most simulations. Subse-
quently, we present scenarios that guided our objec-
tives during the design phase. These scenarios, based
on the defined threat model, operate under the as-
sumption that most modern computer systems are sus-
ceptible to cyber-attacks.
The primary objective of integrating the SCART
layer into a simulator is to augment the function-
ality of an existing cycle-accurate or Digital Twin
simulator, which closely mimics the target system’s
hardware and communication patterns. The proposed
approach introduces the attack layer as an external
modification to memory locations or communication
channels, by integrating it into individual sub-units,
their communication pathways, or the surrounding
environment. The internal implementation of the
SCART layer employs a discrete event simulation ap-
proach, modeling the system’s behavior as a series
of events that occur at distinct moments and signify
changes in the system’s state(Varga, 2001).
The layered architecture presented in this study
provides a broad scope for investigating a wide range
of threats, employing scenario definition encompass-
SCART: Simulation of Cyber Attacks for Real-Time
29

ing both simple faults and complex, intricate attacks.
Through parametric generation, the framework facil-
itates the production of numerous attacks across vari-
ous threat categories. By partitioning the system into
operational units and leveraging configuration files
and parameters, researchers can precisely define both
nominal and abnormal behaviors. This inherent flex-
ibility empowers researchers to conduct comprehen-
sive simulations that faithfully depict the complex na-
ture of potential threats.
4.1 Architecture Overview
As previously discussed in this chapter, the execution
of the attack consists of a sequence of interconnected
events and conditions. This approach is based on the
SCART code layer, primarily on generating scenar-
ios. It is crucial to highlight that these scenarios form
the basis of our attack. Therefore, precisely defining
each scenario that constitutes the intended attack is
essential. This process requires a clear understanding
of a scenario’s components and identifying its com-
patible parameters. By accomplishing this, we can
proceed to the subsequent step, which involves incor-
porating these scenarios into our layer, running them
in the simulator, and effectively extracting the result-
ing information. Within the SCART system, attacks
are defined by three primary stages, all of which are
pivotal for successful implementation:
1. Defining the attack scenario: This stage involves
formulating a detailed specification for the de-
sired attack scenario. It entails determining the
conditions under which the scenario should occur
and outlining the corresponding actions to be exe-
cuted. It necessitates a meticulous analysis of the
target system and the desired outcome of the at-
tack.
2. Installing the scenario: Once the attack scenario is
defined, it must be integrated into a suitable sim-
ulator environment. This process involves estab-
lishing the connections between the defined con-
ditions, the start and end points, and the speci-
fied actions. In some cases, it also entails defin-
ing the interconnections between multiple scenar-
ios. This integration enables the realistic emula-
tion and execution of the attack scenario under
controlled conditions.
3. Running the scenario: After installing the sce-
nario in the simulator, the subsequent step in-
volves executing the attack scenario and observ-
ing its behavior closely. This process entails run-
ning the updated simulator when SCART is inte-
grated and when the scenarios are installed. This
stage facilitates the collection of valuable infor-
mation regarding the impact, effectiveness, and
potential countermeasures against the attack.
In the upcoming sections, we will delve into the
specifics of each step in our implementation process.
4.1.1 Define Scenario
To aid this exploration, we utilize three comprehen-
sive lists to define and describe each scenario:
• Listeners = [sensor
1
, sensor
2
, . . . , sensor
n
]
This list represents the sensors we actively mon-
itor. Our goal is to detect when a new message
arrives for each sensor. We primarily use the
PUSH methodology, but if unavailable, we resort
to polling. Upon receiving an update for a given
sensor S
i
, we record its new value alongside previ-
ous values for historical tracking. To achieve this,
we instantiate an object:
H istory = {s
1
: [s
11
, . . . , s
1t
], s
2
: [s
21
, . . . , s
2t
], . . . }
This object will record the system’s state and
memory starting at the execution’s commence-
ment.
• C ondition = [c
1
, c
2
, . . . , c
p
]
This list defines the conditions that must be
met before an anomaly can be triggered. After
every update in the History object, we verify if
all specified conditions hold. Since we assume
only one anomaly occurs per run, there is a time
range ∆t where all conditions hold together.
Otherwise, the anomaly should not exist even in
a real case. During this time, we will implement
our exceptions. In other words, we will conclude
the anomaly when any of the conditions are no
longer satisfied. Furthermore, we can emphasize
this aspect in the results whenever it occurs.
• Actions = [a
1
, a
2
, . . . , a
k
]
This list specifies the actions or exceptions ap-
plied when all conditions are met. These actions
introduce an anomaly by modifying system be-
havior. They may involve altering sensor values
in the History object, modifying system memory,
sending messages to sensors, or other operations.
The length of this list is independent of the Lis-
teners and Conditions lists, as exceptions may in-
volve sensors unrelated to the monitored inputs
and conditions.
SIMULTECH 2025 - 15th International Conference on Simulation and Modeling Methodologies, Technologies and Applications
30

Having acquired a comprehensive understanding
of our data structures, it is incumbent upon us to ex-
plain the operational intricacies of the architecture. In
order to elucidate its functionality and versatility in
simulating various attacks, we will present an exam-
ple for that effectively define various scenarios. This
instance illustrate the breadth of scenarios that can be
defined within the architecture, thus demonstrating its
ability to simulate diverse attacks and deviations.
• GPS Spoofing Attack: One exemplification
entails the manipulation of the drone’s position
when it traverses a specific geographic location
x0. Specifically, during this occurrence, the
drone’s position undergoes alteration by introduc-
ing a transient angular α deviation, which persists
for milliseconds t
0
.
Listeners = [sensor
1
= GPS]
StartC ondiction = [c
1
= {GPS ≈ x
0
}]
EndC ondiction = [c
2
= {duration < t
0
}]
Actions = [a
1
= {duration = duration+ 1},a
2
=
{GPS =
duration
t
0
∗ α ∗GPS}]
4.1.2 Install Scenario
Once the scenarios have been defined, the next step is
their installation. Installing a scenario involves col-
lecting all the lists and adapting them to a logical
framework in which they can work together seam-
lessly. We utilize a Callback function that is trig-
gered whenever a sensor updates its value to accom-
plish this. Depending on the specific requirements,
different Callback functions may be used for individ-
ual sensors, or a shared function may be applied to a
group of sensors. The Callback function is the inter-
face that determines how the Condition and Action
lists are utilized based on the information gathered
from the Listeners stored in History.
The Callback function allows us to explore vari-
ous implementation options and accommodate more
complex attacks and scenarios. The following ap-
proach can be adopted as a vanilla example: ”Wait
until all the starting conditions defined in the Start-
ingCondition list are satisfied, and upon their comple-
tion, activate each anomaly specified in the Actions
list. The execution continues until one of the Ending-
Conditions is met, at which point the process halts.”
This installation mechanism, coupled with the
flexibility of the Callback function, enables the archi-
tecture to effectively orchestrate the execution of sce-
narios, allowing for intricate and sophisticated simu-
lations of attacks and deviations.
4.1.3 Running Scenario
The next phase in the implementation of an attack is
running the scenario. In this phase, we adjust the ar-
chitecture of our layer to the system’s simulator. Run-
ning the scenario will vary for each system, which
requires customizing the SCART API to suit the spe-
cific simulator.
Using the SCART API, we can configure how the
system’s sensors are read and create a list of listeners
for our layer. Furthermore, we can control how the
layer updates sensor values after the scenario is acti-
vated.
This phase plays a crucial role in mitigating sup-
ply chain attacks and ensuring persistence after the
initial foothold. For a more comprehensive explo-
ration of embedded system threats, including supply
chain attacks and persistence techniques.
4.2 Attack Scenarios
The threat model used to design SCART presupposes
that the attacker may be external to the system or use
a Hardware Trojan Horse (HTH), meaning that the
attacker has already successfully conducted a classic
stealth attack. These assumptions allow us to simulate
a broader attack surface encompassing diverse attack
vectors.
To support this, SCART implements the attack
layer so that the attacker waits for a specific trigger
before launching the attack. This implementation al-
lows us to support a wide range of attacks, including:
• Attacking the External Control System.
Here, we present an overview of the threats that
arise from the system’s external interfaces, re-
ferred to as controller or management interfaces.
Examples of such interfaces include remote con-
trol, command-and-control positions, and man-
agement positions. These threats can be executed
by injecting malicious code into the controller’s
firmware or software and, in some cases, by de-
veloping alternative communication interfaces for
the control system.
• System Firmware Attacks.
Firmware serves as the core of real-time systems,
making it a primary target for attacks. The at-
tacker receives the telemetry values directly from
the sensors. Our code package will be included as
a component of the real-time system itself to pro-
vide an attack mechanism in such a scenario. This
attack vector may be accomplished by adding the
necessary code to the real-time system firmware
at the point when the system sensors synchronize.
SCART: Simulation of Cyber Attacks for Real-Time
31

• Attacks Through the Internal Communication
Interfaces
As we presented at the beginning of the chapter,
we divide our real-time system into sub-modules
that communicate with each other. This com-
munication is a widespread threat to systems, as
mentioned in many publications (Thing and Wu,
2016),(Papp et al., 2015), (Parkinson et al., 2017).
Hence, the integration of an attack mechanism in
such a situation will be integrating our layer in
the communication interfaces between the sub-
modules. This integration can be achieved by
adding the code to the internal communication
components as a proxy or indirectly injecting re-
lays.
• Attack Through the Environment
A huge part of developing a simulation is adapt-
ing it to the real world. As we all know, real-time
systems receive input from their surroundings in
a non-communicative manner. Accordingly, in
most simulators, it is necessary to simulate the el-
ements of the environment, such as wind, obsta-
cles, sun, and more. Many studies presented the
threat using environmental elements, i.e., Patch
Attacks and Adversarial attacks on visual odome-
try systems (Nemcovsky et al., 2022). Therefore,
we will integrate our layer as part of the simulator
and thus use the simulator and inject the desired
attacks into the simulation environment.
Although SCART’s capabilities extend to all the sce-
narios described, the experiments and evaluations in
this work primarily focus on attacks through commu-
nication interfaces.
5 SIMULATION
METHODOLOGY
This chapter outlines the process of integrating
SCART into simulators, emphasizing its versatil-
ity and applicability. By seamlessly incorporating
SCART into an existing simulation framework, re-
searchers can analyze and execute a wide range of
attack scenarios in a controlled and realistic environ-
ment. Additionally, this chapter explores the applica-
tion of SCART to specific attack scenarios, building
upon the foundation established in previous chapters.
Through this integration, researchers can systemati-
cally evaluate the impact of various attack scenarios
within their chosen simulation environment.
To seamlessly integrate SCART into an existing
simulator, it is crucial to identify the core pathway
that connects the input to the output within the chosen
(a) Before integration. (b) After integration.
Figure 2: How to integrate SCART into an existing simula-
tor. The left image shows the system diagram before inte-
gration, and the right image shows it after integration.
simulation framework. Specifically, this involves lo-
cating the Main function responsible for linking sen-
sor data to system behavior or navigation commands.
To facilitate this connection, a proxy will be devel-
oped to serve as an intermediary between the input
and output components. Once the proxy is estab-
lished, SCART will be integrated with it. SCART will
process the inputs received from the proxy, modify
them according to the installed scenarios, and gener-
ate updated inputs based on these modifications. Con-
sequently, the output from SCART will act as the
attacked input for the simulator, enabling controlled
testing of various attack scenarios.
A helpful analogy to clarify this process is to com-
pare it to a home electrical system. Instead of individ-
ually altering each power consumer, attention is di-
rected to a central junction box or main power panel.
A ”man in the middle” is then introduced between the
panel and the consumers’ boxes, effectively influenc-
ing the activities of the consumers. A visual represen-
tation of this process can be found in Fig.2.
To validate the proposed solution, a drone system
based on PX4 firmware was selected for experimen-
tation. Drones provide an excellent example of real-
time systems due to their precise, parameter-based
control systems. Moreover, the drone system oper-
ates on a real-time cycle clock, where failure to meet
time constraints could compromise the system’s over-
all performance. In simpler terms, the process of
adding the SCART logic to an existing simulation sys-
tem involves the following steps:
1. Identify the Core Pathway. Locate the central
Main function within the chosen simulator that es-
tablishes the connection between the sensor input
and system behavior or navigation commands.
2. Develop a Proxy. Create an intermediary proxy
to bridge the input and output components of the
simulator, enabling the establishment of a connec-
tion with SCART.
3. Link SCART to the Proxy. Establish a linkage
between SCART and the proxy, allowing SCART
to receive inputs from the proxy and modify them
according to the predefined attack scenarios.
SIMULTECH 2025 - 15th International Conference on Simulation and Modeling Methodologies, Technologies and Applications
32

4. Generate ”Updated” Inputs. Within SCART,
generate ”updated” inputs based on the specified
attack scenarios, transforming the modified inputs
from the proxy into attack-oriented inputs for the
simulator.
5.1 Attack via Communication
Interfaces
Most PX4-based systems consist of a flight controller
and a mission computer, which are interconnected.
The flight controller manages the aircraft’s physical
behavior, utilizing sensors and algorithms to control
its movements. The mission computer serves as the
primary interface for the user, enabling them to pro-
gram and direct the drone’s tasks. Typically, the mis-
sion computer is a separate module. These two mod-
ules communicate through the “MAVLink” protocol.
This structure allows us to demonstrate an attacker
positioned within the computer’s communication in-
terface, thus performing a Man-in-the-Middle attack.
To simulate the drone, we chose to use the Gazebo
simulator. Gazebo (Kaur et al., 2021) is an open-
source 3D robotics simulator that supports the sim-
ulation of sensors and operator control. It also allows
the creation of different variables and specific envi-
ronmental conditions. Additionally, Gazebo enables
modifications to the drone’s environment and the ad-
dition of custom objects. To supplement Gazebo, we
leveraged the MAVROS package (Lee et al., 2021)
to establish communication between the PX4 autopi-
lot and the mission computer. MAVROS served as
the MAVLink node for the Robot Operating System
(ROS), providing access to critical flight and state
information from the drone. Using this setup, we
demonstrate a simple attack scenario through the in-
ternal communication interfaces.
After selecting the most relevant simulator, we di-
vided the main logic into separate running modules.
Specifically, we integrated the PX4 hardware with
the simulator and placed them in a distinct module,
which we named ”Simulator.” We then created a new
”mission computer” module that takes the flight con-
troller’s sensor sequence and passes it to the mission
computer. The flight controller receives the desired
mission as a parameter at the task’s start and calcu-
lates the drone’s movement based on the sensor se-
quence. The mission computer is named ”Naviga-
tor.” Consequently, we now have two distinct mod-
ules, ”Simulator” and ”Navigator,” that communicate
using the “MAVLink” protocol.
Next, we added our layer’s logic, our im-
plementation involved building a python-based
demo
1
that intercepts sensor data before it enters the
mission computer’s logic. This demo executes pre-
defined attack scenarios and feeds the processed sen-
sor data to the mission computer. Integration with
MAVROS enabled us to incorporate this functional-
ity with minimal additional effort. We remapped the
sensors so that our layer receives the sensor values
before they reach the mission computer. In this way,
our layer acts as an attacker within the communica-
tion module, performing a Man-in-the-Middle attack
(Cao et al., 2020).
(a) Before the attack. (b) After the attack.
Figure 3: The flight path before and after the attack.
In this phase, the installation of the scenarios and
their execution logic was implemented following the
remapping of the sensors. First, the logic for in-
stalling the vanilla scenario was developed, as previ-
ously described. Subsequently, we created the cor-
responding list of listeners based on the remapped
sensors. In our setup, the listeners receive sensor
values through a ROS object (Quigley et al., 2009)
called ”Subscriber,” to which the sensor name and
callback function are passed and operated using the
PUSH method. The listeners wait until the reception
of a new sensor record triggers the callback function.
In this example, the subscriber’s values are stored in
the history structure, as detailed in Section 4.1. Once
our layer has implemented the installed scenarios, the
new sensor values are sent to the mission computer
using the ”Publisher” object. At this stage, the mis-
sion computer receives an update from the flight con-
troller, executes the navigation algorithm, and sends
an anomaly notice to the flight controller. In Fig. 3,
we present the flight path before and after the attack
as part of the experimental results.
To facilitate a more comprehensive understand-
ing of our experimental setup, we present in Fig.
4 a diagrammatic representation of the communica-
tion channels involved. Specifically, the green arrows
represent the original communication paths, while
the yellow arrows indicate the changes made by our
setup. The gray arrows show the setup’s output,
while the purple arrows signify its input. Finally, the
black arrows represent the communication interface
between the simulator and the Navigator.
1
The link has been omitted to preserve the anonymity
of the submission
SCART: Simulation of Cyber Attacks for Real-Time
33
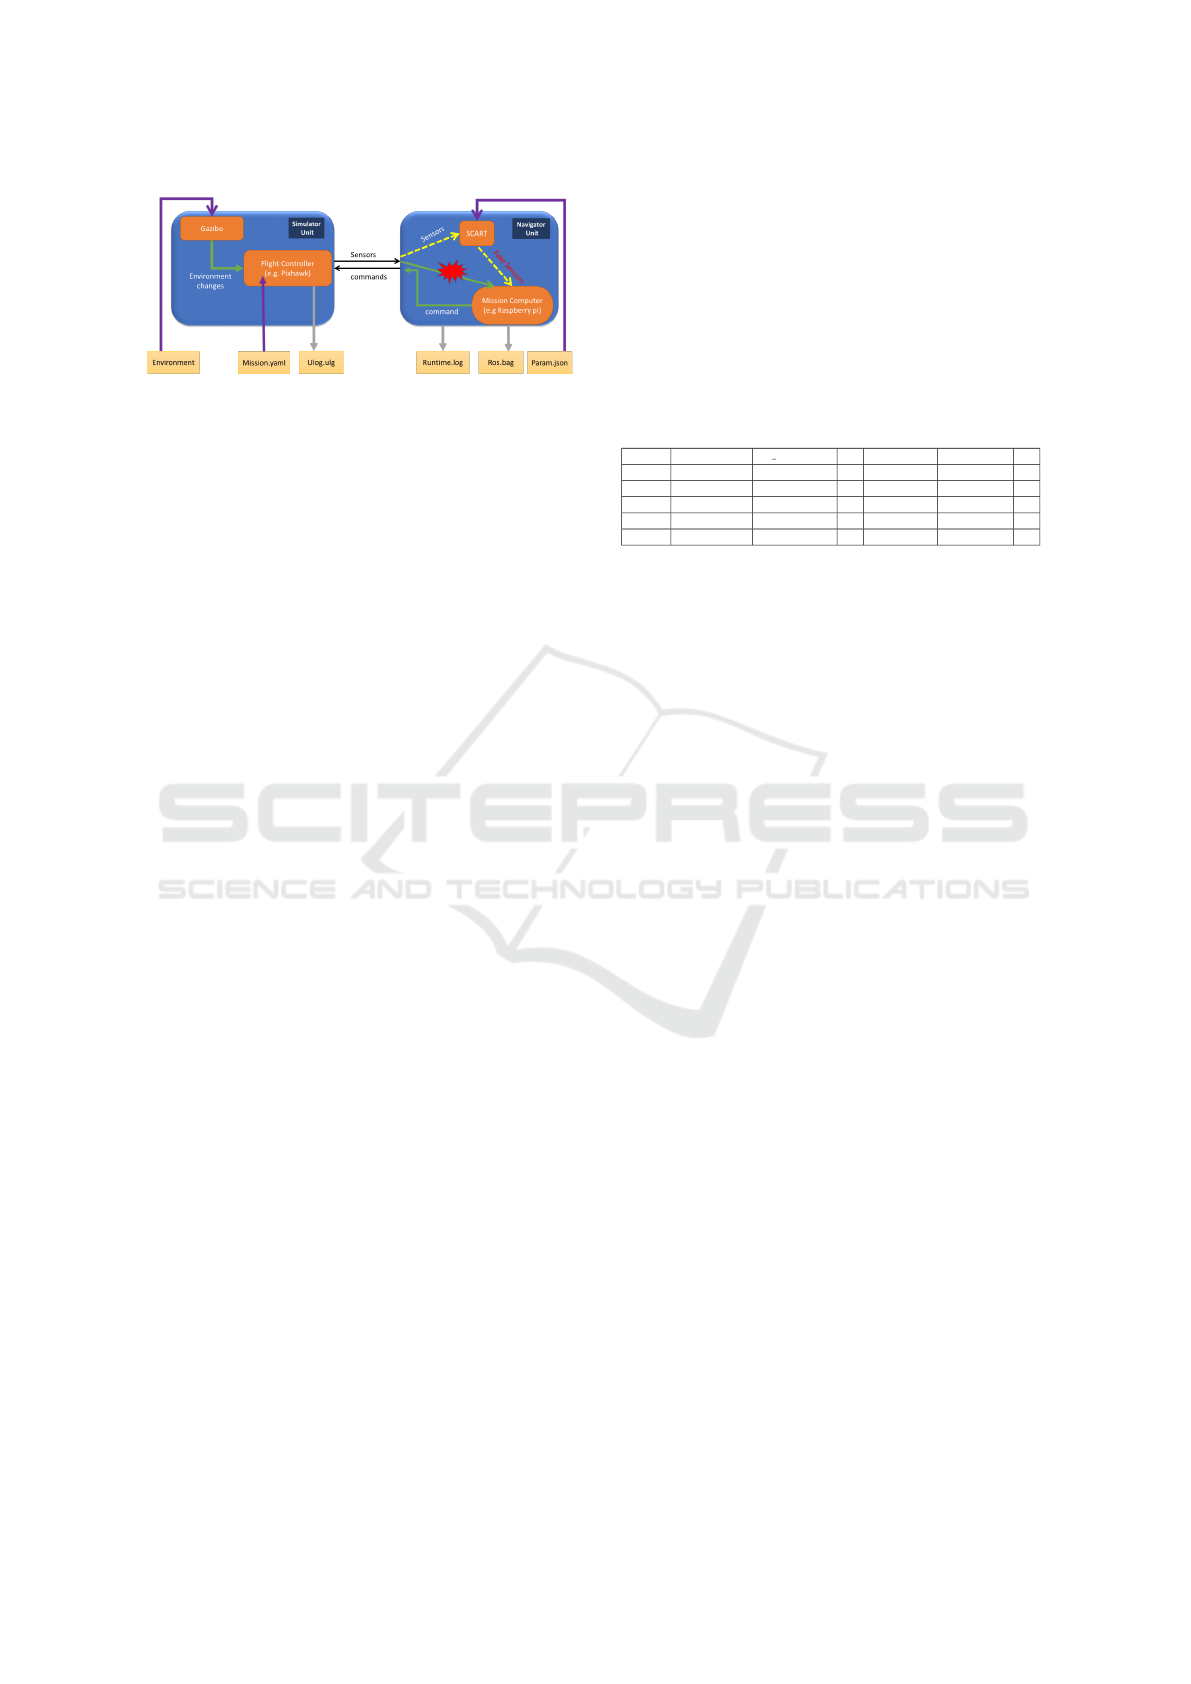
Figure 4: Environment layout for internal communication
interfaces scenario.
5.2 Dataset and Collection
This section explains the dataset creation methodol-
ogy using our SCART system, highlighting its abil-
ity to efficiently and robustly create datasets and
benchmarks. Our method allows exporting all sensor
records from each system iteration. With the help of
our layer, we can export the history object at the end
of each run, generating a comprehensive database,
especially when documentation interfaces for sensor
values are not available.
We demonstrate how to export a dataset from the
simulators, where the data is a product of the simula-
tors, and our added functionality is the creation of cy-
ber attacks or malfunctions proactively and paramet-
rically. Most of the logs are flight recordings from
the Navigator and Simulator, represented by yellow
squares in Fig.4.
To ensure the relevance of the exported data,
we first verified our simulator’s accuracy by run-
ning it in three Gazebo modes: hardware-in-the-loop
(HITL), software-in-the-loop (SITL), and accurate
flight mode. We compared the logs obtained from
each mode and found that the Gazebo simulation ac-
curately represents flight and produces valid environ-
mental values for use.
Dataset creation is essential for both training and
testing, particularly when many machine learning-
based anomaly detection methods are unsupervised,
learning solely from non-anomalous data and tested
on anomalous data, as demonstrated in Section 6. In
this regard, our system provides the first high-quality
testing solution for a wide range of real-time anomaly
detection algorithms.
5.2.1 Dataset Structure
The dataset has been carefully organized into separate
folders to ensure easy access and efficient utilization.
The first folder contains all files collected during the
scenario, including logs and configuration files for the
mission. The second folder holds sensor files gener-
ated through automated tools and various manipula-
tions of the raw data. Additionally, a third folder con-
tains two CSV files: one that combines all the sensor
values into a single table, and another that includes
the most frequently sampled sensor values. Both CSV
files also feature a field to flag anomalies in each en-
try. This methodical organization facilitates efficient
analysis and enables the identification of anomalies.
The complete list of sensors can be found in the fol-
lowing CSV file:
Table 1: Example of our dataset structure.
Index Timestamp Is Anomaly ... Latitude Longitude ...
0 0 0 ... 0 0 ...
... 0 0 ... 0 0 ...
8963 108604000 0 ... 47.397404 8.545335 ...
8964 108616000 1 ... 47.397403 8.545336 ...
... ... ... ... ... ... ...
• The first column is a running index.
• The second column, called ”timestamp,” repre-
sents the time from the start of the run in mi-
croseconds.
• The third column, called ”is-anomaly,” is a
Boolean field indicating whether there is an
anomaly at this timestamp.
• From the fourth column onward are the values of
the measured sensors.
6 EVALUATION
To safeguard real-time systems against vulnerabili-
ties and cyber-attacks, it is crucial to differentiate be-
tween acceptable system behavior and anomalous be-
havior. Previous methods for anomaly detection have
been extensively surveyed by (Chandola et al., 2009).
However, one of the main challenges faced by cur-
rent anomaly detection techniques is defining normal
behavior, given the complexity and variability of real-
time systems, along with the lack of well-defined met-
rics for normality. Despite this, real-time systems pro-
vide additional data that can help address this chal-
lenge. For example, real-time systems are typically
cycle-based, where deterministic execution times are
essential to ensure each computing unit completes
its task within specified time constraints (Ben-Ari,
1990).
During the experimental phase, a controlled en-
vironment was set up to faithfully replicate the oper-
ational setup of the drone, facilitating a wide range
of experiments both indoors and outdoors. These ex-
periments considered various factors, such as weather
changes, geographical variations, and visibility condi-
tions. Environmental models, including physical ob-
jects, were also incorporated, all aimed at simulating
SIMULTECH 2025 - 15th International Conference on Simulation and Modeling Methodologies, Technologies and Applications
34

Figure 5: Example of AddWhiteNoise attack across three scenarios. The left image shows the actual appearance of the Ad-
dWhiteNoise attack, while the middle and right images depict the sensor readings in the Navigator and Simulator, respectively.
realistic flight conditions.
Simultaneously, the laboratory’s simulation envi-
ronment, including Gazebo, was aligned with the ex-
perimental setup to ensure seamless integration be-
tween simulations and real-world scenarios. This
alignment provided a comprehensive evaluation of the
SCART solution. These experimental flights, along
with software and hardware-in-the-loop tests, were
pivotal in assessing SCART’s robustness and effec-
tiveness under diverse real-world conditions.
Integrating real-time data from drones into the
simulation system provided valuable insights into
SCART’s applicability and reliability, demonstrating
its potential to enhance security and improve the per-
formance of real-time systems.
In the next stage of our research, we evaluate the
SCART method by examining the architecture devel-
oped, incorporating SCART as described in Section
5.2. The model’s effectiveness is assessed by compar-
ing sensor readings against a control run with no ex-
ceptions, primarily focusing on common attacks such
as GPS spoofing (Tippenhauer et al., 2011).
In the remainder of this chapter, we employ differ-
ent anomaly detection algorithms. Through the eval-
uations performed, we demonstrate that SCART can
enhance the performance of detection algorithms, es-
pecially when generating anomalous data or attacking
critical systems proves challenging.
6.1 Experiments
We conducted comprehensive experiments on the sys-
tem within an attack scenario, as detailed in Section
5.1. These experiments were carried out in a simula-
tion environment designed to meet the project’s spe-
cific requirements, comprising two operational units.
The first unit, referred to as the ”Simulator,” was de-
veloped by integrating the Gazebo simulator with cus-
tom modifications and adjustments, specifically de-
signed to meet the project’s needs. This unit included
various internally developed modules to enable flight
simulations in a virtual environment while running
the drone’s firmware. The second unit, referred to as
the ”Navigator,” emulated the algorithmic aspect of
the system by processing sensor data from the Sim-
ulator and executing the necessary computations to
generate corresponding commands. Both units, the
Simulator and Navigator, functioned in tandem, re-
maining synchronized during both simulated and real-
world flight scenarios.
The primary aim of our experiments was to eval-
uate the performance of existing algorithms in iden-
tifying specific anomalies. To achieve this, we cre-
ated a simulator unit tasked with executing a prede-
termined mission, spanning from takeoff to landing,
and involving a series of sequential tasks. For com-
parison, we performed 100 simulations of the system
with no attacks, following a predefined 30x30 square
flight path.
The primary aim of our experiments was to eval-
uate the performance of existing algorithms in iden-
tifying specific anomalies. To achieve this, we cre-
ated a simulator unit tasked with executing a prede-
termined mission, spanning from takeoff to landing
and involving a series of sequential tasks. For com-
parison, we performed 100 simulations of the system
with no attacks, following a predefined 30x30 square
flight path.
Throughout the experiments, we applied various
sensor manipulation techniques, resulting in a total
of 2048 potential attack scenarios. Subsequently, we
evaluated the effectiveness of various anomaly detec-
tion methods in identifying these attacks and recorded
the results in tables. Our data is structured in columns,
with each column representing time-series data from
a specific sensor. The criteria used to determine
whether an anomaly detection method successfully
identified an attack will be elaborated upon in sub-
sequent sections.
As depicted in Figure 5, we present the out-
comes of the experiments for each attack type. The
left image shows the actual appearance of the Ad-
dWhiteNoise attack, while the middle and right im-
ages depict the sensor readings in the Navigator and
Simulator, respectively. Notably, the red markings in-
dicate the time at which the attack was initiated, pro-
viding a clear visual representation of its impact.
Figures 6 and 7 illustrate examples of changes in
SCART: Simulation of Cyber Attacks for Real-Time
35
Figure 6: Changes in the behavior of position-related sensors caused by GPS spoofing with random modifications, generated
by SCART.
Figure 7: Changes in the behavior of position-related sensors caused by GPS spoofing with duplicate attack patterns, generated
by SCART.
the behavior of sensors related to position caused by
GPS spoofing generated by SCART, demonstrating
the effects of random changes and duplicate attacks,
respectively.
6.2 Anomaly Detection Results
In this section, we assess the performance of our API
in detecting anomalies in time series data. Anoma-
lies refer to patterns that deviate from normal behav-
ior, and detecting such deviations is crucial in many
domains, particularly in cybersecurity. We generated
three types of datasets for evaluation: normal flights,
flights attacked in simulation mode, and flights at-
tacked in CSV mode. The performance of the API
was evaluated by calculating true positives (TP) and
true negatives (TN). A TP represents a case where the
algorithm correctly detects an anomaly in an attacked
flight. A TN represents a case where the algorithm
correctly identifies that no anomaly exists in a normal
flight.
We compared our approach against several exist-
ing anomaly detection techniques. First, we evaluated
the “Telemanom” algorithm, presented by (Hundman
et al., 2018), which uses Single-Channel Models of
LSTM followed by unsupervised thresholding to de-
tect anomalies in telemetry data streams. Addition-
ally, we considered the “Tsbitmaps” algorithm, based
on (Wei et al., 2005) and (Kumar et al., 2005), which
identifies outliers by comparing the frequency of local
regions in adjacent subsequences using bitmap repre-
sentation and squared Euclidean distance, with incre-
mental updates at each time step.
We also explored the effectiveness of simple sta-
tistical methods, as discussed in (Wu and Keogh,
2021), including averaging, standard deviation, vari-
ance, and moving averages, to detect anomalies. For
our evaluation, we defined an anomaly point as one
that exceeds multiple statistical thresholds simultane-
ously.
Finally, we examined deep learning models
for anomaly detection, specifically “deepod” (Xu,
Hongzuo, ), as presented in (Pang et al., 2019). We
trained six models using our normal flight data and
evaluated their ability to detect anomalous flights.
Each model was trained to learn the patterns of nor-
mal flights, enabling it to distinguish between normal
and anomalous flight data.
Table 2: Anomaly detection results.
TP TN
Simulation CSV No Attack
Telemanon 58.2% 89.6% 90%
Tibstib 42% 86.2% 100%
Statistical 59.7% 86.2% 100%
DeepSVDD 100% 100% 90%
RDP 100% 100% 100%
RCA 100% 100% 100%
GOAD 100% 100% 100%
NeuTraL 100% 100% 100%
The following table provides an overview of the
performance of various anomaly detection algorithms
on data generated using SCART. As shown in the
table, most of the algorithms successfully identified
anomalies in the data.
Additionally, Figure 8 presents the results of run-
ning the Telemanom algorithm on one of our experi-
SIMULTECH 2025 - 15th International Conference on Simulation and Modeling Methodologies, Technologies and Applications
36

ments. The left and right images display the latitude
and longitude sensor readings, respectively. Each im-
age includes two graphs: the blue graph represents the
output generated by SCART with the AddWhiteNoise
attack activated, while the orange graph shows the
predictions made by the Telemanom algorithm for the
anomalous flight. The purple rectangles highlight the
detected anomaly ranges, indicating the duration of
the attack, while the red rectangles mark the period
of the attack generated by SCART. Overall, our re-
sults demonstrate that the Telemanom algorithm suc-
cessfully detected the anomaly introduced by SCART,
showcasing the effectiveness of SCART in simulating
cyber attacks and supporting the development of ro-
bust anomaly detection techniques.
(a) Latitude detection. (b) Longitude detection.
Figure 8: Result of trying to detect the attack with Tele-
manom.
7 CONCLUSIONS AND
DISCUSSION
This paper demonstrates the utility of the SCART
framework for enhancing simulation environments
in real-time systems, particularly in addressing
reliability-related events and advanced cybersecurity
attacks. By integrating the proposed SCART layer
into existing simulation platforms, it is possible to
replicate both random component or subsystem fail-
ures and sophisticated security threats. SCART’s ef-
fectiveness was validated by training machine learn-
ing algorithms to govern a drone’s flight control sys-
tem, achieving higher accuracy and significantly re-
duced false-positive rates.
Our experiments further confirmed SCART’s ca-
pability to generate realistic cyber-attacks, with mul-
tiple anomaly detection methods successfully distin-
guishing between normal and compromised flights.
These results highlight SCART’s ability to simulate
diverse attack scenarios, providing a robust founda-
tion for ongoing research in anomaly detection.
The API and preliminary findings presented in the
evaluation chapter establish a basis for further ex-
ploration of SCART-based solutions. Our research
shows that SCART can generate high-quality datasets
of cyber-attacks, essential for training deep learning
models aimed at real-time anomaly detection with
minimal false positives. Additionally, SCART pro-
vides a reliable means to evaluate and compare differ-
ent anomaly detection algorithms, making it a power-
ful resource for algorithm refinement.
In summary, the SCART framework represents a
significant advancement in real-time systems and cy-
bersecurity. It offers a versatile and cost-effective
tool for simulating complex systems and sophisti-
cated cyber-attacks. We hope this work inspires fur-
ther exploration of SCART’s capabilities and applica-
tions, contributing to more effective and reliable cy-
bersecurity solutions.
REFERENCES
Ahmad, S., Lavin, A., Purdy, S., and Agha, Z. (2017). Un-
supervised real-time anomaly detection for streaming
data. Neurocomputing, 262:134–147.
Ben-Ari, M. (1990). Principles of Concurrent and Dis-
tributed Programming. Prentice-Hall, Inc., USA.
Bl
´
azquez-Garc
´
ıa, A., Conde, A., Mori, U., and Lozano,
J. A. (2021). A review on outlier/anomaly detection
in time series data. ACM Computing Surveys (CSUR),
54(3):1–33.
Cao, L., Jiang, X., Zhao, Y., Wang, S., You, D., and Xu, X.
(2020). A survey of network attacks on cyber-physical
systems. IEEE Access, 8:44219–44227.
Chandola, V., Banerjee, A., and Kumar, V. (2009).
Anomaly detection: A survey.
Goh, J., Adepu, S., Junejo, K. N., and Mathur, A. (2017).
A dataset to support research in the design of secure
water treatment systems. In International conference
on critical information infrastructures security, pages
88–99. Springer.
He, B. and Bai, K.-J. (2021). Digital twin-based sustain-
able intelligent manufacturing: A review. Advances in
Manufacturing, 9:1–21.
Humphreys, T. (2012). Statement on the vulnerability of
civil unmanned aerial vehicles and other systems to
civil gps spoofing. University of Texas at Austin (July
18, 2012), pages 1–16.
Hundman, K., Constantinou, V., Laporte, C., Colwell,
I., and Soderstrom, T. (2018). Detecting space-
craft anomalies using lstms and nonparametric dy-
namic thresholding. In Proceedings of the 24th ACM
SIGKDD international conference on knowledge dis-
covery & data mining, pages 387–395.
Jing, Y., Wang, X., Heredia-Juesas, J., Fortner, C., Gi-
acomo, C., Sipahi, R., and Martinez-Lorenzo, J.
(2022). Px4 simulation results of a quadcopter with
a disturbance-observer-based and pso-optimized slid-
ing mode surface controller. Drones, 6(9).
Katser, I. D. and Kozitsin, V. O. (2020). Skoltech anomaly
benchmark (skab).
Kaur, P., Taghavi, S., Tian, Z., and Shi, W. (2021). A
survey on simulators for testing self-driving cars. In
SCART: Simulation of Cyber Attacks for Real-Time
37

2021 Fourth International Conference on Connected
and Autonomous Driving (MetroCAD), pages 62–70.
IEEE.
Kumar, N., Lolla, V. N., Keogh, E. J., Lonardi, S., and
Ratanamahatana, C. (2005). Time-series bitmaps: a
practical visualization tool for working with large time
series databases. In SDM.
Laplante, P. A. et al. (2004). Real-time systems design and
analysis. Wiley New York.
Lee, H., Yoon, J., Jang, M.-S., and Park, K.-J. (2021).
A robot operating system framework for secure uav
communications. Sensors, 21(4):1369.
Lhee, K.-s. and Chapin, S. J. (2002). Type-assisted dynamic
buffer overflow detection. In USENIX Security Sym-
posium, pages 81–88.
Meier, L., Honegger, D., and Pollefeys, M. (2015). Px4:
A node-based multithreaded open source robotics
framework for deeply embedded platforms. In 2015
IEEE International Conference on Robotics and Au-
tomation (ICRA), pages 6235–6240.
Nemcovsky, Y., Jacoby, M., Bronstein, A. M., and Baskin,
C. (2022). Physical passive patch adversarial attacks
on visual odometry systems. In Proceedings of the
Asian Conference on Computer Vision, pages 1795–
1811.
Nourian, A. and Madnick, S. (2018). A systems theoretic
approach to the security threats in cyber physical sys-
tems applied to stuxnet. IEEE Transactions on De-
pendable and Secure Computing, 15(1):2–13.
Pan, K., Teixeira, A., L
´
opez, C. D., and Palensky, P. (2017).
Co-simulation for cyber security analysis: Data at-
tacks against energy management system. In 2017
IEEE International Conference on Smart Grid Com-
munications (SmartGridComm), pages 253–258.
Pang, G., Shen, C., Jin, H., and Hengel, A. v. d. (2019).
Deep weakly-supervised anomaly detection. arXiv
preprint arXiv:1910.13601.
Papp, D., Ma, Z., and Buttyan, L. (2015). Embedded sys-
tems security: Threats, vulnerabilities, and attack tax-
onomy. In 2015 13th Annual Conference on Privacy,
Security and Trust (PST), pages 145–152. IEEE.
Parkinson, S., Ward, P., Wilson, K., and Miller, J. (2017).
Cyber threats facing autonomous and connected vehi-
cles: Future challenges. IEEE transactions on intelli-
gent transportation systems, 18(11):2898–2915.
Quigley, M., Conley, K., Gerkey, B., Faust, J., Foote, T.,
Leibs, J., Wheeler, R., Ng, A. Y., et al. (2009). Ros: an
open-source robot operating system. In ICRA work-
shop on open source software, volume 3, page 5.
Kobe, Japan.
Sargent, R. G. (2010). Verification and validation of sim-
ulation models. In Proceedings of the 2010 winter
simulation conference, pages 166–183. IEEE.
Schoeberl, M., Hochberger, C., Uhrig, S., Brehm, J., and Pi-
onteck, T. (2019). Architecture of computing systems
– arcs 2019. In Lecture Notes in Computer Science.
Shah, S., Dey, D., Lovett, C., and Kapoor, A. (2017). Air-
sim: High-fidelity visual and physical simulation for
autonomous vehicles. In Field and Service Robotics.
Thing, V. and Wu, J. (2016). Autonomous vehicle security:
A taxonomy of attacks and defences.
Tippenhauer, N. O., P
¨
opper, C., Rasmussen, K., and Cap-
kun, S. (2011). On the requirements for successful
gps spoofing attacks. In Proceedings of the 18th ACM
Conference on Computer and Communications Secu-
rity, pages 75–86.
Varga, A. (2001). Discrete event simulation system. In
Proc. of the European Simulation Multiconference
(ESM’2001), pages 1–7.
Wang, C., Wu, K., Zhou, T., Yu, G., and Cai, Z. (2021).
Tsagen: synthetic time series generation for kpi
anomaly detection. IEEE Transactions on Network
and Service Management, 19(1):130–145.
Wei, L., Kumar, N., Lolla, V. N., Keogh, E. J., Lonardi,
S., and Ratanamahatana, C. (2005). Assumption-free
anomaly detection in time series. In International
Conference on Statistical and Scientific Database
Management.
Wouters, L., Creff, S., Effa, E., and Koudri, A. (2017).
Collaborative systems engineering: Issues and chal-
lenges.
Wu, R. and Keogh, E. (2021). Current time series anomaly
detection benchmarks are flawed and are creating the
illusion of progress. IEEE Transactions on Knowledge
and Data Engineering.
Xu, Hongzuo. DeepOD: Python Deep Outlier/Anomaly De-
tection.
SIMULTECH 2025 - 15th International Conference on Simulation and Modeling Methodologies, Technologies and Applications
38
