
Model Quality and Student Satisfaction in BPMN Education: A
Quasi-Experiment
Matheus Ribeiro Brant Nobre
a
, J
´
essyka Vilela
b
and Lucas Migge de Barros
c
Centro de Inform
´
atica, Universidade Federal de Pernambuco (UFPE),
Av. Jornalista An
´
ıbal Fernandes, s/n – Cidade Universit
´
aria, Recife-PE, Brazil
Keywords:
Emotions, BPMN Modeling, Teaching BPM, Quasi-Experiment, Collaborative Modeling, Individual
Modeling.
Abstract:
Context: Teaching Business Process Management Notation (BPMN) is challenging due to its complexity.
Understanding how to improve BPMN education is crucial for technical accuracy and conceptual clarity.
Objective: This study examines how individual and collaborative BPMN modeling impact model qual-
ity—correctness and completeness—as well as students’ emotional experiences, including motivation, en-
joyment, and relaxation. It also explores the influence of psychological profiles, based on the Keirsey typol-
ogy, on these outcomes. Method: A quasi-experiment with 19 Information Systems students involved three
BPMN modeling exercises of increasing complexity. Participants alternated between individual and collabo-
rative modeling. Evaluations were based on BPMN quality criteria and emotional responses collected through
Likert-scale questionnaires. Statistical analyses included Wilcoxon tests, Spearman correlations, and ANOVA.
Results: There were no significant differences in correctness and completeness between approaches, though
individual modeling slightly outperformed in technical metrics. Collaborative modeling increased enjoyment
and relaxation without reducing technical performance, indicating a trade-off between emotional engagement
and cognitive precision. Psychological profiles influenced outcomes, with Rationals achieving the highest
quality models and Idealists the lowest. Conclusion: The study highlights the need to balance technical rigor
and emotional engagement in BPMN education. Future research should explore long-term effects and collab-
orative tools to enhance BPMN training.
1 INTRODUCTION
Business Process Management (BPM) education
must extend beyond technical expertise, integrating
analytical, modeling, and communication competen-
cies essential for success in process-driven environ-
ments (Sarvepalli and Godin, 2017; Bandara and
et al., 2010)(Nobre and Vilela, 2024).
The Business Process Modeling Notation
(BPMN) is widely used in industry to describe an
organization’s business processes, particularly valued
for bridging communication between business and
IT teams. However, mastering BPMN presents
significant challenges for students due to its complex
syntax and extensive range of elements, which
require high cognitive effort to accurately model
business processes.
a
https://orcid.org/0009-0000-0471-9280
b
https://orcid.org/0000-0002-5541-5188
c
https://orcid.org/0009-0000-2323-5345
This diversity in pedagogical strategies under-
scores the importance of evaluating how these ap-
proaches influence critical metrics, such as BPMN
model quality and student engagement. An under-
explored area in BPM education is how individ-
ual versus collaborative modeling approaches influ-
ence model quality and students’ learning experiences
(Paschoal and et al., 2020). Besides the students’ per-
sonality that influence the learning process, emotions
play an important role in learning, influencing stu-
dents’ performance in challenging tasks.
Computing students often experience negative
emotions, such as frustration and anxiety, during
complex activities, but they also report positive emo-
tions, such as satisfaction and pride, when overcom-
ing obstacles (Atiq and Loui, 2022). This emotional
dynamic underscores the need for instructional strate-
gies that not only enhance technical skill but also
address the emotional challenges inherent in BPMN
modeling tasks.
620
Nobre, M. R. B., Vilela, J. and Migge de Barros, L.
Model Quality and Student Satisfaction in BPMN Education: A Quasi-Experiment.
DOI: 10.5220/0013483100003932
In Proceedings of the 17th International Conference on Computer Supported Education (CSEDU 2025) - Volume 1, pages 620-627
ISBN: 978-989-758-746-7; ISSN: 2184-5026
Copyright © 2025 by Paper published under CC license (CC BY-NC-ND 4.0)

We conducted a quasi-experiment examining the
effects of individual and collaborative BPMN model-
ing on model quality and students’ satisfaction. 19 In-
formation Systems students alternated between mod-
eling individually and in groups, enabling a compar-
ative analysis of correctness, completeness, and self-
reported emotions, including enjoyment, motivation,
and relaxation.
The remaining of the paper is organized as
follows. Section II explores background as well
as related work. Section III outlines the quasi-
experimental design.Section IV presents results. Sec-
tion V contextualizes the findings within the existing
literature, and Section VI offers pedagogical recom-
mendations and directions for future research.
2 BACKGROUND
This section provides an overview of BPM, discusses
how personality profiles and emotions influence the
learning process, and reviews related work investi-
gating the effectiveness of individual and group ap-
proaches in BPM education.
2.1 Keirsey Profile and Emotions
The Keirsey Profile, developed based on Jung’s the-
ory of personality types and the Myers-Briggs Type
Indicator (MBTI), classifies individuals into four pri-
mary temperaments: Guardian, Artisan, Idealist, and
Rational (Yilmaz and O’Connor, 2015).
These temperaments reflect behavioral predispo-
sitions that influence decisions and interactions in
the work environment. When combined with PBL,
Keirsey’s analysis can reveal patterns of behavior and
learning preferences (Arruda et al., 2019).
2.2 Related Work
Research on individual and collaborative modeling
approaches in BPM education has yielded mixed re-
sults, reflecting the complexity of their impact.
An experimental study of (Paschoal and et al.,
2020) compared BPMN modeling in individual and
group contexts, finding no significant differences in
correctness or completeness. However, collabora-
tive activities enhanced engagement and participa-
tion, suggesting that teamwork’s benefits extend be-
yond technical performance. In this context, the So-
cial BPM Lab explored collaborative modeling using
social software tools, emphasizing the development
of communication and teamwork skills (Caporale and
et al., 2013).
Although collaborative activities increased stu-
dent engagement and knowledge exchange, they did
not produce significantly better technical quality than
individual modeling. This highlights the potential
for cooperative activities to build interpersonal skills,
even when their impact on technical outcomes is lim-
ited.
Despite these insights, notable gaps persist. We
did not find studies that comprehensively examine the
role of emotions in BPMN modeling or how emo-
tional states relate to technical performance.
Moreover, the interplay between individual traits,
such as personality profiles and collaborative dynam-
ics, still needs to be explored. Addressing these gaps
is relevant for advancing BPM education and ensur-
ing that technical and interpersonal competencies are
effectively developed.
3 RESEARCH METHOD
In this section, we describe the methodological ap-
proach employed in this study.
3.1 Participants
This paper focuses on an in-person BPM course, de-
livered in Portuguese, with 36 undergraduate students
of the 4th semester from an Information Systems pro-
gram who had little to no prior experience with BPM.
The course spans 60 hours and incorporates a method-
ological approach that includes theoretical lectures,
multiple modeling exercises, exams, and the execu-
tion of an interdisciplinary PBL project (dos Santos
et al., 2023) in teams.
Six groups of six students were formed using the
team formation method (TFM) (dos Santos, 2023),
which integrates various aspects of students’ profiles
(Keirsey profiles, professional experience, gender and
age, and work preferences). Previous studies have ex-
amined the impact of this method compared to self-
selected teams on team performance (Vilela et al.,
2024).
The first author were not involved in teaching or
designing the studied course, and his only role was a
researcher. The second author was the professor of
the course.
3.2 Quasi-Experimental Design
The use of a quasi-experimental design in this study
is justified by the organizational structure of the in-
terdisciplinary PBL project [omitted due to blind re-
Model Quality and Student Satisfaction in BPMN Education: A Quasi-Experiment
621

view], which naturally groups students into prede-
fined teams.
The primary goal of this study is to investigate the
impact of individual and group modeling approaches
on the quality of BPMN models and students’ emo-
tions during the learning process. To achieve this ob-
jective, we define three research questions:
RQ1: What emotions do students report when per-
forming individual and group BPMN modeling?
RQ2: What are the differences in the technical qual-
ity of BPMN models (correctness and completeness)
between individual and group modeling?
RQ3: Does personality profile, as defined by Keirsey’s
typology, influence the technical quality of models or
students’ emotions during modeling activities?
Aims to answer these questions, this quasi-
experiment occurred in three main phases:
1. Training and Familiarization. Students partici-
pated in three classes about BPMN, covering the-
oretical foundations and practical modeling tech-
niques using BPMN tools. A categorization ques-
tionnaire was administered to measure students’
prior experience with process modeling, ensuring
a baseline for future comparisons.
2. Experimental Sessions. This phase occurred in
three stages:
Stage 1. All 36 participants individually modeled
a process in BPMN.
Stage 2. The six groups were randomly assigned
by drawing lots. Groups 2, 3, and 6 performed
the modeling activity in groups, while Groups 1,
4, and 5 completed the exercise individually.
Stage 3. Students modeled another business pro-
cess. Roles were reversed for the subsequent
task, enabling cross-comparisons between indi-
vidual and collaborative conditions.
3. Feedback and Data Collection. After each
session, students completed self-report question-
naires to assess their emotional experiences (mo-
tivation, enjoyment, and relaxation) using a Lik-
ert scale represented by emojis. BPMN models
were evaluated for correctness (accuracy in us-
ing BPMN elements and relationships) and com-
pleteness (including all relevant information for
the modeled scenario) by assistant teachers using
predefined criteria.
3.3 Hypotheses, Variables and
Measurements
The formulation of research hypotheses, outlined in
Table 1, was guided by the study’s central questions
and objectives research.
Table 1: Research Hypotheses.
ID H
0
(Null Hypothesis) H
1
(Alternative Hypothesis)
H1 There is no significant differ-
ence in correctness of BPMN
models produced individually
and in groups.
There is significant difference
in correctness of BPMN mod-
els between individual and
group approaches.
H2 There is no significant dif-
ference in completeness of
BPMN models produced indi-
vidually and in groups.
There is significant difference
in completeness of BPMN
models between individual
and group approaches.
H3 There is no significant dif-
ference in students’ emotions
(motivation, enjoyment, and
relaxation) between individual
and group modeling.
There is significant differ-
ence in students’ emotions be-
tween individual and group
approaches.
H4 Keirsey profiles do not signif-
icantly influence correctness
and completeness of BPMN
models.
Keirsey profiles significantly
influence correctness and
completeness of BPMN
models.
The variables were categorized to provide a struc-
tured understanding of the interactions between the
treatments applied and the observed outcomes, as out-
lined in Table 2.
Table 2: Variables and Attributes.
Category Description
Independent
Variables (Pa-
rameters)
Tool used (Bizagi Modeler), model structures
(AS-IS and TO-BE), evaluation method.
Independent
Variables (Fac-
tors)
Modeling approach (individual or group),
Keirsey profile (Guardian, Artisan, Idealist,
Rational).
Dependent Vari-
ables
Quality of BPMN models (Correctness and Com-
pleteness), Students’ emotions (Motivation, En-
joyment, and Relaxation).
Correctness (CR) and completeness (CM) were
chosen as critical indicators of model quality, sup-
ported by prior BPMN evaluation studies (Paschoal
and et al., 2020). CR was calculated using a weighted
formula for error severity (light, medium, severe), of-
fering a nuanced assessment of technical accuracy.
This weighted system provides a more detailed
evaluation than binary correctness measures, captur-
ing the practical significance of different error types
for the model’s usability. The formula for CR is:
CR =
EC
EC + (1 × EI
Light
) + (2 × EI
Medium
) + (3 × EI
Severe
)
The maximum correctness value (CR = 1) is
achieved when all model elements are correct, with
no errors. Conversely, CR = 0 reflects all elements
being incorrect and classified as severe errors.
Completeness (CM) was calculated similarly, in-
corporating the presence of relevant information and
the severity of omissions. This metric evaluates
the quantity of information included and the impact
CSEDU 2025 - 17th International Conference on Computer Supported Education
622
of missing elements, emphasizing model compre-
hensiveness’s practical significance in BPM contexts
(Paschoal and et al., 2020).
By adhering to best practices in empirical re-
search, these domain-specific metrics ensure reliable
and objective technical assessments (Wohlin et al.,
2012). The formula for CM is:
CM =
IR
IR + (1 × FI
Light
) + (2 × FI
Medium
) + (3 × FI
Severe
)
A completeness value of 1 indicates that all rel-
evant information is included in the model, while 0
reflects the absence of all relevant information, with
omissions classified as severe.
3.4 Data Collection and Analysis
Procedures
Before the experimental activities began, in the in-
terdisciplinary PBL project, participants completed a
questionnaire with information such as group iden-
tifier, gender, age, years of work experience, and
Keirsey profile.
The categorization questionnaire collected base-
line data on participants’ prior experience with mod-
eling.This step was essential to control for confound-
ing variables, ensuring that outcome differences could
be attributed to the experimental treatments rather
than external factors.
The BPMN modeling tasks were designed to
replicate real-world scenarios involving AS-IS and
TO-BE processes. The tasks ensured consistency
across participants by using predefined case studies
and a standardized tool (Bizagi Modeler) while allow-
ing for variations in approach (individual or group).
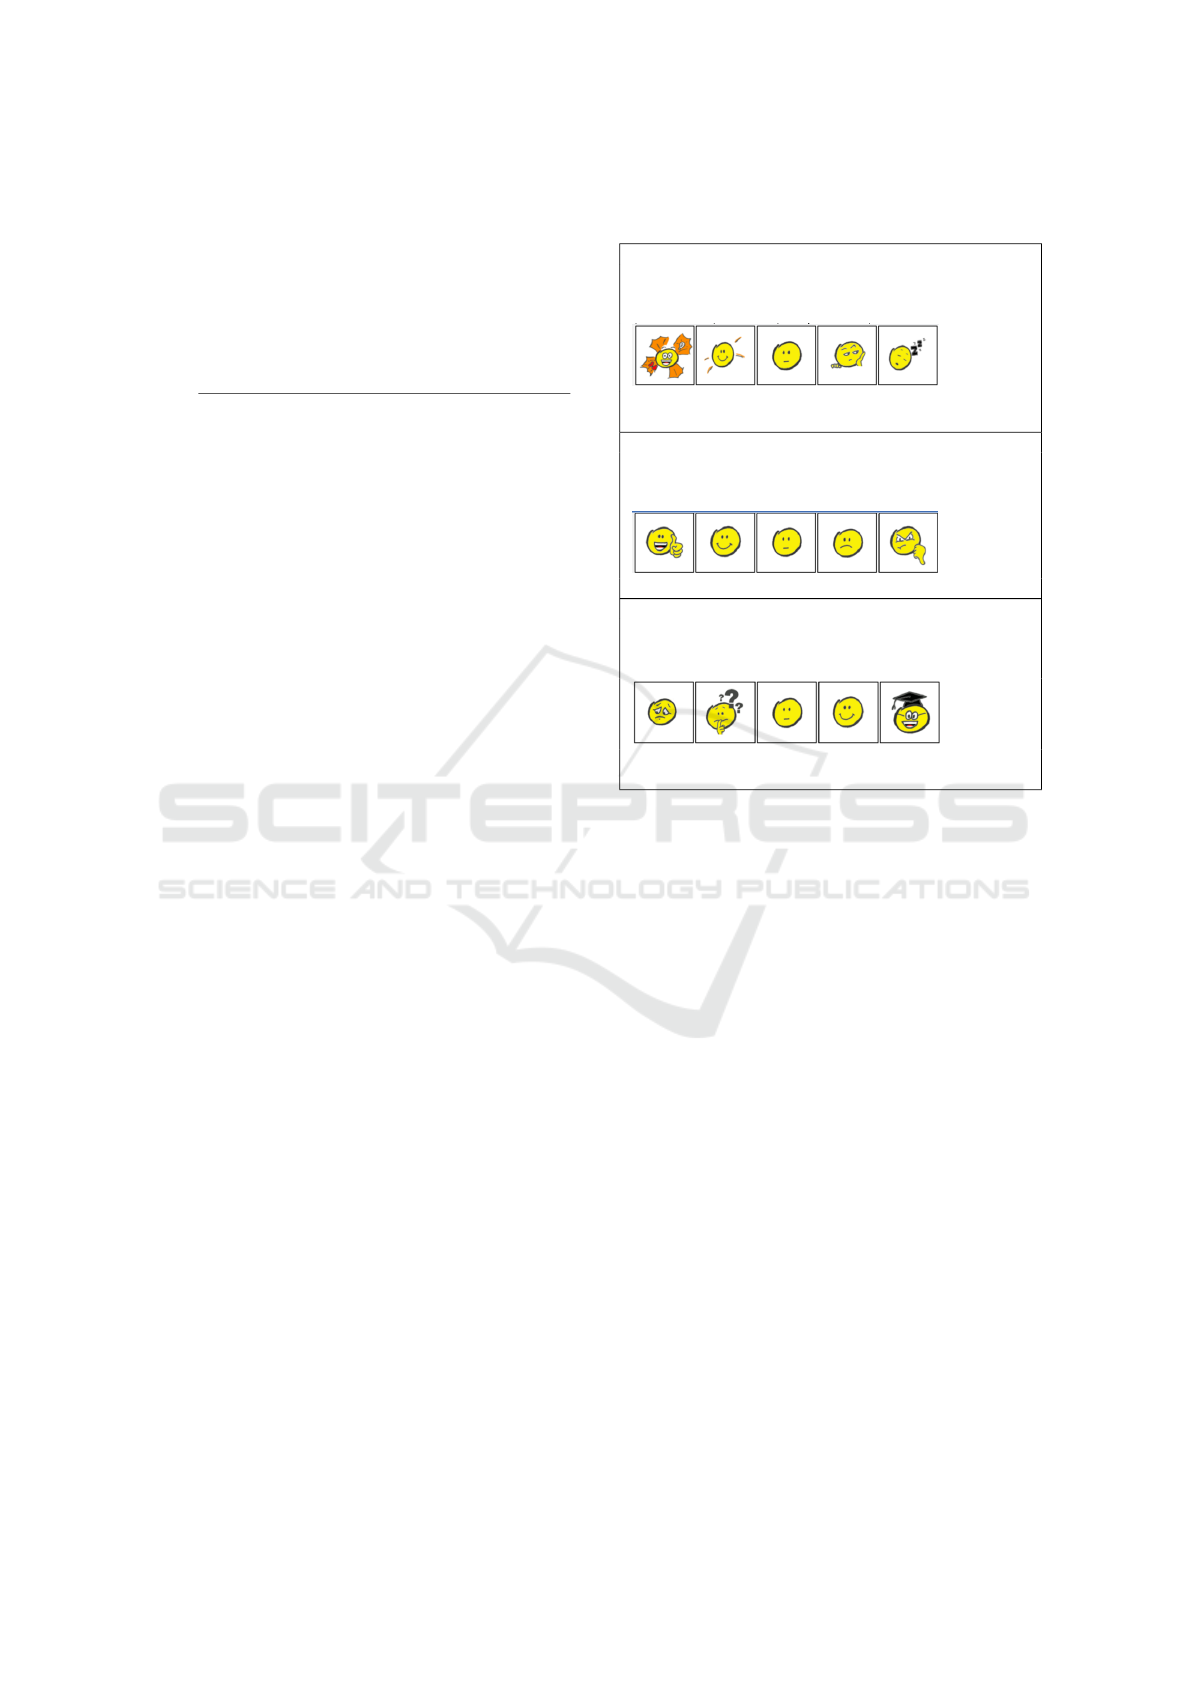
Emotion questionnaires, as illustrated in Table 3,
represented visually with emojis on a Likert scale,
were employed to reduce subjectivity and ensure par-
ticipant engagement.
The data analysis followed a multi-step approach,
leveraging a combination of statistical methods tai-
lored to the research questions and the nature of the
data. Each method was selected based on its suitabil-
ity for addressing specific aspects of the experiment:
1. Spearman’s Correlation. This non-parametric
test was employed to identify relationships be-
tween variables, such as the impact of prior ex-
perience on technical and emotional outcomes.
2. Wilcoxon Signed-Rank Test. The Wilcoxon
test compared paired samples from individual and
group modeling conditions. This test was selected
for its ability to handle small sample sizes and
non-normal data distributions, common in educa-
tional experiments.
Table 3: Questionnaire used to collect students’ feedback
regarding their emotions.
MOTIVATION
Regarding your MOTIVATION when learning about business process
modeling. How did you feel before process modeling activity? (observe
and select the image that best represents your MOTIVATION)
Totally motivated, Partially motivated, Neutral Partially, unmotivated
Totally unmotivated.
FUN
Regarding FUN when learning about business process model-
ing. How did you feel during the process modeling activity?
(observe and select the image that best represents your FUN)
Totally fun, Partially fun, Neutral, Partially boring, Totally boring.
RELAXATION
Regarding your feeling of RELAXATION during the modeling activity.
How did you feel after the process modeling activity? (observe and
select the image that best represents your RELAXATION)
Totally relaxing Partially relaxing Neutral, Partially stressful, Totally
stressful.
3. Repeated Measures ANOVA. To evaluate vari-
ations across sessions and interactions between
factors (e.g., Keirsey profile, modeling approach),
a Repeated Measures ANOVA was conducted.
The study minimized the risks of type I and type
II errors by triangulating findings across multiple sta-
tistical methods, ensuring robust and credible con-
clusions (Wohlin et al., 2012). These comprehen-
sive procedures underscore the study’s methodolog-
ical rigor and contribution to advancing empirical re-
search in BPM education.
3.5 Ethics and Transparency
Following best practices for empirical research
(Wohlin et al., 2012; Kitchenham and et al., 2017),
ethical procedures addressed concerns regarding vol-
untary participation, data confidentiality, and the sep-
aration of academic requirements from research com-
ponents.
The Informed Consent Form clarified that partici-
pation in emotion assessments and feedback question-
naires was voluntary and anonymous, ensuring stu-
dents could opt out without academic repercussions.
The BPMN modeling activities, mandatory for
course evaluation, were explicitly separated from op-
tional research elements, preventing coercion and up-
Model Quality and Student Satisfaction in BPMN Education: A Quasi-Experiment
623
holding ethical standards.
Transparency was emphasized, with participants
informed about how their data would contribute to
pedagogical improvements and academic literature.
The consent form included detailed explanations of
how the data would be aggregated, analyzed, and re-
ported, ensuring that no personal identifiers would be
linked to the results.
3.6 Threats to Validity
Following the guides proposed by (Wohlin et al.,
2012), we addressed four key validity concerns.
Internal Validity: Participants’ prior BPMN experi-
ence potentially threatened internal validity by in-
fluencing model quality. To mitigate this, a cate-
gorization questionnaire assessed participants’ back-
grounds, and standardized training sessions were con-
ducted to equalize BPMN competencies.
Another factor is the mix of parametric (ANOVA)
and non-parametric (Wilcoxon, Spearman) tests. We
applied ANOVA to compare personality profiles be-
cause the data approximated normality, while using
Wilcoxon and Spearman for paired and ordinal data.
External Validity: The limited sample size (19 partici-
pants after data processing) and the academic context
restricted the generalizability of findings to broader
professional or cross-institutional settings.
Moreover, the controlled academic environment
may only partially capture the complexities of profes-
sional BPMN tasks, such as time constraints and orga-
nizational challenges. Interdisciplinary PBL projects
were employed to simulate real-world scenarios, but
caution is needed when extrapolating findings to in-
dustrial contexts.
Construct Validity:
Validated criteria from BPMN literature, reviewed
by domain experts, were used to define correctness
and completeness. The emoji-based Likert scale en-
hanced emotional engagement and clarity, but inte-
grating additional validated emotion scales could pro-
vide more excellent reliability and nuance in future
research.
Ecological Validity: While the academic setting of-
fered controlled conditions for studying BPMN mod-
eling, it differed from professional contexts involv-
ing higher stakes, collaborative dynamics, and larger
datasets. The interdisciplinary PBL framework par-
tially addressed this by simulating real-world chal-
lenges, but further studies in industrial environments
would strengthen ecological validity.
4 RESULTS
The dataset was derived from 33, 30, and 19 students
for Exercises 1, 2, and 3, respectively. After exclud-
ing incomplete data, 19 participants who completed
all three questionnaires were retained to ensure reli-
able analysis.
4.1 RQ1: What Emotions Do Students
Report when Performing Individual
and Group BPMN Modeling?
Participants’ emotional responses were evaluated us-
ing Wilcoxon tests and Spearman correlations. As
shown in Table 4, the Wilcoxon test revealed no statis-
tically significant differences between individual and
group modeling for motivation (p = 1.000), enjoy-
ment (p = 1.000), and relaxation (p = 0.824).
These results suggest that the modeling activity
format did not substantially influence the reported
emotions, leading to the retention of the null hypoth-
esis (H
3
).
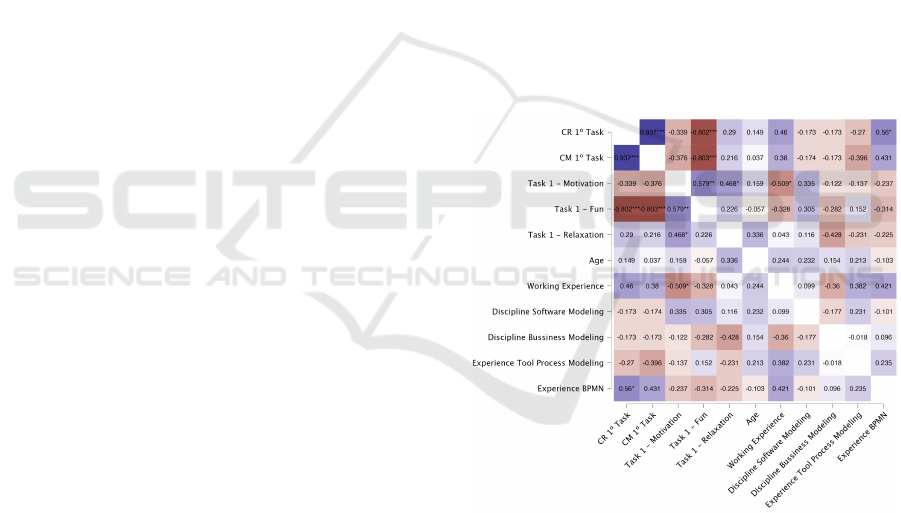
Figure 1: Spearman Correlation - Task 1.
The Spearman correlations analysis for the first
BPMN modeling, visualized in Figure 1, highlighted
significant relationships between emotional dimen-
sions. Motivation strongly correlated with enjoyment
(ρ = 0.579, p < 0.01) and relaxation (ρ = 0.468, p <
0.05), indicating an intrinsic link between these posi-
tive emotional states.
Additionally, a strong negative correlation be-
tween correctness and enjoyment (ρ = −0.802, p <
0.001) emerged, suggesting an inverse relationship
where higher enjoyment corresponded to lower cor-
rectness scores. This points to a potential tension be-
CSEDU 2025 - 17th International Conference on Computer Supported Education
624
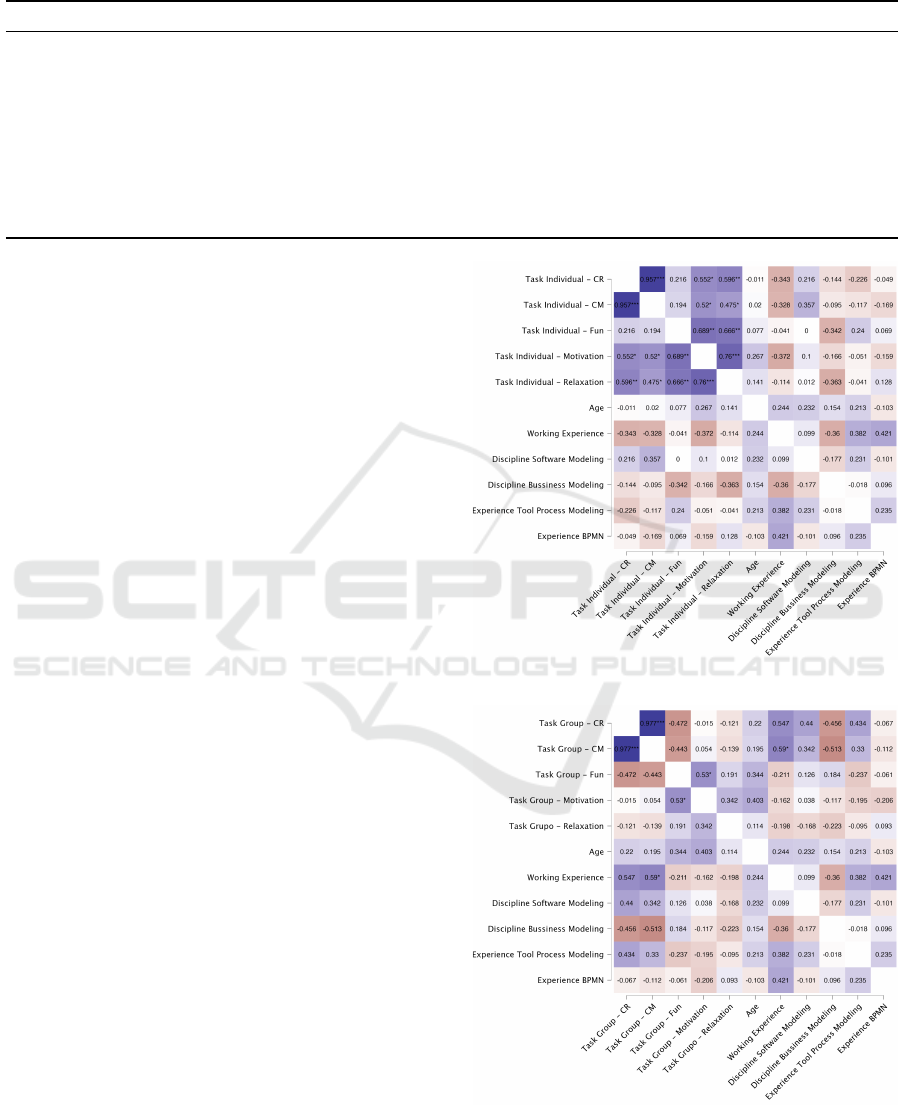
Table 4: Paired Samples T-Test.
Measure 1 Measure 2 Test Statistic z df p Effect Size SE Effect Size
Individual Task - Correctness - Group Task - Correctness Student 0.892 12 0.390 0.248 0.434
Wilcoxon 47.000 0.628 0.556 0.205 0.316
Individual Task - Completeness - Group Task - Completeness Student 1.039 12 0.319 0.288 0.424
Wilcoxon 58.000 0.874 0.414 0.275 0.305
Individual Task - Fun - Group Task - Fun Student −0.195 18 0.848 −0.045 0.241
Wilcoxon 52.000 −0.031 1.000 −0.010 0.294
Individual Task - Motivation - Group Task - Motivation Student 0.000 18 1.000 0.000 0.179
Wilcoxon 22.500 0.000 1.000 0.000 0.358
Individual Task - Relaxation - Group Task - Relaxation Student 0.271 18 0.790 0.062 0.197
Wilcoxon 30.000 0.255 0.824 0.091 0.342
tween emotional engagement and technical precision.
Participants with prior modeling experience re-
ported greater enjoyment, underscoring the role of
familiarity and competence in shaping emotional re-
sponses. These findings emphasize the need for fu-
ture studies to consider how prior knowledge and task
complexity interact to shape emotional and technical
outcomes in BPM learning environments.
4.2 RQ2: What Are the Differences in
the Technical Quality of BPMN
Models (Correctness and
Completeness) Between Individual
and Group Modeling?
To examine differences in technical quality, we ana-
lyzed correctness (CR) and completeness (CM) using
Wilcoxon tests and Spearman correlations.
As shown in Table 4, the Wilcoxon test found no
significant differences between individual and group
modeling in correctness (p = 0.628) or completeness
(p = 0.874).
This supports the null hypotheses (H
1
and H
2
),
indicating that the modeling format did not signifi-
cantly impact technical quality. Notably, both con-
ditions yielded high average scores in CR and CM,
reflecting students’ solid grasp of BPMN concepts.
The individual modeling correlations, depicted in
Figure 2, showed a strong positive association be-
tween correctness and completeness (ρ = 0.957, p <
0.001). This relationship underscores the intercon-
nectedness of technical precision and conceptual un-
derstanding in BPMN modeling.
Similarly, Figure 3 highlights how prior work
experience positively influenced completeness (ρ =
0.590, p < 0.05) in group tasks, suggesting that real-
world exposure plays a crucial role in enhancing
model quality.
These results align with prior studies suggesting
that while collaboration fosters interpersonal skills
and engagement, its impact on technical quality may
Figure 2: Spearman Correlation - Individual Task.
Figure 3: Spearman Correlation - Group Task.
depend on participants’ experience levels and task
complexity.
Model Quality and Student Satisfaction in BPMN Education: A Quasi-Experiment
625
4.3 RQ3: Does Personality Profile, as
Defined by Keirsey’s Typology,
Influence the Technical Quality of
Models or Students’ Emotions
During Modeling Activities?
To assess the impact of Keirsey profiles, ANOVA
analyzed differences across personality types, and
Wilcoxon tests evaluated emotional variations.
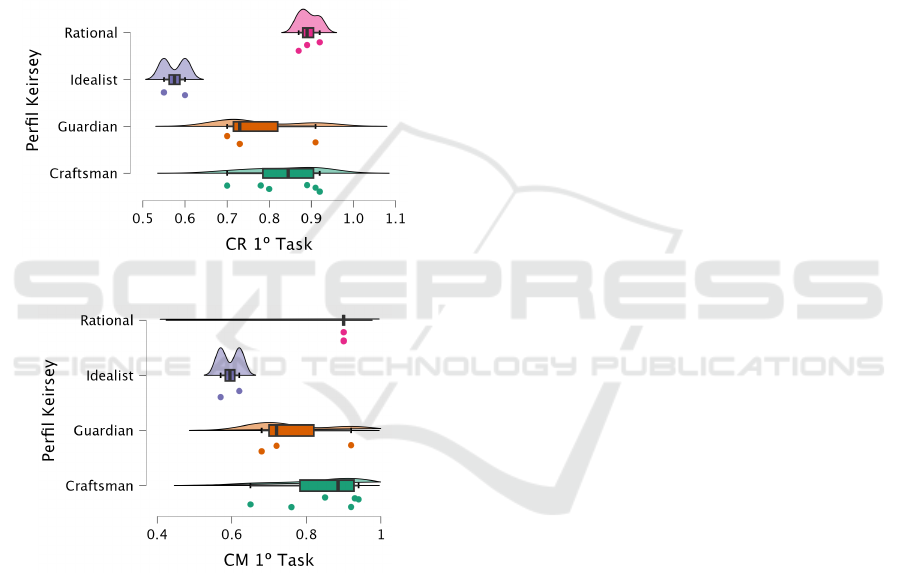
The ANOVA results, illustrated in Figures 4 and
5, demonstrated significant differences in correct-
ness (F = 6.761, p < 0.01) and completeness (F =
4.153, p = 0.038) across profiles.
Figure 4: ANOVA - Keirsey CR.
Figure 5: ANOVA - Keirsey CM.
Rationals achieved the highest CR (M = 0.893)
and CM (M = 0.900), while Idealists scored the low-
est (CR: M = 0.575, CM: M = 0.595). These find-
ings reject the null hypothesis (H
4
), confirming that
personality traits significantly influence technical out-
comes.
Conversely, Wilcoxon tests revealed no significant
differences in emotional responses between profiles
(p > 0.05). This indicates that while personality influ-
ences technical performance, emotional experiences
during modeling activities remained consistent across
types.
These insights suggest that personality traits, par-
ticularly those of Rationals, can be strategically lever-
aged to enhance team performance and task out-
comes. Idealists, however, may benefit from targeted
support and technical reinforcement.
Future research could explore how adaptive teach-
ing methods cater to diverse personality profiles, op-
timizing technical precision and emotional engage-
ment.
5 DISCUSSION
A notable contribution of our study is the examination
of emotions alongside technical indicators. We de-
tected a negative correlation between enjoyment and
correctness, suggesting that greater enjoyment might
correspond to lower perceived cognitive effort, align-
ing with the idea that high “fun” can sometimes de-
tract from meticulous task execution (Van Merrien-
boer and Ayres, 2005).
Further, incorporating Keirsey personality profiles
showed that Rationals performed best in terms of cor-
rectness and completeness, whereas Idealists lagged.
This finding reinforces the idea that personal traits
and learning preferences can influence modeling out-
comes, offering actionable insight for educators who
might tailor support or team composition accordingly.
Taken together, our results support earlier argu-
ments that collaboration boosts positive emotions and
interpersonal engagement but does not inherently in-
crease technical quality in BPMN modeling. They
also expand the conversation by linking personality
factors to outcomes.
Despite the limited sample, this research extends
BPM education literature by weaving together techni-
cal metrics, emotional measures, and personality pro-
files within a single quasi-experimental study. Such
an approach underlines the complexity of BPMN in-
struction, where cognition, affect, and interpersonal
dynamics all converge.
6 CONCLUSIONS AND FUTURE
WORK
This study provides new insights into the intersec-
tion of technical performance, emotional engagement,
and individual characteristics in BPM education. Our
findings demonstrate no statistically significant differ-
ences in the correctness and completeness of BPMN
models between individual and collaborative model-
ing approaches.
CSEDU 2025 - 17th International Conference on Computer Supported Education
626

This suggests that while collaborative activities
may enhance interpersonal dynamics and engage-
ment, they do not inherently improve technical accu-
racy or comprehensiveness. Furthermore, the strong
correlations between emotional states—such as mo-
tivation and enjoyment—and technical performance
highlight the multifaceted nature of the learning ex-
perience.
By integrating personality profiles and prior ex-
perience as variables, our study goes beyond tradi-
tional analyses to emphasize the individualized fac-
tors influencing BPM learning. Identifying personal-
ity traits, such as the Rational profile’s tendency for
higher technical quality, offers valuable insights for
educators seeking to design tailored learning strate-
gies.
Longitudinal studies examining how personal-
ized interventions based on personality profiles af-
fect long-term learning outcomes are recommended.
Comparative analyses across different institutions and
cultural contexts could offer a more comprehensive
understanding of BPM education’s global applicabil-
ity.
ACKNOWLEDGEMENTS
The authors extend their heartfelt thanks to all the stu-
dents who participated in this study for their dedica-
tion and valuable contributions. We also thank the
educators and administrative staff whose support fa-
cilitated the experimental sessions. Finally, this work
was only possible with the collaborative efforts of the
interdisciplinary teaching team, whose insights and
guidance enriched this research.
REFERENCES
Arruda, F., Dos Santos, S. C., and Bittencourt, R. A. (2019).
Understanding the relationship between pbl princi-
ples, personality types and learning profiles: An initial
analysis. In 2019 IEEE Frontiers in Education Con-
ference (FIE), pages 1–7. IEEE.
Atiq, Z. and Loui, M. C. (2022). A qualitative study of
emotions experienced by first-year engineering stu-
dents during programming tasks. ACM Transactions
on Computing Education (TOCE), 22(3):1–26.
Bandara, W. and et al. (2010). Business process manage-
ment education in academia: Status, challenges, and
recommendations. Communications of the Associa-
tion for Information Systems, 27(1):743–776.
Caporale, T. and et al. (2013). Social bpm lab–
characterization of a collaborative approach for busi-
ness process management education. In 2013 IEEE
15th Conference on Business Informatics, pages 367–
373. IEEE.
dos Santos, S. C. (2023). Transforming Computing Edu-
cation with Problem-Based Learning: From Educa-
tional Goals to Competencies. Cambridge Scholars
Publishing.
dos Santos, S. C., Vilela, J., and Vasconcelos, A. (2023).
Promoting professional competencies through inter-
disciplinary pbl: An experience report in computing
higher education. In 2023 IEEE Frontiers in Educa-
tion Conference (FIE), pages 1–9. IEEE.
Kitchenham, B. and et al. (2017). Robust statistical methods
for empirical software engineering. Empirical Soft-
ware Engineering, 22:579–630.
Nobre, M. and Vilela, J. (2024). Content and skills for
teaching bpm in computer science courses: A system-
atic mapping study. In Proceedings of the 16th Inter-
national Conference on Computer Supported Educa-
tion (CSEDU).
Paschoal, L. N. and et al. (2020). What are the differences
between group and individual modeling when learn-
ing bpmn? In Proceedings of the XVI Brazilian Sym-
posium on Information Systems, pages 1–8.
Sarvepalli, A. and Godin, J. (2017). Business process man-
agement in the classroom. Journal of Cases on Infor-
mation Technology (JCIT), 19(2):17–28.
Van Merrienboer, J. J. and Ayres, P. (2005). Research on
cognitive load theory and its design implications for
e-learning. Educational Technology Research and De-
velopment, 53(3):5–13.
Vilela, J., Santos, C. d., and Maia, D. (2024). Impact
of team formation type on students’ performance in
pbl-based software engineering education. In Interna-
tional Conference on Computer Supported Education
(CSEDU).
Wohlin, C., Runeson, P., H
¨
ost, M., Ohlsson, M. C., Reg-
nell, B., and Wessl
´
en, A. (2012). Experimentation in
software engineering. Springer Science & Business
Media.
Yilmaz, M. and O’Connor, R. V. (2015). Understand-
ing personality differences in software organisations
using keirsey temperament sorter. IET Software,
9(5):129–134.
Model Quality and Student Satisfaction in BPMN Education: A Quasi-Experiment
627
