
Remote Sensing-Based Temporal Analysis of Aletsch Glacier Retreat
(1990–2020)
Andrija Krtalić
1a
, Ana Kuveždić Divjak
1b
and Kristina Zeman Šteković
2
1
University of Zagreb Faculty of Geodesy, Kačićeva 26, Zagreb, Croatia
2
SOPRA PROJEKT LTD, Remetinečka cesta 5C, Zagreb, Croatia
Keywords: Glacier, Remote Sensing, Climate Changes, Sentinel 2, Landsat 5.
Abstract: Glaciers represent an important component of the cryosphere and are among the most sensitive indicators of
climate change and global warming. Over recent decades, climate change has significantly accelerated glacier
retreat, prompting the development of various monitoring methods, such as the Glacier Monitoring in
Switzerland (GLAMOS) program. Key parameters for understanding glacier dynamics include changes in
mass balance, length, surface area, and snow accumulation, all of which are closely tied to climatic variations.
These changes manifest as alterations in glacier morphology and mass, resulting in notable retreat compared
to previous decades when such trends were less pronounced. This study focuses on analysing changes in the
Great Aletsch Glacier, the largest glacier in the Alps, over the period 1990–2020 using remote sensing
data/techniques. Automated glacier detection and mapping methods were applied, utilizing optical satellite
data from Sentinel-2 and Landsat-5 missions. Glacier extents were delineated and analysed over the 30-year
period, integrating satellite-derived estimates with official GLAMOS data and climatological records from
the MeteoSwiss agency. The results reveal a reduction of approximately 5.2% in the surface area of the Great
Aletsch Glacier, providing valuable insights into the glacier’s response to ongoing climate change.
1 INTRODUCTION
Glaciers are massive, permanent ice bodies formed
over centuries through the accumulation and
compaction of snow into dense ice masses,
constituting a critical component of the cryosphere
(Hock and Truffer, 2024, Haeberli et al., 2007). While
most glaciers are concentrated in polar regions, they
are also found in temperate and tropical latitudes at
higher altitudes, where they play a crucial role in
sustaining human activities. Glaciers in these regions
act as vital freshwater reservoirs, support agricultural
practices, and often serve as significant attractions for
tourism.
On a global scale, glaciers are widely recognized
as one of the most visible and sensitive indicators of
climate change (Hock and Truffer, 2024); Winsvold
et al., 2016). This is particularly evident in alpine and
tropical glaciers, which are especially vulnerable to
climatic fluctuations. These glaciers are critical for
local water resources and human activities, yet they
a
https://orcid.org/0000-0002-9441-0179
b
https://orcid.org/0000-0003-1059-8395
have experienced significant retreat over recent
decades due to global warming. To address this,
numerous glacier monitoring programs have been
established, including Glacier Monitoring in
Switzerland (GLAMOS, 2025). Key glacier
parameters, such as changes in mass, length, area, and
snow cover, are directly linked to climatic variations,
with glacier length often responding to climate
change after a time lag (Nie et al., 2024, Pandey and
Venkataraman, 2012).
Given the importance of glaciers and the potential
hazards associated with their retreat, international
monitoring initiatives have been developed.
Programs such as the World Glacier Monitoring
Service (WGMS), Global Land Ice Measurements
from Space (GLIMS), the Randolph Glacier
Inventory (RGI), GLAMOS, and the Global
Terrestrial Network for Glaciers (GTN-G) provide
critical insights into the status and dynamics of
glaciers worldwide.
Krtali
´
c, A., Divjak, A. K. and Štekovi
´
c, K. Z.
Remote Sensing-Based Temporal Analysis of Aletsch Glacier Retreat (1990–2020).
DOI: 10.5220/0013481100003935
In Proceedings of the 11th International Conference on Geographical Information Systems Theory, Applications and Management (GISTAM 2025), pages 253-263
ISBN: 978-989-758-741-2; ISSN: 2184-500X
Copyright © 2025 by Paper published under CC license (CC BY-NC-ND 4.0)
253

Monitoring glaciers poses significant challenges
due to their vast scale and the logistical difficulty of
collecting in situ data. Consequently, remote sensing
has become an essential tool for observing glacier
dynamics and detecting changes over time. Remote
sensing data/technologies enable the systematic
collection of Earth observation data, facilitating the
monitoring of temporal and spatial changes in
glaciers while also aiding in hazard assessments. The
literature identifies four primary remote sensing
methodologies for glacier monitoring, categorized
based on the type of data used: (1) optical and near-
infrared sensor data, (2) thermal infrared sensor data,
(3) microwave electromagnetic spectrum data, and
(4) synthetic aperture radar (SAR) interferometry
(Wen and Wang, 2024).
This study focuses on the use of optical and near-
infrared sensor data, specifically from the Landsat 5
satellite system, to analyse surface changes in the
Great Aletsch Glacier. By leveraging these methods,
the research aims to provide valuable insights into the
glacier's temporal dynamics and its response to
climatic changes over the last three decades.
2 REMOTE SENSING
APPROACHES TO GLACIER
MONITORING AND HAZARD
ASSESSMENT
Mountain glaciers in tropical and temperate regions
are very good indicators of climate change (Burns and
Nolin, 2014) and are key resources for drinking
water, maintaining agriculture and hydropower,
especially in dry seasons. The melting and retreat of
glaciers due to global warming leads to the creation
and enlargement of glacial lakes, which can pose a
significant threat in the form of glacial lake outburst
floods (GLOF). Globally, about 15 million people are
directly exposed to the impacts of potential GLOFs
(Taylor, Robinson, Dunning, 2023), and the most
endangered areas are Central Asia (India, Pakistan,
China), the Andes (Peru), and the European Alpine
countries (Switzerland, Austria, Italy), (Emmer et al.,
2022).
The continued loss of glacier ice and the
expansion of glacial lakes due to climate change,
particularly in temperate and tropical densely
populated areas, represent a global natural hazard that
requires attention to minimize loss of life and
destruction of infrastructure. Accordingly, the need to
monitor glacier changes has arisen, and global,
regional and national monitoring programs of
particular importance have been established. The
above topic is mostly dealt with by Indian and
Pakistani scientists with a focus on Himalayan glacial
phenomena (Nie et al., 2024, Pandeyand and
Venkataraman, 2016, Shafique et al., 2018),
European scientist with a focus on Alps glacials
(D’Agatha et al., 2018), and American scientists with
a focus on Andean and North American geospace
(Bolch and Wheate 2010, Romanov and Gutman,
2000).
Remote sensing-based observations of glacial
landforms have proven to be crucial for monitoring
changes, as routine in-situ data collection in isolated,
hard-to-reach mountainous regions is often very
difficult due to large spatial coverage and weather
variations (Nie et al., 2024, Wang et al., 2025). There
are significant advantages of remote sensing for crisis
management, such as continuous observations before
and after a certain event, the possibility of integrating
a wide range of different complementary sensors and
easy integration into geoinformation systems, the use
of adaptable and simple algorithms, a significant
reduction in fieldwork, archiving and reuse of images.
Potential disadvantages, some of which are being
addressed and reduced over time, include insufficient
spatial and temporal resolution, data incompatibility,
technical complexity, the high cost of access to
commercial images (sub-meter spatial resolution),
and the limited use of optical sensors depending on
weather conditions (Kerle and Oppenheimer, 2002).
The first satellite systems for remote sensing had
a spatial resolution of 80 m and a small number of
spectral channels (Landsat 2). The launch of the
Landsat 4 and 5 satellite systems with the Thematic
Mapper sensor (Landsat TM), with better spatial and
spectral resolution, enabled improved mapping and
monitoring of glacial areas. In addition to these data,
multisensor satellite data such as MODIS (Rigs et al.,
2006), ASTER (Wang et al., 2025), the upcoming
Landsat 7 and 8 missions and the new TM (Masek et
al., 2006, Shafique et al., 2018), Sentinel 2 (Frank et
al., 2016) and also radar images like Sentinel-1.
Satellite images are then integrated with global or
national meteorological data, digital elevation model
(DEM) data, and in situ data using various modelling
techniques (Ashraf et al., 2016).
During research, various multispectral channels
are most often combined in order to distinguish the
desired land cover classes by classification (Dozier,
1989, Rosenthal and Dozier, 1996), useful indices
such as the Normalized Difference Vegetation Index
(Rouse et al., 1974) and the Normalized Difference
Snow Index (Hall, Riggs, 2011) are calculated. and
today they are increasingly using machine and deep
GISTAM 2025 - 11th International Conference on Geographical Information Systems Theory, Applications and Management
254

learning methods (Chu et al., 2022). Many scientists
are engaged in measuring various parameters of snow
and ice such as the thickness and movement of
glaciers using LIDAR (Deems et al., 2013) to
estimate the melting of glaciers, or the thickness and
volume of snow and ice through aerial photographs
(Meyer et al., 2022), and to assess drinking water as
well as potential hazards.
The research presented in this paper aims to map
and analyse the spatial and temporal changes of the
largest Alpine glacier, the Great Aletsch, over a 30-
year period (1990–2020). This analysis exclusively
utilizes open-access datasets from the Landsat 5 and
Sentinel-2 satellite systems, employing selected
remote sensing methodologies to provide insights
into glacial dynamics and associated hazards.
3 MATHERIALS AND METHODS
3.1 Study Area
The object of the study is the Great Aletsch Glacier,
located in the Swiss Alps and representing the largest
Alpine ice mass with an area of 78.49 km
2
and a
volume of approximately 12 km
3
(data from 2017).
The Great Aletsch is one of 1400 Swiss glaciers
located in the Alps, and extends between 1650 and
4160 meters above sea level, with a pronounced
retreat of the lowest point (GLAMOS, 2025,
GLAMOS 1880-2021). The glacier consists of three
main tributaries – Aletschfirn, Jungfraufirn and
Ewigschneefeld (Figure 1) which merge at the
Konkordiaplatz with an ice thickness of 800 - 1000
meters and form a common 'tongue', which extends
approximately 15 km to the southwest (GLAMOS).
According to official data (GLAMOS 1880-
2021), the glacier area has decreased from 86.62 km
2
in 1976 to 78.48 km
2
(decrease of 9.4%) in 2016. The
Great Aletsch Glacier was at its peak around 1860. At
that time, it was about 3 km longer than today, and
the glacier edge was about 200 m higher in the
Aletsch Forest area, and this area stands out today as
a belt of relatively young vegetation in the landscape
(UNESCO, 2025).
Continuous monitoring of the length of the Great
Aletsch Glacier has been taking place since 1870, and
a reduction of -3459 meters in length has been
recorded in the period 1870-2021. More detailed
monitoring was established in 1918 with the
installation of the first measuring rod at 3350 m above
sea level at Jungfraufirn. The data are publicly
available on the GLAMOS website (URL4). Since
1990 (which was chosen as the reference year in this
study), the length of the glacier has decreased by -
1315.4 m (GLAMOS 2022).
The Greater Aletsch consists of two distinct areas.
The first is the accumulation area at higher altitudes,
where the annual increase in fresh snow during the
winter months is greater than the snowmelt in the
summer. The second area is the ablation area below
Konkordiaplatz, where the melting of ice is stronger
due to higher summer temperatures, and glacier mass
is lost in the lower part. It is assumed that this area
will see the largest changes in the results of remote
sensing data/methods.
Figure 1: Appearance and position of the main components
(Aletschfirn, Jungfraufirn and Ewigschneefeld) of the Great
Aletsch Glacier in the Swiss Alps (Source: GLAMOS
1880-2021).
3.2 Climatic Factors Affecting the
Great Aletsch Glacier
The development and maintenance of glaciers are
largely determined by climatological, orographic and
hydrographic features. The average annual
temperatures in the upper part of the Great Aletsch
Glacier are below freezing, while in the glacier
tongue area they are slightly above 0°C (Figure 2a).
Another very important indicator for glaciers is the
amount of precipitation. Figure 2b shows the
relatively dry climate in the glacier tongue, but the
highest precipitation in all of Switzerland is measured
Remote Sensing-Based Temporal Analysis of Aletsch Glacier Retreat (1990–2020)
255

in the Jungfraujoch glacier accumulation area, which
reaches an average of about 3000 mm per year,
influenced by precipitation from the north.
Figure 2: a) Average annual temperature in °C and b)
average annual precipitation in mm in Switzerland in the
period 1991-2020 (MeteoSwiss, 2025). The location of the
Aletsch Glacier is marked with a yellow ellipse.
The amount of snow cover is another important
factor for glacier maintenance. Official data from
MeteoSwiss show a statistically significant decline in
the number of days with fresh snow, as well as in
annual fresh snow depths, since the 1960s in many
areas of Switzerland, which is accelerating glacier
melting (MeteoSwiss, 2025).
Under the influence primarily of temperature and
precipitation, the glacier is divided into an area of
accumulation (the upper part of the glacier) and
ablation, i.e. erosion/landing (the tongue of the
glacier), which will later be important for the analysis
of the results of this research.
The Jungfraujoch station has been active since
1933 and is located at 3571 m above sea level on the
top of the glacier, i.e. in the accumulation area. The
climate temperature average for the period 1991-2020
is from -13.3°C in the coldest month of the year
(February) to 0.6°C in the warmest month (August).
From the annual temperature average monitored until
the 1930s, it is evident that the average annual
temperature is increasing slightly.
Insolation has been increasing since 1980, and
some of the sunniest years occurred after 2000. This
development is less pronounced in areas with higher
altitudes, namely alpine areas.
3.3 Input Data and Methods
All data and software used for the realization of this
research are publicly available and free of charge.
QGIS, version 3.28, with the Semi-Automatic
Classification (SCP) plugin was used as the primary
software for the realization of the work.
3.3.1 Landsat 5 and Sentinel-2 Data
This research is based on the use of images from the
Landsat 5 (launched in 1984) and Sentinel-2
(launched in 2015). The study used only images from
the Landsat 5 satellite system, in order to use data
from the same sensor for the entire time period.
Exceptionally, images from the Sentinel-2 satellite
system (launched in 2015) were used due to better
spatial resolution. The period for which Landsat 5
data is available is 1984-2012, and for Sentinel-2
from 2015 to 2020. Landsat 5 carries the passive
sensors Multi-Spectral Scanner (MSS) and Thematic
Mapper (TM) and orbits at an altitude of
approximately 705 km with a temporal resolution of
16 days. The TM sensor data were used, whose spatial
resolution per multispectral channel is 30 m. Sentinel-
2A and Sentinel-2B (launched in 2017) are equipped
with optical-electronic multispectral sensors (MSI)
that create a set of 13 spectral channels (image): 4
channels with a spatial resolution of 10 m, 6 channels
with a spatial resolution of 20 m and 3 channels with
a spatial resolution of 60 m. Sentinel-2A and
Sentinel-2B provide a temporal resolution of 5 days,
and a radiometric resolution of 12 bits. The images
are available in L1C and L2A processing modes, with
the L2A product being fully atmospherically
corrected, and the images with this level of processing
were used in this work.
For both systems, L2/L2A preprocessing level
images were downloaded in GEOtiff format. Satellite
systems and dates when the images were created:
- Landsat 5 - 18/08/1990, Scene cloud cover: 4%,
- Landsat 5 - 20/08/2000, Scene cloud cover: 11%,
- Landsat 5 - 09/08/2010, Scene cloud cover: 12%
- Sentinel-2 -07/08/2020, Scene cloud cover:
0.5%
GISTAM 2025 - 11th International Conference on Geographical Information Systems Theory, Applications and Management
256
3.3.2 Glamos Data
Glacier Monitoring in Switzerland (GLAMOS) is a
glacier monitoring program in Switzerland that
systematically documents and monitors long-term
changes in glaciers in the Swiss Alps. GLAMOS is
jointly managed by ETH Zurich and the Universities
of Freiburg and Zurich and the CC Cryospheric
Commission. The GLAMOS database contains basic
data and facts on more than 1,400 Swiss glaciers
covering an area of 641 km2, as well as
inventories/databases on changes in glacier length,
mass, volume, etc. The inventories contain
representations of the outer edges, surfaces and debris
covers of all Swiss glaciers.
For the purposes of this work, data on inventories
from 1976 (Glacier Inventory, 1976), 2010 (Glacier
Inventory, 2010) and 2016 (Glacier Inventory, 2016)
and 2022 (GLAMOS, 2022) were downloaded in
order to create a mask. with glacier boundaries for
cutting individual rasters and for accuracy control.
The downloaded data were used in the QGIS software
as a shapefile, and were further processed.
The GLAMOS Glacier Inventory data for the
years 1976, 2010, 2016 and 2022 were downloaded
in a form suitable for processing in QGIS software,
i.e. as shapefiles with associated formats (shp, shx,
qpj, prj, dbf, cpg).
3.3.3 Copernicus DEM
Digital Elevation Model (DEM) used as a basis for
display and analysis of results. The DEM (DEM
GLO-30 Public, 2021) was downloaded from the
Copernicus Global Digital Elevation Model platform
through the OpenTopography portal. The required
area is downloaded in the form of GeoTIFF format
with 30 m spatial resolution. Through the QGIS
software, a hypsometric display with shading and
color scale was created for a realistic display.
3.3.4 Input Data Transformation
The downloaded data had different reference systems
and datums (Table 1). Therefore, it was necessary to
transform all input data into a single project geodetic
datum and coordinate system so that the data could be
combined. GLAMOS databases store data in the
system used in Switzerland and Liechtenstein, while
DEM raster data, as well as satellite images, were
downloaded in global systems. Finally, the EPSG
code 3857 Pseudo Mercator system, which is most
commonly used for applications such as Google
Maps, OpenStreetMap, ArcGIS, ESRI, was chosen
for the research so that the analysis results could be
verified with real images widely available to the
public (Google maps, etc.).
Table 1: Reference systems of input data in research.
Down
loaded
data
GLAM
OS
1976,
2010,
2016
Coper
nicus
DEM
Landsat 5
Sentinel-2
Data
analysis
EPSG
code
2056 4326 32632 3857
CRS CH1903
+
WGS8
4 GPS
WGS 84 /
UTM 32N
WGS 84
Pseudo-
Mercator
Further processing of all raster and vector data
was performed with EPSG code 3857. Due to their
size and the slowness of the processing process, the
satellite images were cropped to the area of interest
using the SCP tool (Clip option), and Landsat 5
images were resampled to Sentinel-2 spatial
resolution. Originally, the Landsat 5 and Sentinel 2
images were in the EPSG 32632 reference system, i.e.
WGS84, UTM zone 32N, and all images were
cropped to a smaller area, where the glacier is visible.
For further mapping and analysis, a glacier mask
was created using the GLAMOS database, with the
assumption that publicly available data is of the
highest accuracy in demarcating individual glaciers
from the Great Aletsch 3b).
3.3.5 Normalized Difference Snow Index
The Normalized Difference Snow Index (NDSI) has
been shown in the literature to be a reliable algorithm
for mapping glaciers due to the fresh snow that covers
most of the surface of each glacier (1). Reflectivity
varies by snow and ice category - freshly fallen snow
has very high reflectivity in the visible and infrared
regions. Firn (granular one-year-old snow) has 25-
30% lower reflectivity than fresh snow, and glacial
ice has high reflectivity in the blue (0.4–0.5 μm) and
green (0.5–0.6 μm) wavelength bands that drop
sharply to almost zero in the red (0.6–0.7 μm) band.
Debris and debris on the glacier surface significantly
reduce reflectivity (Pandey et. al., 2016). This
algorithm is commonly used in snow/ice mapping
applications as well as glacier monitoring. Pixels with
a value greater than 0.0 are considered to contain
snow cover (Riggs et al., 2016).
NDSI is calculated according to the formulas:
N
DSI = (Green-SWIR) / (Green+SWIR) (1)
Remote Sensing-Based Temporal Analysis of Aletsch Glacier Retreat (1990–2020)
257

3.3.6 The Normalized Difference Vegetation
Index
The normalized difference vegetation index (NDVI)
was created in order to later classify the land cover
more easily. NDVI (2) is the most used indicator for
detecting changes in vegetation cover. NDVI is
calculated according to the formulas:
N
DVI = NIR - RED / NIR + RED (2)
3.3.7 Supervised Land Cover Classification
Glacier mapping was conducted through supervised
land cover classification of the broader Great Aletsch
Glacier region. This analysis utilized satellite imagery
from the Landsat 5 system for the years 1990, 2000,
and 2010, as well as Sentinel-2 imagery for 2020.
Supervised classification, a digital image processing
technique, was employed to distinguish land cover
types based on their spectral characteristics. The
primary goal was to produce a thematic land cover
map, specifically isolating the glacier surface from
the surrounding rocky terrain and vegetated areas.
For each analysed year, one set of rasters was
created and a training set of samples for classification
was created. The more "homogeneous" areas of the
image belonging to the same land cover class were
selected, according to the judgment and experience of
the operator. The selection of ROI polygons is
facilitated by the application of the NDSI and NDVI
indices for spotting and extracting snow and
vegetation areas. RGB images created with
combinations of channels 5-4-3 for Landsat 5, and 11-
7-4 for Sentinel 2 were also used. Such combinations
of channels qualitatively distinguish snow from
vegetation and the surrounding rocky area.
Based on the selected samples for 1990, land
cover classification was performed using three
methods: Minimum Distance, Maximum Likelihood
(classical approaches), and Random Forest (a
machine learning method), implemented through the
specialized SCP plugin, for the purpose of examining
the most appropriate method. After multiple attempts,
the Minimum Distance and Maximum Likelihood
methods produced unrealistic results and were
therefore excluded from further analysis.
Random Forest (Hansch, 2025) is a classification
based on machine learning. More samples result in a
longer, but better-quality process because there are
more samples on which it "learns" how to create a
decision. Patterns are created exclusively by
manually drawing polygons for compatibility with
SNAP and SCP tools. Random Forest is a special
machine learning technique based on iterative and
random creation of a decision tree, i.e. a set of rules
and conditions that define a class.
First, the input features are defined, in this case
spectral bands by selecting samples of individual
classes. Random Forest calculates several decision
trees based on the following parameters: (1) number
of training samples: the number of pixels from the
training sample that are randomly used to train the
model; 5000 was chosen according to the instructions
from the SPC, and (2) number of trees: the number of
decision trees; the higher the number of trees, the
higher the accuracy of the model. 100 was chosen.
The separation of trees is defined according to the
principle of the Gini coefficient. A pixel is classified
as, for example, class 1 if the majority of decision
trees evaluated it as class 1.
The causes were selected along the glacier to
represent the entire class of “glaciers”, i.e. different
types of glaciers cover such as fresh snow, granular
snow and glacial ice. The class contains a very wide
range of values because glaciers consist of uneven
deposits of different types of snow, ice, debris i.e.
moraine material and the like. The class of “rocks”
has a uniform, relatively low reflectance across all
spectral channels and is marked with a light brown
colour. The class of “vegetation” has an increased
reflectance around 4.0 µm. The class of “shadows” is
separated because without it the rock and glacier
classes cannot be properly classified.
4 RESULTS AND ANALYSIS
4.1 NDSI and NDVI
The NDSI was calculated for all weather data sets,
and the one for 1990 served as a reference value for
comparisons. By analysing the image, it is possible to
conclude that the higher pixel values (darker colour)
are in the upper, accumulation part of the Great
Aletsch Glacier, which has more precipitation, i.e.
where snow is retained throughout the year. The
lower part of the glacier has lower pixel values
(weaker colour) where the snow cover is thinner 3).
Only values above 0.0 are selected and shown in
the image. Several “lines” running from
Konkordiaplatz along the entire length of the glacier
tongue can also be successfully observed, these are
moraines – accumulations of sediments of
unconsolidated glacial debris, regolith and rocks
(debris), sometimes called glacial till. The moraine is
distinguished by its appearance and remote sensing
methods, but it is an integral part of the glacier.
GISTAM 2025 - 11th International Conference on Geographical Information Systems Theory, Applications and Management
258
By analysing the NDVI for 1990, it can be seen
that in the area of interest, rock, sand and snow are
present to a large extent (values -0.1 - 0.1). Only
surfaces with values higher than 0.4 (low vegetation
such as mountain grasslands) are highlighted on this
display.
4.2 Glacier Mapping
Before analysing the results, only the glacier of
interest, the Great Aletsch, was separated from the
edges of other, surrounding glaciers. In this way, the
analysis focused only on the body of the Great
Aletsch glacier, which was the goal of this research.
All rasters (NDVIs and classification results using the
Random Forest method for each year of observation
1990, 2000, 2010 and 2020) were extracted using the
mask shown in Figure 6b (in QGIS using the
Extraction raster by mask layer option). This resulted
in multiple polygons (glacier area for each observed
year) that were merged into a single multipolygon.
Using Field calculator, a new attribute called Area
(km
2
) was added and the area of the polygon
representing the glacier for each observed year was
calculated using the expression “area($geometry)/
1000000”. For the sake of a more realistic display of
details, smoothing of the outline of the glacier was
done because the outer line of the glacier remained
square by converting the raster into a vector form.
Through the tool Processing Toolbox - QGIS
geoalgorithms - Vector Geometry Tools, Smooth
geometry was created for each layer for the observed
years 1990, 2000, 2010 and 2020.
The final data sets for analysis are represented by
4 vector layers – polygons of the mapped Great
Aletsch Glacier in selected years for each of the
methods used.
4.3 Results Analysis
The analysis involved a comparison of the mapped
glacier area obtained by individual methods, and
verifiable real field information and officially
available data. The analysis of the mapped areas of
the Great Aletsch Glacier obtained by the NDSI
calculation methods (Figure 3) and the Random
Forest classification method (Figure 4) indicates
certain changes in the glacier area in the observed
period, i.e. the retreat of the Great Aletsch Glacier in
selected years was detected and documented.
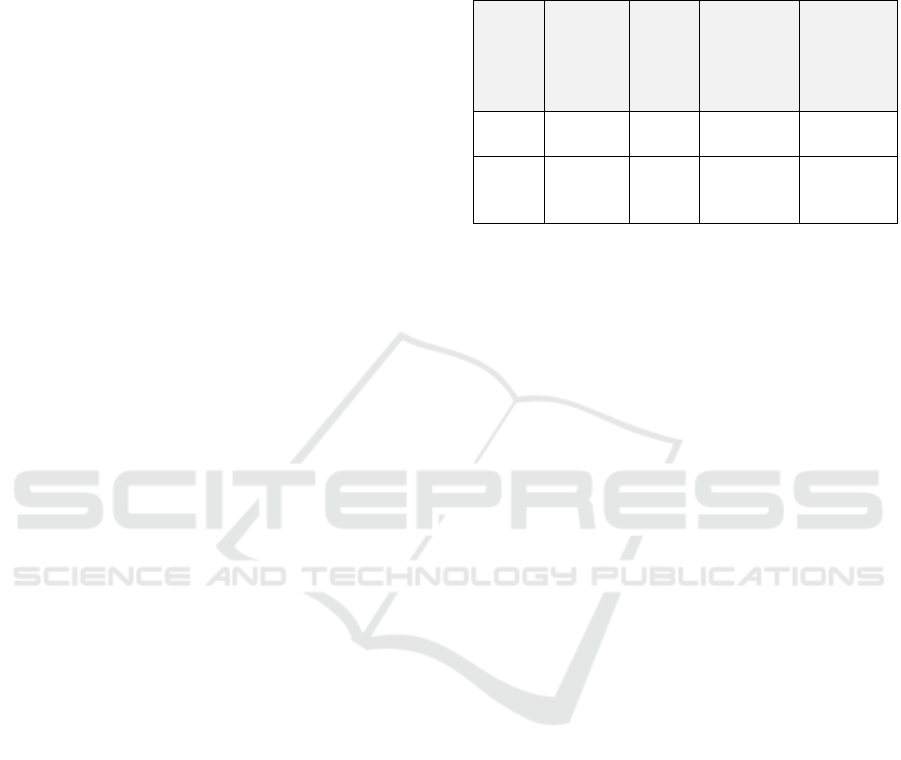
According to the results of the NDSI with a set of
rasters from: 1990, 2000, 2010 and 2020, a regular
glacier retreat is visible, which represents the melting
of glaciers in accordance with climate change. There
is very little change in the accumulation area, while
the pronounced retreat of the glacial mass is most
pronounced in the glacier tongue. This can also be
well monitored in the cuts of the accumulation area
(glacier fans). The glacier surface, especially
pronounced in the glacier tongue, was the largest in
1990 and has been continuously decreasing over the
30-year period (Figure 3). The glacier retreat is most
pronounced longitudinally and in accordance with the
orographic characteristics of the terrain (following
the glacier valley).
Figure 3. A single view of the all NDSI for the years: 1990,
2000, 2010 and 2020 (left). Enlarged parts of the glacier
surface to better see differences by year (right: 'fan' - top
right, 'tongue' - bottom right).
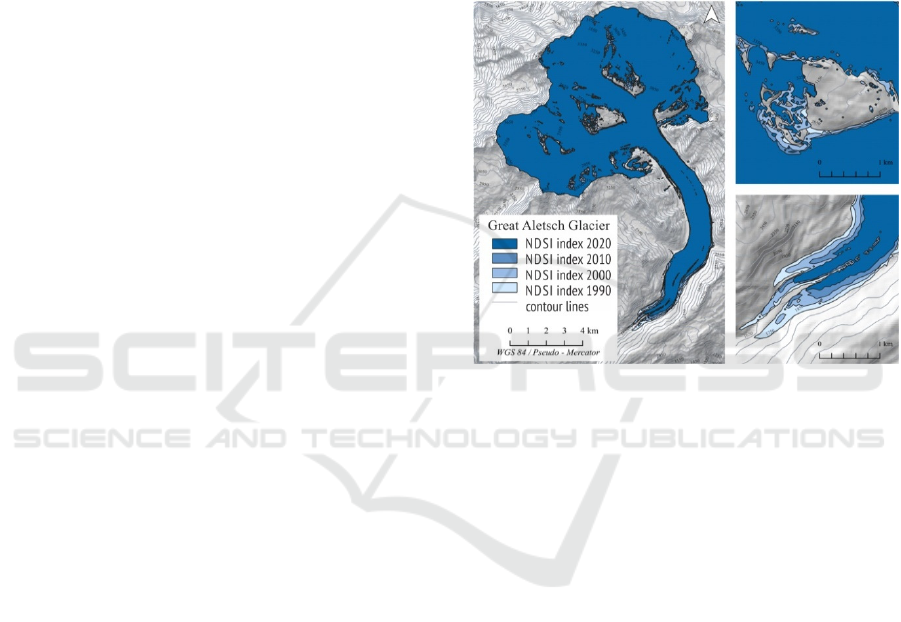
The results of the Random Forest classification
method (Figure 4) show that the areas in all observed
years are smaller and narrower than the glacier areas
obtained by calculating the NDSI. Also, the notches
in the accumulation area of the glacier (fan) are larger
and more pronounced, and the glacier tongue is
visibly narrower. The image details mainly show the
three observed years, while the glacier surface layer
for 1990 barely appears. Namely, the layers are
complex in time/chronology and logic dictates that
the reduction in the glacier area is followed from the
initial observed year when the glacier is largest to the
following years when melting is increased and the
area is smaller.
However, according to the results of the Random
Forest classification, the glacier area for 1990 is
smaller than its area for the following two observed
years. The irregularity may arise due to insufficient
education of the operator performing the
classification, inadequate samples for classification,
spatial resolution of the satellite image and other
technical
reasons. It should also be noted that the
Remote Sensing-Based Temporal Analysis of Aletsch Glacier Retreat (1990–2020)
259
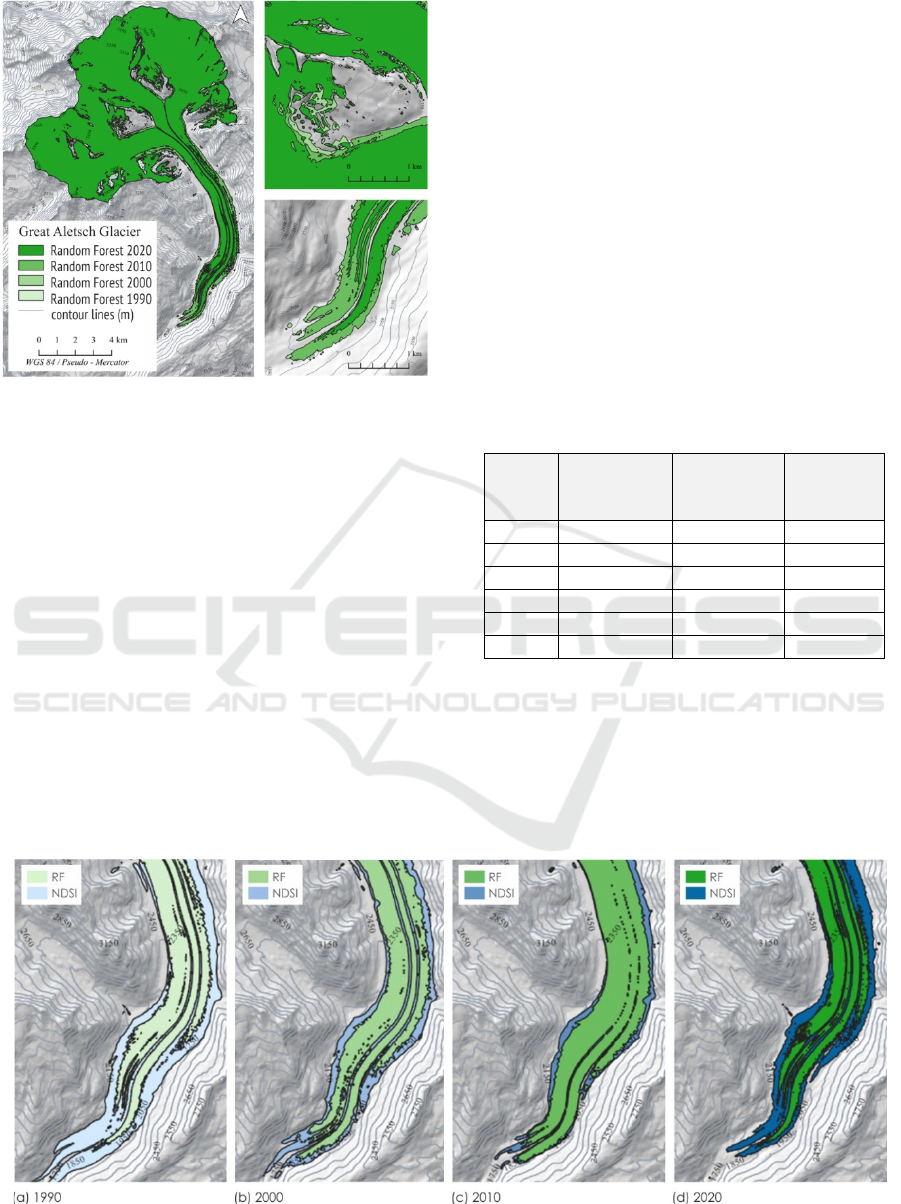
Figure 4. A single view of the all classification results of
Random Forest method for the years: 1990, 2000, 2010 and
2020 (left). Enlarged parts of the glacier surface to better
see differences by year (right: 'fan' - top right, 'tongue' -
bottom right).
classifications for 1990, 2000 and 2010 were carried
out with Landsat 5 images with a spatial resolution of
30 m, and for 2020 with Sentinel-2 images with a
spatial resolution of 10 m. However, this fact did not
affect the calculation of the NDSI.
Still, these irregularities did not affect the spatial
patterns and the glacier retreat was still pronounced
during the observed years in accordance with the
orographic characteristics of the terrain. The retreat
can also be monitored on the cuts of the accumulation
area (fan). By comparing the results of the two
mapping methods, it is possible to see that the
classification according to the Random Forest method
shows much more pronounced glacier moraines with
debris material, i.e. the classification does not
systematize these parts as a glacier class but as a non-
glacial surface, which further glacier retreat in the
observed years. The above reduces the accuracy of
mapping glacier surfaces because the moraine is an
integral part of the glacier, but consists of
accumulations of sediments of unconsolidated glacial
debris, regolith and rocks (debris). Several of the
previously mentioned reasons reduce the accuracy of
the classification method for correctly mapping the
Great Aletsch Glacier and lead to the conclusion that
the Random Forest method is quite subjective and
subject to greater limitations in correctly mapping
glaciers than the NDSI calculation method. The area
of the Great Aletsch Glacier for 2010, according to
the Random Forest classification method, is 76,583
km2, which is a deviation of -1.98% compared to the
official GLAMOS data for the same year (78,131
km
2
, Table 2).
Table 2: Reference systems of input data in research.
Year Area (km2)
NDSI
Area (km2)
Random
Forest
Area
(km2)
GLAMOS
1976 86,628
1990 83.155 73.157
2000 83.583 75.623
2010 81.766 76.583 78,131
2016 78,488
2020 78.801 70.459
A comparison of the implemented glacier
mapping methods showed that, in all observed years,
the glacier area mapped using the NDSI calculation
was significantly larger than that mapped using the
Random Forest classification method (Figure 5, Table
2). The largest difference in glacier areas was also
observed for 1990, in accordance with the
aforementioned irregularity for 1990.
Figure 5. Comparison of the areas of the Great Aletsch Glacier obtained by the NDSI methods (blue tones) and Random
Forest classification (green tones) by survey years (a) 1990, (b), 2000, (c) 2010 and (d) 2020.
GISTAM 2025 - 11th International Conference on Geographical Information Systems Theory, Applications and Management
260

Table 2 lists the areas of the Great Aletsch Glacier
(in km
2
) calculated using the NDSI and Random
Forest classification methods, as well as the areas of
the glaciers from the GLAMOS database for 1976,
2010 and 2016 in order to make the results
comparable since reference in situ information could
not be collected.
Comparison with actual data from the GLAMOS
database for approximately the same period shows
that, in general, the NDSI index method provides
more reliable and consistent data. In all observed
years, the glacier area is larger through the NDSI
index compared to the actual data, although the
reference mapping boundary was selected as the
NDSI value ≥ 0.1 based on viewing satellite images
Timelapse Google Earth Engine. The area of the
Great Aletsch Glacier for 2010 using the NDSI index
method is 81,766 km2, which is a deviation of 4.65%
compared to the official GLAMOS data for the same
year (78,131 km
2
).
The survey did not include the collection of
reference field data; therefore, the reference boundary
of the mapping was determined arbitrarily and a value
of NDSI ≥ 0.1 was selected based on the review of
Google Earth Engine satellite images. The
assumption is that reference data from the field would
contribute to raising the reference limit around NDSI
≥ 0.4, and thus the mapped area of the glacier would
be smaller and more consistent with GLAMOS
official data.
The analysis determined that the mapping of the
Great Aletsch Glacier was more reliable and of higher
quality based on the calculation of NDSI with a
reference value of NDSI ≥ 0.1. Therefore, these
results were linked to the DEM Copernicus GLO-30
digital relief model (30m) to produce a new vector
layer and marked hypsometric elevations showing the
lowest recorded points of the mapped glacier in the
observed years. In 1990, the lowest point of the Great
Aletsch Glacier was at approximately 1637 m above
sea level, in 2000 at approximately 1670 m, in 2010
at 1735 m above sea level, and in 2020 the retreat of
the glacier mass reached 1798 m above sea level
(Figure 6).
5 CONCLUSIONS
The analysis demonstrated that glacier mapping using
the automated calculation of the NDSI index yielded
more accurate and reliable results than the Random
Forest classification method. While both methods
showed some deviations from the GLAMOS
reference data—NDSI slightly overestimating glacier
areas and Random Forest slightly underestimating
them—the
NDSI method produced spatial patterns
Figure 6. The retreat (melting) of the Great Aletsch Glacier
mapped using the NDSI method, with the lowest recorded
elevations.
that were more consistent with the orographic
characteristics of the terrain. This method allowed for
better visualization of glacier retreat, particularly
along the tongue of the glacier and in the
accumulation area, with fewer mapping errors
observed on the surface of the Great Aletsch Glacier.
According to relevant literature, the precise
determination of a reference NDSI threshold can
significantly enhance the accuracy of glacier surface
mapping. In this study, the reference threshold was
set to NDSI ≥ 0.1, informed by literature and
validated using Google Earth Engine Timelapse
imagery. For 2010, the NDSI method estimated the
area of the Great Aletsch Glacier at 81.766 km²,
deviating by 4.65% from the official GLAMOS data
(78.131 km²). Conversely, the Random Forest
method showed a smaller deviation of -1.98% for the
same year. However, visual analysis revealed that the
Random Forest method produced more significant
mapping errors, while the NDSI approach provided
more coherent and reliable results.
The findings suggest that combining these
methods (data fusion) has the potential to further
improve the accuracy of glacier mapping and
monitoring. The NDSI index, in particular, proved to
be a simple yet effective methodology for glacier
mapping, especially when the reference threshold is
verified using reliable in situ data. This study
highlights the utility of using free satellite data and
Remote Sensing-Based Temporal Analysis of Aletsch Glacier Retreat (1990–2020)
261

open-source software for monitoring changes in the
surface area of large glaciers, aligning with the
primary goal of demonstrating the feasibility of
accessible and cost-effective approaches to glacier
monitoring.
REFERENCES
Ashraf, A., Rustam, M., Khan, S.I., Adnan, M., Naz, R,
2016: Chapter 4 Remote Sensing of the Glacial
Environment Influenced by Climate Change,
Environmental Applications of Remote Sensing, edited
by Maged Marghany, 99-129.
Bolch, T., Menounos, B., & Wheate, R. (2010). Landsat-
based inventory of glaciers in western Canada, 1985–
2005. Remote Sensing of Environment, 114(1), 127–
137. doi:10.1016/j.rse.2009.08.015
Burns, P., Nolin, A., 2014: Using atmospherically-
corrected Landsat imagery to measure glacier area
change in the Cordillera Blanca, Peru from 1987 to
2010, Remote Sensing of environment, 140: 165-178.
Chu, X., Yao, X., Duan, H., Chen, C., Li, J., and Pang, W.
2022: Glacier extraction based on high-spatial-
resolution remote-sensing images using a deep-learning
approach with attention mechanism, The Cryosphere,
16, 4273–4289, https://doi.org/10.5194/tc-16-4273-
2022.
D’Agata, C., Bocchiola, D., Soncini, A., Maragno, D.,
Smiraglia, C., & Diolaiuti, G. A. (2018). Recent area
and volume loss of Alpine glaciers in the Adda River of
Italy and their contribution to hydropower production.
Cold Regions Science and Technology, 148, 172–184.
doi:10.1016/j.coldregions.2017.12.010.
Deems, J. S., Painter, T. H., & Finnegan, D. C. (2013).
Lidar measurement of snow depth: a review. Journal of
Glaciology, 59 (215), 467–479. doi:10.3189/
2013jog12j154.
DEM GLO-30 Public - European Space Agency, Sinergise
(2021). Copernicus Global Digital Elevation Model.
Distributed by OpenTopography. Accessed: 2023-05-
25
Dozier, J., 1989: Spectral signature of alpine snow cover
from the Landsat Thematic Mapper. Remote Sensing of
Environment, 28, 9–22.
Frank, P., Winsvold, S.H, Kääb, A., Nagler, T., Schwaizer,
G, 2016, Glacier remote sensing using Sentinel-2. Part
II: Mapping glacier extents and surface facies, and
comparison to Landsat 8, Remote Sensing, 8(7):575
GLAMOS - Glacier Monitoring in Switzerland,
https://www.glamos.ch/en/#/B36-26, (access on
20/01/2025).
GLAMOS 1880-2021, The Swiss Glaciers 1880-22020/21,
Glaciological Reports No 1-142, Yearbooks of the
Cryospheric Commission of the Swiss Academy of
Sciences (SCNAT), published since 1964 by VAW /
ETH Zurich, doi:10.18752/glrep_series
GLAMOS (2022). Swiss Glacier Length Change, release
2022, Glacier Monitoring Switzerland, doi:10.18750/
lengthchange.2022.r2022. (access on 20/01/2025).
Glacier Inventory (1976): Müller, F., Caflisch, T. &
Müller, G. 1976, Firn und Eis der Schweizer Alpen
(Gletscherinventar). Publ. Nr. 57/57a. Geographisches
Institut, ETH Zürich, 2 Vols. & Maisch, M., Wipf, A.,
Denneler, B., Battaglia, J. & Benz, C. 2000, Die
Gletscher der Schweizer Alpen: Gletscherhochstand
1850, Aktuelle Vergletscherung, Gletscherschwund-
Szenarien. (Schlussbericht NFP 31). 2. Auflage. vdf
Hochschulverlag an der ETH Zürich, 373 pp. & Paul,
F. 2004, The new Swiss glacier inventory 2000 –
application of remote sensing and GIS. PhD Thesis,
Department of Geography, University of Zurich,
Schriftenreihe Physische Geographie, 52, 210 pp.
Glacier Inventory (2010): Fischer, M., Huss, M., Barboux,
C. & Hoelzle, M. 2014, The new Swiss Glacier
Inventory SGI2010: relevance of using high-resolution
source data in areas dominated by very small glaciers.
Arctic, Antarctic, and Alpine Research, 46, 933–945.
Glacier Inventory (2016) - Linsbauer, A., Huss, M., Hodel,
E., Bauder, A., Fischer, M., Weidmann, Y., Bärtschi, H.
& Schmassmann, E. 2021, The new Swiss Glacier
Inventory SGI2016: From a topographical to a
glaciological dataset. Frontiers in Earth Science, 22,
doi:10.3389/feart.2021.704189.
Hansch, R. Handbook of Random Forests, Theory and
Applications for Remote Sensing, Series in Computer
Vision: Volume 7, World Scientific Publishing Co Pte
Ltd (30 Nov. 2025)
Hock R., Truffer, M. (2024) Glacier hazards: Will they
change in the future? Arctic, Antarctic, and Alpine
Research, Volume 56, 2024 - Issue 1
Piermattei, L., Zemp, M., Sommer, C., Brun, F., Braun, M.
H., Andreassen, L. M., Belart, J. M. C., Berthier, E.,
Bhattacharya, A., Boehm Vock, L., Bolch, T., Dehecq,
A., Dussaillant, I., Falaschi, D., Florentine, C.,
Floricioiu, D., Ginzler, C., Guillet, G., Hugonnet, R.,
Huss, M., Kääb, A., King, O., Klug, C., Knuth, F.,
Krieger, L., La Frenierre, J., McNabb, R., McNeil, C.,
Prinz, R., Sass, L., Seehaus, T., Shean, D., Treichler,
D., Wendt, A., and Yang, R. (2024) Observing glacier
elevation changes from spaceborne optical and radar
sensors – an inter-comparison experiment using
ASTER and TanDEM-X data, The Cryosphere, 18,
3195–3230, https://doi.org/10.5194/tc-18-3195-2024,
2024.
Keshri, A. K., Shukla, A. and Gupta, R. P. (2009): ASTER
ratio indices for supraglacial terrain mapping',
International Journal of Remote Sensing,30:2,519 —
524
Li, S., Leinss, S., Hajnsek, I. (). Cross-Correlation Stacking
for Robust Offset Tracking Using SAR Image Time-
Series, IEEE Journal of Selected Topics in Applied
Earth Observations and Remote Sensing, Volume: 14,
15 p.
Masek, J.G., Vermote, E.F., Saleous, N., Wolfe, R., Hall,
F.G., Huemmrich, F., Gao, F., Kutler, J., and Lim, T.K.
(2006). A Landsat surface reflectance data set for North
GISTAM 2025 - 11th International Conference on Geographical Information Systems Theory, Applications and Management
262

America, 1990-100, IEEE Geoscience and Remote
Sensing Letters. 3:68-72.
MeteoSwis, 2025, Federal Office of Meteorology and
Climatology, The climate of Switzerland,
https://www.meteoswiss.admin.ch/climate/the-
climate-of-switzerland.html, (access on 20/01/2025).
Meyer J, Deems JS, Bormann KJ, Shean DE and Skiles SM
(2022) Mapping snow depth and volume at the alpine
watershed scale from aerial imagery using Structure
from Motion. Front. Earth Sci. 10:989792. doi:
10.3389/feart.2022.989792
Nie, W., Du, Q., Zhang, X., Wang, K., Liu, Y., Wang, Y.,
Gou, P., Luo, Q., & Zhou, T. (2024). Research on
Glacier Changes and Their Influencing Factors in the
Yigong Zangbo River Basin of the Tibetan Plateau,
China, Based on ICESat-2 Data. Water, 16(18), 2617.
https://doi.org/10.3390/w16182617
Pandey, P., Venkataraman, G., 2012: Climate change effect
on glacier behavior: A case study from the Himalayas,
Earthzine: Climate Consensus.
Pandey, P., Ramanathan, A., Venkataraman, G., 2016:
Chapter 5 - Remote sensing of mountain glaciers and
related hazards, Environmental Applications of Remote
Sensing, edited by Maged Marghany, 131-162
Paul, F., Winsvold, S., Kääb, A., Nagler, T., & Schwaizer,
G. (2016). Glacier Remote Sensing Using Sentinel-2.
Part II: Mapping Glacier Extents and Surface Facies,
and Comparison to Landsat 8. Remote Sensing, 8(7),
575. doi:10.3390/rs8070575
Riggs, G. A., Hall, D. K., and Salomonson, V. V., 2006.
MODIS Snow Products User Guide. http://modis-
snow-ice.gsfc.nasa.gov/sugkc2.html (access on
20/01/2025).
Romanov, P., and Gutman, G., 2000. Automated
monitoring of snow cover over North America with
multispectral satellite data. Journal of Applied
Meteorology, 39, 1866–1880.
Rosenthal, W. and Dozier, J., 1996. Automated mapping of
montane snow cover at subpixel resolution from the
Landsat Thematic Mapper. Water Resources Research,
32(1), 115–130.
Rouse, J.W., Haas, R.H., Schell, J.A. and Deering, D.W.
(1974) Monitoring Vegetation Systems in the Great
Plains with ERTS. Third ERTS-1 Symposium NASA,
NASA SP-351, Washington DC, 309-317.
Shafique, M., Faiz, B., Bacha, A. S., & Ullah, S. (2018).
Evaluating glacier dynamics using temporal remote
sensing images: a case study of Hunza Valley, northern
Pakistan. Environmental Earth Sciences, 77(5).
doi:10.1007/s12665-018-7365-y
UNESCO (2025)- "Swiss Alps Jungfrau-Aletsch".
unesco.org. Paris, France: UNESCO World Heritage
Centre 1992-2016, UN. 13 December 2001.
https://whc.unesco.org/en/list/1037/ (access on
20/01/2025).
Wang, Q.; Yang, Y.; Hu, J.; Zhang, J.; Li, Z.; Wang, Y.
(2025). Temporal and Spatial Assessment of Glacier
Elevation Change in the Kangri Karpo Region Using
ASTER Data from 2000 to 2024. Atmosphere, 16, 110.
https://doi.org/10.3390/atmos16010110
Wen M., Wang, T., (2024) Review of SAR imaging
geodesy for glacier velocity monitoring, Geodesy and
Geodynamics, https://doi.org/10.1016/
j.geog.2024.08.004
Remote Sensing-Based Temporal Analysis of Aletsch Glacier Retreat (1990–2020)
263
