
Quantifying the Effects of Image Degradation on LVLM Benchmark
Results Systematically
Rupert Urbanski
a
and Ralf Peters
b
Institut für Wirtschaftsinformatik und Operations Research, Martin-Luther-Universität Halle-Wittenberg,
Universitätsring 3, 06108 Halle (Saale), Germany
Keywords: Large Language Models, Large Vision Language Models, LLM, LVLM, CV, VQA, OCR, Benchmark, Image
Degradation, Noise, Blurry.
Abstract: Degraded image quality, along with the underlying issues of text-to-text neural networks, can compromise
the performance of LVLMs. This paper quantifies the impacts of blurry, noisy and warped images and
evaluates the robustness of LVLMs towards the common forms of image degradation in real-world
applications utilising a specifically developed benchmark dataset comprising 15840 systematically degraded
text images, which were hand-crafted based on standardised university admission exams.
1 INTRODUCTION
Despite having known limitations such as model
hallucination (Huang et al., 2024), the possibility of
plain repetition of text without having learned
generalisable linguistic abstractions, and still-existing
semantic issues (McCoy, Smolensky, Linzen, Gao, &
Celikyilmaz, 2023; Zhou, Guo, Wang, Chang, & Wu,
2024), text-to-text neural networks are becoming
pervasive in current research and daily life. One
contributing factor to this is the ability of Large
Language Models (LLMs) to generate comparatively
high-quality outputs even when only receiving vague
directions, along with their increasing
generalisability. However, the number of published
prompt engineering papers that propose a wide array
of methods to generate higher-quality outputs with
more repeatability and controllability show that there
is still a high dependence on the inputs.
Many neural networks can be and have been
extended with further encoders to support images or
video as inputs, thus allowing them to perform
various Computer Vision (CV) tasks (Xu et al., 2023)
and integrate them with additional reasoning steps,
such as in Visual Question Answering (VQA) (Wu et
al., 2017), allowing an even more widespread usage.
While this also makes them easier to use, it also
a
https://orcid.org/0009-0000-1512-6392
b
https://orcid.org/0009-0007-9168-0126
makes known CV challenges resurface in the context
of already large model architectures that require
increasingly complex benchmarking to establish and
gauge their capabilities (OpenAI, 2023; Xu et al.,
2023).
These underlying issues also accumulate with the
challenges of daily usage, such as users not providing
ideal image data, e.g. when using phone cameras to
quickly ask about an issue that they want a model to
explain. This leads to the potential for the output
quality of Large Vision Language Models (LVLM) to
vary even more than that of plain text-to-text models.
This paper addresses this problem by quantifying
the impact of image quality by systematically
degrading benchmark data. It provides insight into
possible pre-processing steps to consider and which
to prioritise when developing an integrated system.
This is done for Optical Character Recognition
(OCR) and another more integrated real-world
application, answering exam questions, including
Arithmetic Reasoning and Sentence Completion in
both single-choice (SCQ) and free response question
format (FRQ). Displaying the variance in results due
to image degradation in a more integrated real-world
application in relation to the impacts on OCR also
further underlines the importance of quality input data
and aiming to improve it.
Urbanski, R., Peters and R.
Quantifying the Effects of Image Degradation on LVLM Benchmark Results Systematically.
DOI: 10.5220/0013462800003967
In Proceedings of the 14th International Conference on Data Science, Technology and Applications (DATA 2025), pages 355-362
ISBN: 978-989-758-758-0; ISSN: 2184-285X
Copyright © 2025 by Paper published under CC license (CC BY-NC-ND 4.0)
355

This approach differs from previous research in
multiple key points: exam questions with more
reasoning are contained in image, which causes a
higher reliance on OCR, and it systematically
addresses degradation in opposition to naturally
distorted images. Furthermore, this paper aims to give
quantitative insights into to the intuitive statement of
image quality influencing the results of tasks which
involve vision and differentiates between different
forms of degraded image quality.
The further article is structured as follows:
Section 2 establishes related work. Section 3
describes the base dataset and further processing of
the dataset. Section 4 describes the conducted
evaluation, including the applied metrics and results.
2 RELATED WORK
Benchmarking LLMs has been surveyed previously
and can be categorised by various criteria. Among
these is Question Answering (QA), which addresses
an issue close to the modelled real-world application
of this paper (Chang et al., 2023; Guo et al., 2023).
These, however, do not primarily address
LVLMs. Known tasks for LVLMs also include
traditional CV tasks such as OCR (Liu et al., 2023;
Yang et al., 2024), which is also a topic of this paper,
as well as more integrated tasks with reasoning steps
such as VQA (Mishra, Shekhar, Singh, &
Chakraborty, 2019). VQA datasets are also part of a
proposed benchmark suite for LVLMs that includes
other related problems (Xu et al., 2023), which,
however, are only more dissimilar to the task
addressed in this paper.
VQA also differs in that the images typically do
not include the question itself; rather, a question about
the image contents is asked at runtime (Wu et al.,
2017). VQA also mostly does not use as much
reasoning as is expected in real-world usage.
ChartQA (Masry, Long, Tan, Joty, & Hoque, 2022)
and MathVista (Lu et al., 2023) make use of these
capabilities by prompting the models to answer
questions about charts and calculate further results.
This is also related to the field of Arithmetic
Reasoning, which is being explored for text-to-text
models and is based on math word problems, mostly
at grade school level, (Cobbe et al., 2021; Roy &
Roth, 2016; Shen et al., 2021) or proofing theorems
(Hendrycks et al., 2021).
Since these tasks are not representative of the
whole knowledge base of L(V)LMs, standardised
exams have been established as a measurement.
OpenAI displays the performance of their GPT-4
models using university entrance exams in pre-
processed text form with supplemental images for
tasks that include figures (OpenAI, 2023).
The aforementioned papers do not address or
focus on noisy or otherwise degraded input data. The
dependence on text image quality for OCR is a known
issue (Hartley & Crumpton, 1999), which has been
extensively addressed in previous datasets as the topic
emerged (Guyon, Haralick, Hull, & Phillips, 2000),
as well as in the context of more modern approaches
to OCR and text restoration.
These papers predominantly feature scan issues
or high-quality pictures of media with other degraded
features, such as handwriting (Poddar, Chakraborty,
Mukhopadhyay, & Biswas, 2021) or bad lettering
(Hegghammer, 2022).
Modelling degraded document images for OCR
has been discussed in literature (Baird, 2007).
Multiple possible parameters, such as noise,
resolution, rotation, and blur, have been mentioned in
this context.
Further related issues are Scene Text Detection
and Recognition (STDR). This involves finding,
cropping and extracting text from text areas in
everyday scenarios, like cityscapes and billboards
(Baek et al., 2019; Jaderberg et al., 2016; Jaderberg,
Vedaldi, & Zisserman, 2014; Risnumawan et al.,
2014). Datasets typically only include short text
snippets in natural (Chng & Chan, 2017; Karatzas et
al., 2013), partially (Gupta, Vedaldi, & Zisserman,
2016) or fully synthesised images (Jaderberg,
Simonyan, Vedaldi, & Zisserman, 2014).
This research area also intersects with VQA,
forming Scene Text Visual Question Answering (ST-
VQA) (Biten et al., 2019).
Although related, these papers only partially
address the capabilities of LVLMs and involve
limited reasoning. They do, however, provide insight
into common degraded features in image text data,
albeit being not explicitly modelled or systematically
addressed but naturally occurring and thus harder to
quantify. These are perspective-transformed and
blurry text and low-resolution or noisy images,
especially those taken in less-than-optimal lighting
conditions.
3 DATASET
A dataset based on standardised university entrance
exams was developed to quantify the impact of image
degradation and the robustness of LVLMs regarding
OCR and evaluate the influence of lower image
quality on reasoning.
DATA 2025 - 14th International Conference on Data Science, Technology and Applications
356
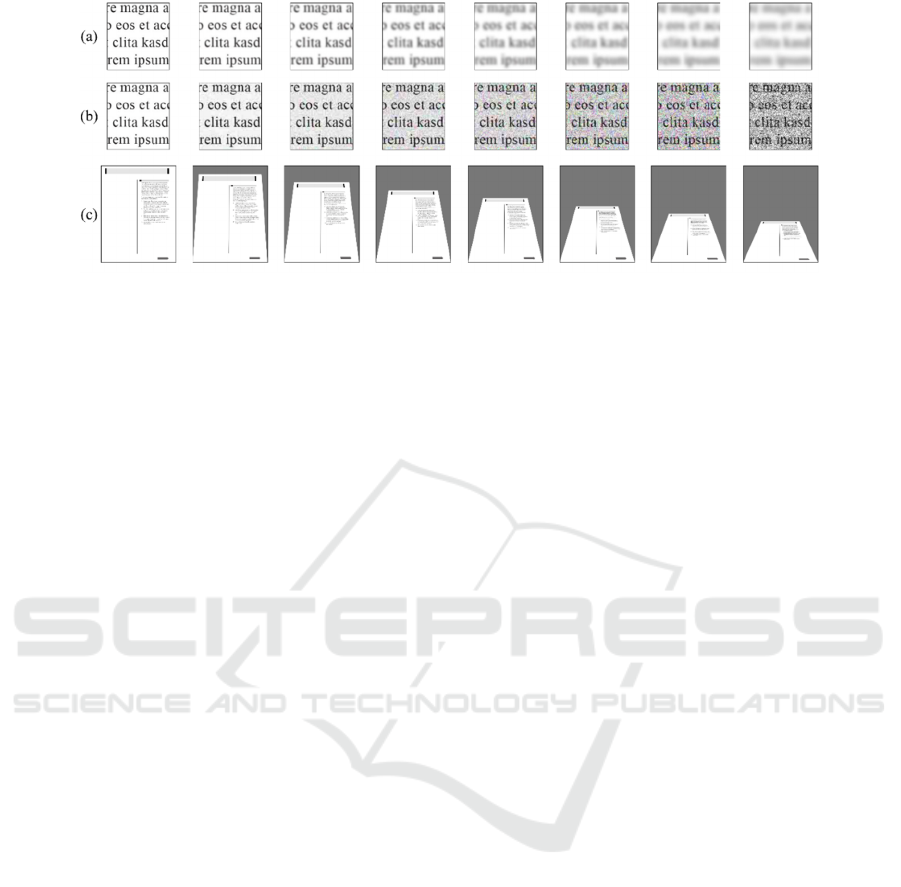
Figure 1: Degrees of applied forms of image degradation.
The base benchmarking data with no degradation
stems from a previous paper by the authors, which
hinted at this issue and received positive feedback but
also called for a more in-depth analysis of the issue at
hand (Urbanski & Peters, 2025).
Having a consistent font, page context, and a
limited number of features like tables and plots
isolates the issue of image degradation from other
possible factors.
It also provides an example of a real-world
application, by quickly asking for answers or
explanations of a given task without separate further
instructions. This also involves reasoning by the
model and tests part of the knowledge base that
conventional OCR models lack.
3.1 Base Dataset
The base dataset from a previous paper (Urbanski &
Peters, 2025) includes 720 hand-crafted tasks derived
from the most recent publicly available SAT exams.
This puts it in context with prior benchmarks based
on exam questions (Cobbe et al., 2021; OpenAI,
2023; Shen et al., 2021).
Each image only contains one isolated exercise in
a page context to ensure the models respond
according to the expected task.
These images have a size of 2550 pixels in width
and 3300 pixels in height, thus having 300 dpi in US
letter size.
The set comprises 396 reading comprehension
tasks in SCQ format with four possible lettered
options, 240 math problems in the same format, and
84 math problems in FRQ format. 107 tasks contain
tables or figures.
3.2 Degradation of Dataset Images
Three common degradations in natural images were
observed. Seven levels, each of blur, perspective
transformation, and noise, along with reduced
brightness, were used to degrade the image quality
accordingly to model similar image qualities to the
found natural ones, assuming no degradation as the
minimum and the maximum as the highest matching
amount found in the ST-VQA dataset (Biten et al.,
2019). Each level of degradation is visualised in
Figure 1.
Gaussian Blur (a) has been applied to assign
pixels a new value based on the surrounding pixels in
radii in increments of one pixel, between 1 and 7
pixels. At this point, the text becomes practically
illegible to the human eye, assuming a resolution of
300 dpi.
Adding Gaussian noise and decreasing image
brightness (b) were applied simultaneously to
emulate the noise introduced through signal
amplifications that can be perceived in pictures taken
in low lighting conditions.
The perspective transformations (c) can be
imagined as rotations around the respective axis at the
edges of the images so that the opposite edge is
perceived as further away. This has been applied in
increments of nine degrees.
These degradations were applied to all tasks
separately to individually determine impacts and
thresholds, netting 15840 images in the final dataset.
4 EVALUATION
Based on prior research (Urbanski & Peters, 2025),
three models performing well in their respective
domains were evaluated. These include Google’s
Gemini 1.5 Pro-002 (Georgiev et al., 2024), a
commercial cloud model, which outperformed
OpenAI’s GPT-4o (OpenAI, 2023) in the
aforementioned paper (Urbanski & Peters, 2025),
Meta’s Llama 3.2 Vision with 7 billion parameters
and tuned with an instruction dataset (Meta, 2024)
Quantifying the Effects of Image Degradation on LVLM Benchmark Results Systematically
357
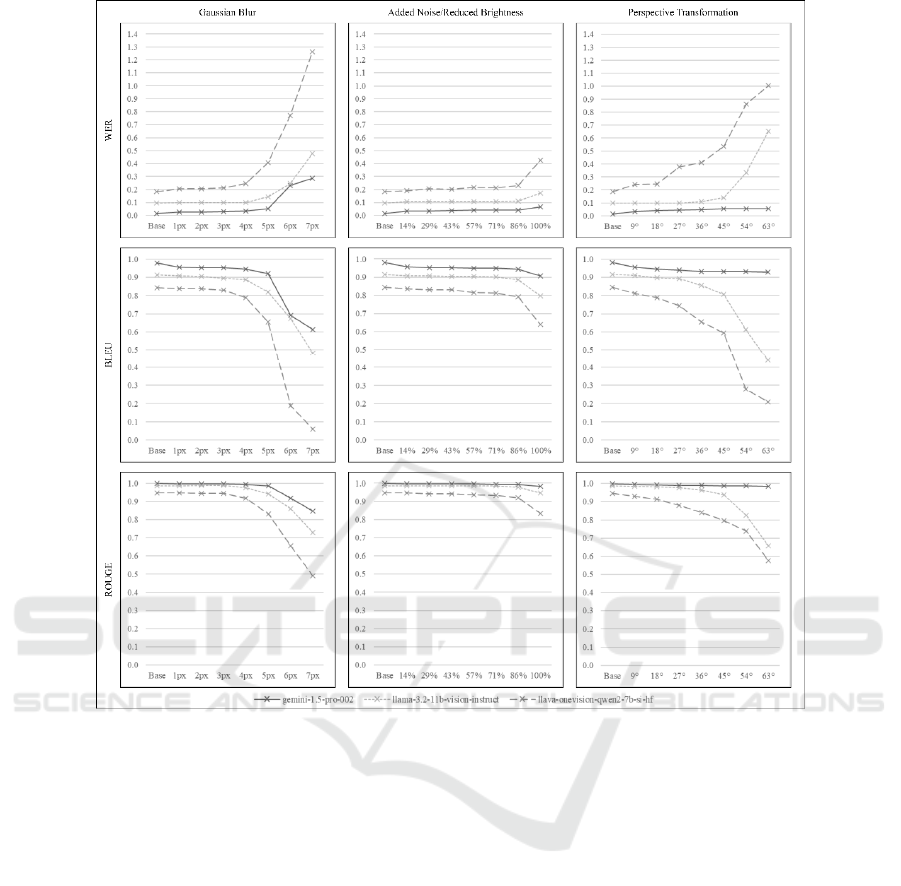
Figure 2: Plotted WER, BLEU and ROUGE values (higher is better).
which performed the best out of the previously tested
locally hosted models on the base dataset but is not
openly available in Europe, and a version of a LLaVa-
OneVision model, which uses Qwen2 as a base LLM,
with 7 billion parameters (Li et al., 2024), which was
the next best performing openly available model.
Prompting for exercise text and the answers to
these questions has been done separately. The former
is referred to as OCR, and the latter as VQA.
All models have been prompted for OCR using
the same Zero-Shot prompt at a temperature of 1, top-
p of 0.95, top-k of 40, and a maximum of 8192 output
tokens, standard values for most models. The prompt
includes instructions to respond only with exercise
text without paraphrasing the contents.
All models were prompted for VQA answers
using the same Zero-Shot-Chain-of-Thought prompt
at the same temperature of 1, top-p of 0.95, top-k of
40, and a maximum of 8192 output tokens.
Zero-shot-prompting has been selected to
maintain the real-life scenario of asking the model a
spontaneous question. The only applied optimisation
for VQA is using Zero-Shot-Chain-of-Thought-
Prompting explicitly across all models, which only
adapts the prompt slightly and has been proven
effective for improving performance on Arithmetic
Reasoning benchmarks (Kojima, Gu, Reid, Matsuo,
& Iwasawa, 2022).
4.1 Scoring of OCR Results
Although the OCR prompts instructed the models to
omit anything besides the exercise text, the answers
occasionally included supplemental text before or
after the exercise text. Since these contents are
unrelated to model performance and later VQA
results but impact the calculated metrics, they were
removed before the various scoring metrics were
calculated.
For base evaluation, the standard OCR metrics
Word Error Rate (WER) and Character Error Rate
(CER) were calculated. These metrics account for
DATA 2025 - 14th International Conference on Data Science, Technology and Applications
358
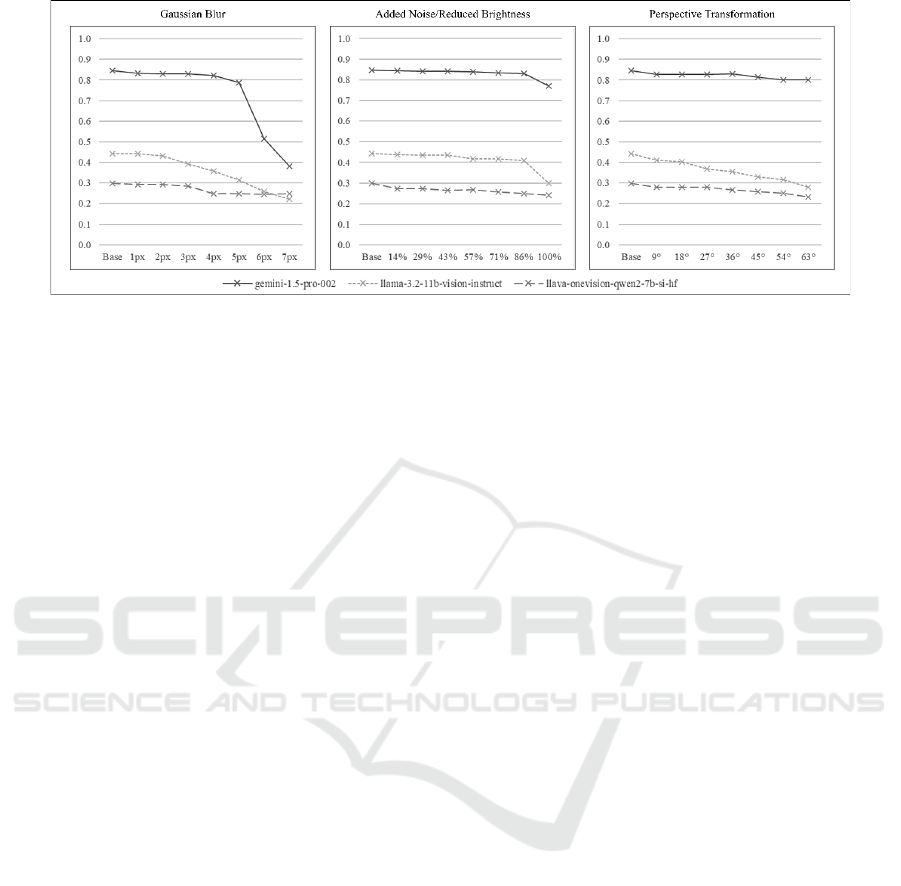
Figure 3: Plotted VQA accuracies (higher is better).
substitutions, insertions, and deletions of words or
characters, respectively (Neudecker et al., 2021).
Since it was observed that models still
paraphrased their answers despite opposite
instructions, the results were evaluated using further
similarity metrics. This also helps contextualise the
following VQA results since paraphrasing might not
impact this task. The standard metrics BLEU
(Papineni, Roukos, Ward, & Zhu, 2001) and ROUGE
(Lin, 2004) were chosen for this second evaluation
(Kocmi et al., 2021; Lee et al., 2023). BLEU has also
been used to evaluate model performance in
translating mathematic formulae (Petersen, Schubotz,
Greiner-Petter, & Gipp, 2023).
These results are shown in Figures 2, with the
exclusion of CER as no significant differences to
WER are observable.
Removing tasks with images or tables had no
significant impact on any calculated metric.
4.2 Scoring of VQA Results
The models' final answers to the given tasks were
compared to the actual task solution. SCQ where the
models gave the correct answer but did not respond
with one of the letters of the lettered responses were
still counted as correct.
Approximate decimal solutions to questions
where a common fraction is to be expected, and vice
versa, were also counted as correct. Decimal solutions
were rounded to one decimal point for comparison.
The results are shown in Figure 3. Since the
models performed similarly on all task groups of the
dataset, only aggregated forms for each model and
form of degradation are shown.
Removal of tasks with images or tables did not
significantly impact the observed accuracies.
4.3 Discussion
All the tested models proved some robustness against
low levels of image degradation for both OCR and
VQA. However, performance differences between
the models are still clearly visible for both tasks.
The baseline performance of the tested smaller
locally hosted models is significantly worse than that
of the tested larger cloud model, and both also show
significantly decreased performance when pictures
are warped through perspective, especially in OCR.
All higher levels of the tested forms of
degradation have significant impact on the error rates,
which increase more steeply near the tested maximum
amount of each form of image degradation but
generally have sudden changes within the boundaries.
The OCR performance of Gemini 1.5 Pro-002
was significantly less impacted than that of the two
locally hosted models. However, all models appear
more robust to noisy and darker images than other
forms of image degradation within the tested
boundaries.
Since the CER values are only slightly lower than
WER values and change similarly to each other
across all collected data, it can be assumed that the
tested models do not recognise single characters
wrongly but whole words.
The LLaVa-OneVision/Qwen2 model showed an
average WER above 1.0 for the highest image
degradation levels through blur and perspective
transformation. This means that in both cases, the
response sets contained an average of one wrong
word per word of the reference set. Although this is a
high error rate, this does not mean that every word
was recognised wrongly since inserted words are also
considered.
BLEU and ROUGE display similar trends to CER
and WER, highlighting the more significant OCR
issues with increasing degradation. However, the
Quantifying the Effects of Image Degradation on LVLM Benchmark Results Systematically
359

changes in ROUGE scores display a more gradual
increase in steepness. In contrast, BLEU shows
sudden drops towards the 6
th
level of each
degradation form and flattening off towards the 7
th
,
matching the changes in the error rates.
All forms of image degradation also negatively
impacted VQA model performance.
Llama 3.2 Vision outperformed the LLaVa-
OneVision/Qwen2 model except at the highest tested
level of image degradation through blur, where both
model accuracies are lower than the expected value
for random guessing the SC task answers. Both
performed significantly worse than the cloud model.
Gemini 1.5 Pro-002 also showed higher
robustness for VQA. Only higher levels of blur
lowered the model's accuracy significantly. Even at
the highest tested level of blur, it still performed on
par with the locally hosted models without blur.
While the changes in VQA accuracy correlate to
the metrics for the OCR data, no generalised
statements about proportionality can be made,
especially across models.
Whereas CER, WER, and BLEU already show
significant performance differences for the base data,
the initial ROUGE values are closer across the
models, which does not match the VQA performance.
However, the deltas of the calculated ROUGE values
appear close to proportional to the deltas in VQA
accuracy in opposition to those of any of the other
calculated metrics.
5 CONCLUSIONS
The results of the former analysis show that different
forms of image degradation also contribute
differently to the performance of LVLMs on both
analysed tasks.
Since the performance of the locally hosted
models on VQA is generally worse, even for the base
dataset, the OCR performance is not ensured to be the
main factor. However, the impact of image quality
and different forms of degradation was shown
through the accuracy from the VQA task as well as
the metrics used for OCR.
The analysis also provides quantitative insight
into the intuitive assumption that LVLMs depend on
image quality.
It shows that different models have different
degrees of robustness towards these analysed forms
of image degradation, that high levels of image
degradation need to be addressed, regardless of which
form, and that some models perform well even when
given very degraded image data.
It also shows critical thresholds at which the
performance of the tested models marginally
deteriorates for both OCR and VQA.
Evaluating further vision-based tasks with
varying degrees of reliance on OCR could be useful
in this context e.g. in determining the actual
significance of OCR performance.
Another approach to the issue addressed in this
paper is utilising multivariate statistics to calculate
feature importance when multiple forms of image
degradation occur in combination.
This approach was dismissed for the developed
dataset, which prioritised showing representative
diversity in tasks to ensure that the results are limited
to one domain. Randomly applying multiple forms of
image degradation in varying degrees to each task led
to inconclusive results because of the factor of
different task difficulty based on the question. This is
not an issue for the dataset utilised in this paper since
every task had every examined degree of image
degradation applied to it.
Further evaluations might also address multiple
simultaneously occurring forms of image degradation
or utilise Image Restoration techniques or other
preprocessing steps to gauge their viability.
REFERENCES
Baek, J., Kim, G., Lee, J [Junyeop], Park, S., Han, D., Yun,
S., Oh, S. J., & Lee, H [Hwalsuk] (2019). What Is
Wrong With Scene Text Recognition Model
Comparisons? Dataset and Model Analysis. In 2019
IEEE/CVF International Conference on Computer
Vision (ICCV) (pp. 4714–4722). IEEE. https://doi.org/
10.1109/ICCV.2019.00481
Baird, H. S. (2007). The State of the Art of Document
Image Degradation Modelling. In S. Singh & B. B.
Chaudhuri (Eds.), Advances in Pattern Recognition.
Digital document processing: major directions and
recent advances (pp. 261–279). Scholars Portal.
https://doi.org/10.1007/978-1-84628-726-8_12
Biten, A. F., Tito, R., Mafla, A., Gomez, L., Rusiñol, M.,
Valveny, E., Jawahar, C. V., & Karatzas, D. (2019).
Scene Text Visual Question Answering. http://arxiv.org/
pdf/1905.13648
Chang, Y [Yupeng], Wang, X [Xu], Wang, J., Wu, Y
[Yuan], Yang, L., Zhu, K., Chen, H [Hao], Yi, X.,
Wang, C., Wang, Y [Yidong], Ye, W., Zhang, Y [Yue],
Chang, Y [Yi], Yu, P. S., Yang, Q., & Xie, X. (2023).
A Survey on Evaluation of Large Language Models.
http://arxiv.org/pdf/2307.03109
Chng, C. K., & Chan, C. S. (2017). Total-Text: A
Comprehensive Dataset for Scene Text Detection and
Recognition. http://arxiv.org/pdf/1710.10400
Cobbe, K., Kosaraju, V., Bavarian, M., Chen, M [Mark],
Jun, H., Kaiser, L., Plappert, M., Tworek, J., Hilton, J.,
DATA 2025 - 14th International Conference on Data Science, Technology and Applications
360

Nakano, R., Hesse, C., & Schulman, J. (2021). Training
Verifiers to Solve Math Word Problems.
http://arxiv.org/pdf/2110.14168.pdf
Georgiev, P., Lei, V. I., Burnell, R., Bai, L., Gulati, A.,
Tanzer, G., Vincent, D., Pan, Z., Wang, S., Mariooryad,
S., Ding, Y., Geng, X., Alcober, F., Frostig, R.,
Omernick, M., Walker, L., Paduraru, C., Sorokin, C.,
Tacchetti, A., Vinyals, O. (2024). Gemini 1.5:
Unlocking multimodal understanding across millions of
tokens of context. http://arxiv.org/pdf/2403.05530
Guo, Z., Jin, R., Liu, C [Chuang], Huang, Y., Shi, D.,
Supryadi, Yu, L [Linhao], Liu, Y [Yan], Li, J [Jiaxuan],
Xiong, B., & Xiong, D. (2023). Evaluating Large
Language Models: A Comprehensive Survey.
http://arxiv.org/pdf/2310.19736
Gupta, A., Vedaldi, A., & Zisserman, A. (2016). Synthetic
Data for Text Localisation in Natural Images.
http://arxiv.org/pdf/1604.06646
Guyon, I., Haralick, R. M., Hull, J. J., & Phillips, I. T.
(2000). Data sets for OCR and Document Image
Understanding Research. In H. Bunke (Ed.), Handbook
of character recognition and document image analysis
(1. publ., repr, pp. 779–799). World Scientific.
https://doi.org/10.1142/9789812830968_0030
Hartley, R. T., & Crumpton, K. (1999). Quality of OCR for
Degraded Text Images. http://arxiv.org/pdf/cs/9902009
Hegghammer, T. (2022). Ocr with Tesseract, Amazon
Textract, and Google Document AI: A benchmarking
experiment. Journal of Computational Social Science,
5(1), 861–882. https://doi.org/10.1007/s42001-021-
00149-1
Hendrycks, D., Burns, C., Kadavath, S., Arora, A., Basart,
S., Tang, E., Song, D., & Steinhardt, J. (2021).
Measuring Mathematical Problem Solving With the
MATH Dataset. http://arxiv.org/pdf/2103.03874.pdf
Huang, L., Yu, W [Weijiang], Ma, W., Zhong, W., Feng, Z.,
Wang, H., Chen, Q., Peng, W., Feng, X., Qin, B., & Liu,
T [Ting] (2024). A Survey on Hallucination in Large
Language Models: Principles, Taxonomy, Challenges,
and Open Questions. ACM Transactions on
Information Systems, Article 3703155. Advance online
publication. https://doi.org/10.1145/3703155
Jaderberg, M., Simonyan, K., Vedaldi, A., & Zisserman, A.
(2014). Synthetic Data and Artificial Neural Networks
for Natural Scene Text Recognition. http://arxiv.org/
pdf/1406.2227
Jaderberg, M., Simonyan, K., Vedaldi, A., & Zisserman, A.
(2016). Reading Text in the Wild with Convolutional
Neural Networks. International Journal of Computer
Vision, 116(1), 1–20. https://doi.org/10.1007/s11263-
015-0823-z
Jaderberg, M., Vedaldi, A., & Zisserman, A. (2014). Deep
Features for Text Spotting. In (pp. 512–528). Springer,
Cham. https://doi.org/10.1007/978-3-319-10593-2_34
Karatzas, D., Shafait, F., Uchida, S., Iwamura, M., Bigorda,
L. G. i., Mestre, S. R., Mas, J., Mota, D. F., Almazan, J.
A., & las Heras, L. P. de (2013). ICDAR 2013 Robust
Reading Competition. In 2013 12
th
International
Conference on Document Analysis and Recognition (pp.
1484–1493). IEEE. https://doi.org/10.1109/ICDAR.20
13.221
Kocmi, T., Federmann, C., Grundkiewicz, R., Junczys-
Dowmunt, M., Matsushita, H., & Menezes, A. (2021).
To Ship or Not to Ship: An Extensive Evaluation of
Automatic Metrics for Machine Translation.
Proceedings of the Sixth Conference on Machine
Translation, 478–494. https://aclanthology.org/2021.
wmt-1.57/
Kojima, T., Gu, S. S., Reid, M., Matsuo, Y., & Iwasawa, Y.
(2022). Large Language Models are Zero-Shot
Reasoners. http://arxiv.org/pdf/2205.11916
Lee, S [Seungjun], Lee, J [Jungseob], Moon, H., Park, C.,
Seo, J., Eo, S., Koo, S., & Lim, H [Heuiseok] (2023). A
Survey on Evaluation Metrics for Machine Translation.
Mathematics, 11(4), 1006. https://doi.org/10.3390/
math11041006
Lin, C.‑Y. (2004). ROUGE: A Package for Automatic
Evaluation of Summaries. Text Summarization
Branches Out, 74–81. https://aclanthology.org/W04-
1013/
Liu, Y [Yuliang], Li, Z [Zhang], Huang, M., Yang, B., Yu,
W [Wenwen], Li, C [Chunyuan], Yin, X., Liu, C
[Cheng-lin], Jin, L., & Bai, X. (2023). OCRBench: On
the Hidden Mystery of OCR in Large Multimodal
Models. http://arxiv.org/pdf/2305.07895
Lu, P., Bansal, H., Xia, T., Liu, J [Jiacheng], Li, C
[Chunyuan], Hajishirzi, H., Cheng, H., Chang, K.‑W.,
Galley, M., & Gao, J. (2023). MathVista: Evaluating
Mathematical Reasoning of Foundation Models in
Visual Contexts. http://arxiv.org/pdf/2310.02255
Masry, A., Long, D., Tan, J. Q., Joty, S., & Hoque, E.
(2022). ChartQA: A Benchmark for Question
Answering about Charts with Visual and Logical
Reasoning. Findings of the Association for
Computational Linguistics: ACL 2022, 2263–2279.
https://doi.org/10.18653/v1/2022.findings-acl.177
McCoy, R. T., Smolensky, P., Linzen, T., Gao, J., &
Celikyilmaz, A. (2023). How Much Do Language
Models Copy From Their Training Data? Evaluating
Linguistic Novelty in Text Generation Using RAVEN.
Transactions of the Association for Computational
Linguistics, 11, 652–670. https://doi.org/10.1162/ta
cl_a_00567
Meta. (2024). Llama 3.2. https://www.llama.com/
Mishra, A., Shekhar, S., Singh, A. K., & Chakraborty, A
[Anirban] (2019). OCR-VQA: Visual Question
Answering by Reading Text in Images. In 2019
International Conference on Document Analysis and
Recognition (ICDAR) (pp. 947–952). IEEE.
https://doi.org/10.1109/ICDAR.2019.00156
Neudecker, C., Baierer, K., Gerber, M., Clausner, C.,
Antonacopoulos, A., & Pletschacher, S. (2021). A
survey of OCR evaluation tools and metrics. In The 6
th
International Workshop on Historical Document
Imaging and Processing (pp. 13–18). ACM.
https://doi.org/10.1145/3476887.3476888
OpenAI. (2023). GPT-4 Technical Report. http://arxiv.org/
pdf/2303.08774.pdf
Quantifying the Effects of Image Degradation on LVLM Benchmark Results Systematically
361

Papineni, K., Roukos, S., Ward, T., & Zhu, W.‑J. (2001).
BLEU. In P. Isabelle (Ed.), Proceedings of the 40
th
Annual Meeting on Association for Computational
Linguistics - ACL ‘02 (p. 311). Association for
Computational Linguistics. https://doi.org/10.3115/
1073083.1073135
Petersen, F., Schubotz, M., Greiner-Petter, A., & Gipp, B.
(2023). Neural Machine Translation for Mathematical
Formulae. In A. Rogers, J. Boyd-Graber, & N. Okazaki
(Eds.), Proceedings of the 61
st
Annual Meeting of the
Association for Computational Linguistics (Volume 1:
Long Papers) (pp. 11534–11550). Association for
Computational Linguistics. https://doi.org/10.18653/
v1/2023.acl-long.645
Poddar, A., Chakraborty, A [Akash], Mukhopadhyay, J., &
Biswas, P. K. (2021). TexRGAN. In R. Chellappa, S.
Chaudhury, C. Arora, P. Chaudhuri, & S. Maji (Eds.),
Proceedings of the Twelfth Indian Conference on
Computer Vision, Graphics and Image Processing (pp.
1–9). ACM. https://doi.org/10.1145/3490035.3490306
Risnumawan, A., Shivakumara, P., Chan, C. S., & Tan, C.
L. (2014). A robust arbitrary text detection system for
natural scene images. Expert Systems with Applications,
41(18), 8027–8048. https://doi.org/10.1016/j.eswa.20
14.07.008
Roy, S., & Roth, D. (2016). Solving General Arithmetic
Word Problems. http://arxiv.org/pdf/1608.01413
Shen, J., Yin, Y., Li, L [Lin], Shang, L., Jiang, X., Zhang,
M., & Liu, Q. (2021). Generate & Rank: A Multi-task
Framework for Math Word Problems. In M.-F. Moens,
X. Huang, L. Specia, & S. W. Yih (Eds.), Findings of
the Association for Computational Linguistics: EMNLP
2021 (pp. 2269–2279). Association for Computational
Linguistics. https://doi.org/10.18653/v1/2021.findings-
emnlp.195
Urbanski, R., & Peters, R. (2025). L(V)LMs Compromising
the Integrity of in-Person Exams: An Evaluation
Utilizing Smart Glasses and Computer Vision. In
Proceedings of the 17
th
International Conference on
Computer Supported Education - Volume 2 (pp. 43–50).
Wu, Q., Teney, D., Wang, P [Peng], Shen, C., Dick, A., &
van den Hengel, A. (2017). Visual question answering:
A survey of methods and datasets. Computer Vision and
Image Understanding, 163, 21–40. https://doi.org/
10.1016/j.cviu.2017.05.001
Xu, P., Shao, W., Zhang, K., Gao, P., Liu, S., Lei, M., Meng,
F., Huang, S., Qiao, Y., & Luo, P. (2023). LVLM-eHub:
A Comprehensive Evaluation Benchmark for Large
Vision-Language Models. http://arxiv.org/pdf/2306.09
265
Yang, Z [Zhibo], Tang, J., Li, Z [Zhaohai], Wang, P
[Pengfei], Wan, J., Zhong, H., Liu, X., Yang, M., Wang,
P [Peng], Bai, S., Jin, L., & Lin, J. (2024). CC-OCR: A
Comprehensive and Challenging OCR Benchmark for
Evaluating Large Multimodal Models in Literacy.
http://arxiv.org/pdf/2412.02210
Zhou, Y., Guo, C., Wang, X [Xu], Chang, Y [Yi], & Wu, Y
[Yuan]. (2024). A Survey on Data Augmentation in
Large Model Era. http://arxiv.org/pdf/2401.15422
DATA 2025 - 14th International Conference on Data Science, Technology and Applications
362
