
Machine Learning Applied to Optimize Fuel Consumption in
Amazonian Waterways Military Logistics
Bruno Alessi Castro
a
, Pablo Gustavo Cogo Pochmann
b
and Eduardo Borba Neves
c
Officers’ Improvement School (Escola de Aperfeiçoamento de Oficiais – EsAO), Duque de Caxias Avenue,
2071, Rio de Janeiro-RJ, Brazil
Keywords: Machine Learning, Logistics, Amazon, Multiple Linear Regression, Resource Optimization.
Abstract: The present study is an analysis of the use of Machine Learning tools in favor of river logistics transport in
an Amazon jungle area and the impacts on the efficiency of the Logistics Commander's planning, due to a
research gap identified through imprecise methods for estimating fuel consumption in logistics trips. In this
way, a quantitative mathematical model was developed, using Multiple Linear Regression algorithms (due to
its simplicity for operators not specialized in the area) to predict fuel consumption on logistical trips carried
out by Vessel’s Center of Amazon Military Command (CECMA) vessels, using statistical data found in travel
reports. After this, a comparison was made of the model found with the current modus operandi of the
complement calculation completed by CECMA. applying a back test to validate the proposed model. The
results obtained generated research with an R of 0.935, explaining 87% of the proposed trips. In this context,
a software proposal was presented to be developed with an online interface and with the interaction of the two
algorithms. Thus, the use of machine learning tools such as MLR, integrated with an AI system with feedback
on predictive variables and fuel consumption of logistics missions brings an increase in the efficiency of
military logistics planning and reduces costs related to fuel management after missions, contributing to the
constant evolution and improvement of Military Doctrine.
1 INTRODUCTION
Military conflicts have undergone several current
transformations, as a result of the constant evolution
of an increasingly globalized and technological world.
A leader's success is associated with their ability to
adapt to these continuous changes in processes,
people, technologies, and structures, to allow
adequate flexibility and speed in decision-making
(Horney et al., 2010).
The recent conflict between Russia and Ukraine
highlights the importance of these developments in
modern warfare. The digital power of belligerent
countries is increasingly proving to be a powerful
weapon in the conflict (Hirata, 2022).
Added to this is the importance of adequate
logistics to enable the effectiveness of all planning
carried out. The Logistics function refers to the set of
activities that deals with the forecast and provision of
all classes necessary for the organizations and
a
https://orcid.org/0009-0000-5659-4344
b
https://orcid.org/0000-0003-3944-7953
c
https://orcid.org/0000-0003-4507-6562
supported forces. Its activities are: needs assessment,
procurement, and distribution (Brasil, 2018).
Among the logistical nuances within the scope of
the Brazilian Army, the river logistics within the
scope of the Amazon Military Command was an even
greater challenge, due to the characteristics of the
modal, mainly procedural deficiencies, personnel and
material (Oliveira, 2019).
The execution of this activity in the Western
Amazon is the responsibility of the 12th Military
Region, through its Directly Subordinate Military
Organization, CECMA (Brasil, 2015).
Thus, with the participation of new actors in
supporting operations in increasingly volatile and
complex environments and the importance of digital
power, Machine Learning becomes a viable tool for
military operations, due to the technological level this
tool achieved (Svenmarck, 2018).
This is because it can update data, through the
automation of operational processes and the
prediction of behavior, it makes it possible to generate
226
Castro, B. A., Pochmann, P. G. C., Neves and E. B.
Machine Learning Applied to Optimize Fuel Consumption in Amazonian Waterways Military Logistics.
DOI: 10.5220/0013461500003970
In Proceedings of the 15th International Conference on Simulation and Modeling Methodologies, Technologies and Applications (SIMULTECH 2025), pages 226-233
ISBN: 978-989-758-759-7; ISSN: 2184-2841
Copyright © 2025 by Paper published under CC license (CC BY-NC-ND 4.0)

greater knowledge and allows, in a more effective
way, communication between elements of interest,
thus optimizing efficiency. of operations (Davenport,
Ronanki, 2018).
Through machine learning, it is possible to
systematize automatic learning, based on a historical
series of data, by training a large volume of this data.
In this way, the system adapts and presents a result
with great precision (Elias, 2018).
As a result of the knowledge gap regarding the
adoption of Machine Learning in the Brazilian Army,
given the importance of this tool nowadays and its use
as a possibility to improve planning in logistical
missions along the rivers of the Western Amazon
carried out, this research was faced with the following
question: To what extent would the implementation
of machine learning have an impact on improving the
planning of commanders responsible for river
logistics transport in the Amazon?
In this sense, the objective of this study was to
investigate the use of Machine Learning in favor of
river logistics transport in an Amazon jungle area,
aiming to increase the efficiency of the Logistics
Commander's planning in river operations.
2 METHODOLOGY
In this study, a quantitative approach was used. A
mathematical model of a quantitative nature was
sought to predict fuel consumption on logistical trips
carried out by CECMA vessels, using a mathematical
model developed from a Multiple Linear Regression.
The instrument used to collect the data was a Data
Collection Form. As it is an extensive document, with
information of a qualitative and quantitative nature,
numerical values referring to the researched variables
were extracted, to consolidate the information
necessary for the development of the proposed model.
In total, data was collected from 100 (one hundred)
logistical travel reports carried out in the last eight
years (2015-2023).
The one hundred records collected were those that
presented the same data pattern. Older reports (prior to
2015) presented a completely different pattern, not
useful for the present study. All records were analyzed
for possible outliers, to check for inaccuracies or data
that may have been entered incorrectly.
The mathematical model was developed based on
a Multiple Linear Regression (MLR), considering the
following predictor variables for fuel consumption:
Vessel Engine Power (HP), Days Sailed (n), Distance
Sailed (km), speed (km/h ), and load transported (kg)
with and against the current. The development and
validation of the model were carried out using the
proportion of 80% / 20% of the collected records,
respectively. Eighty percent will be used to develop
the model and the remaining twenty will be used to
validate the developed model
Regarding days navigated (one of the predictor
variables), CECMA has a protocol for estimating the
navigation days needed for each location served,
which is based on the estimated speed to ascend and
descend the section to be navigated, in addition to the
distance. This speed estimate is based on the average
performance of each machine, with data recorded in
the Operations Center.
According to CECMA travel reports, it is possible
to obtain daily round trip data, the average distance
sailed, navigation time, type of boarding, number of
ferries transported, cargo transported, number of
generators and the navigated section (BRASIL,
2022a).
Currently, CECMA has its own model to
calculate fuel needs. This is an empirical model,
developed based on the observation of trips made and
the factors they take into account for the calculation,
these being: Distance sailed, speed up and down the
river (based on the average speed of navigations
already carried out), quantity of generators, estimated
mission days (based on old reports, the number of
days is estimated) and the consumption of engines
and vessels (based on the manufacturer's manual).
The results were submitted to the regression
metrics evaluation tools in Machine Learn to evaluate
the most accurate model, these being: R, R², adjusted
R², RMSE, and p-value. In the end, a comparison was
made of the model found with the current modus
operandi of the fuel calculation performed by
CECMA. All statistical calculations were performed
using JAMOVI v.2.4 software and the significance
level was set at 5% (a = 0.05).
3 RESULTS
The first step to build the MLR model was defining the
variables. The dependent variable of this study is fuel
consumption. Initial independent variables included
speed, load, duration, distance, and engine power.
After all the data collected from the 100 logistical
travel reports analyzed had been a spreadsheet, the
Kolmogorov-Smirnof normality test was performed
to test the distribution of the variables. With
normality tests, speed and load variables were
removed. The other variables followed a normal
distribution p > 0.05. Table 1 presents the descriptive
statistics of the investigated variables.
Machine Learning Applied to Optimize Fuel Consumption in Amazonian Waterways Military Logistics
227

Table 1: Descriptive Statistics of the predictor variables and fuel spent at 100 Logistical support trips carried out by the
Brazilian Army in the Western Amazon Region (12th Military Region), from 2015 to 2023.
Metric
Engine
(HP)
Up Load
(k
g
)
Down
load (k
g
)
Up Vel
(km/h)
Down Vel
(km/h)
Distance
(meter)
Days
Consumption
(lite
r
)
N
100
100
100 100 100 100 100
100
Mediu
m
505
94317
60193 8.32 14.7 2332 29.1
21369
Variation
144
73375
69465 1.32 2.03 864 12.5
10057
Amplitude
391
471556
314000 7 9 4302 69
61300
Minimu
m
309
3000
1000 5 10 98 3
1200
Maximu
m
700
474556
315000 12 19 4400 72
62500
Table 2: Multiple Linear Regression Metrics with the 80 travel samples.
Model R R² R² Adjusted RMSE F gl1 gl2 p
1
0.914
0.836
0.830 4040 129 3 76
<
.001
Table 3: Coefficients of variables predicting fuel consumption from logistical support trips carried out by the Brazilian Army
in the Western Amazon Region (12th Military Region), from 2015 to 2023.
Predicto
r
Estimates Standard erro
r
t
p
Intercepto
r
- 8361.80 4036.63 -3.73 <
.001
En
g
ine Power (HP)
16.85 3.57 4.73 <
.001
Distance (km)
2.59 0.90 2.89 0.005
Navigated Days
512.30 55.77 9.19 < .001
CONS = 16.85.ENG + 2.59.DIST + 512.30.DAYS - 8361.80 (1)
Where: CONS = Fuel Consumption (liter); ENG = Engine Power (HP); DIST = Navigated Distance (km);
and DAYS = Days Sailed (days).
The standard deviation of the sample indicates
that we have a considerable range in the sample
universe, from 144 HP for the engine, 73375 kg for
the cargo going up the river, 69465 kg going down, a
distance of 864 km, around 12.5 days sailed and a
deviation from consumption of almost 10057
thousand liters of diesel oil.
After checking all the information identified as
outliers, it was not possible to define the information
as discrepant, since these are possible events that may
occur during logistical trips. It was also confirmed
that there was no data entered erroneously.
However, to better adjust the model, variables that
presented a p-value greater than 0.05 were removed,
to obtain the most adjusted equation possible.
Therefore, Upstream and Downstream Load and
Speed were removed, due to their higher value.
Therefore, a second linear regression was run with the
independent variables Motor, Distance, and Duration
and the dependent variable Consumption.
Multiple Linear Regression (MLR) metrics with
the 80 travel samples are presented in Table 2 and the
model coefficients in Table 3.
Based on this mathematical model, the
verification of the assumptions began to attest to the
efficiency of this algorithm. Initially, the Q-Q of
residuals was checked, represented in Figure 1, which
represents a graphical method to compare two
probability distributions, plotting their quantiles
against each other.
The distribution of residuals is very close to the
straight-line equation presented, presenting linearity
between the data distribution.
SIMULTECH 2025 - 15th International Conference on Simulation and Modeling Methodologies, Technologies and Applications
228
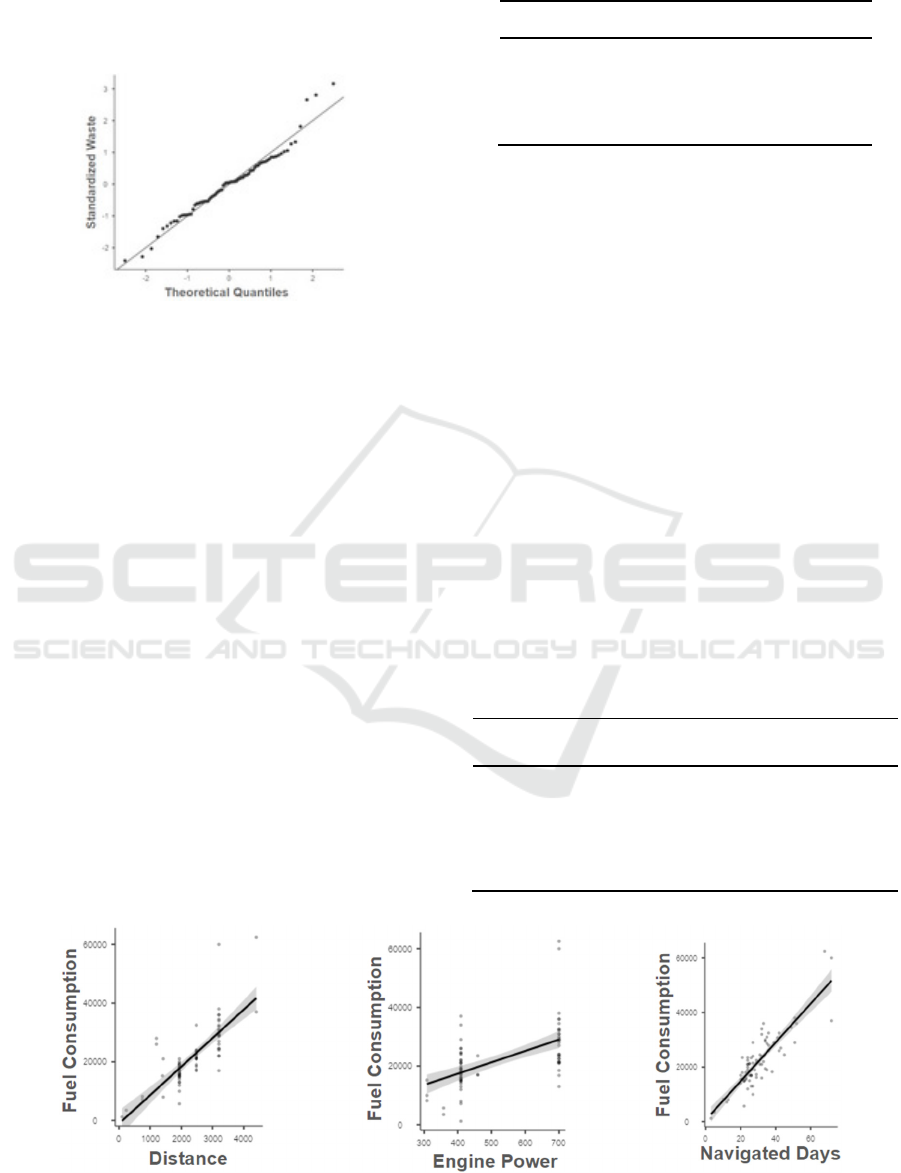
Continuing with the analysis of the assumptions,
the correlation of all independent variables with the
dependent variable, which is fuel consumption,
represented in Figure 2, was also individually
evaluated.
Figure 1: Q-Q Graph of the model to predicting fuel
consumption.
Considering the individualized relationship of the
variables included in the linear regression equation, it
is possible to see that all variables presented a positive
correlation, with no null correlations, that is, no
significance. This reinforces the relevance of the
model obtained as a tool to continue future analyses.
As a last assumption to be analyzed, the
possibility of multicollinearity between the variables
was assessed, that is, whether there is a relationship
between the independent variables as well,
considering that the relationships between the
dependent variables and the independent variables
have already been verified. In summary, the presence
of multicollinearity points to a possible insignificance
of the variables.
Therefore, the analysis of the variance inflation
factor (VIF) is essential to rule out this hypothesis.
The VIF is a number and, if its result is 1, it indicates
the non-correlation between the independent
variables, making the model valid. When this value is
greater than 5, the model begins to be considered
problematic (Minitab, 2019).
Table 4 represent the MLR collinearity analysis.
Table 4: Collinearity analysis between the MLR
independent variables.
Variable VIF Tolerance
En
g
ine Power (HP) 1.28
0.783
Distance (km) 2.36
0.424
N
avi
g
ated Da
y
s2.13
0.470
It can be seen that the values are close to 1, with
considerable tolerance to guarantee the fidelity of the
developed model.
Furthermore, it is possible to confirm that the
mathematical model created with linear regression
complied with the validity parameters, in addition to
following the assumptions of Operational Research.
Applying the model developed in 20 (twenty)
random samples that were not part of the calculation,
the MLR model is the best option in 17 (seventeen)
of the samples, presenting an average accuracy of
91%, against 64.9% accuracy of the CECMA model.
For this, models were developed, starting with the
first 20 (twenty) trips and running the two algorithms
in question. After that, the subsequent 20 (twenty)
samples were added, and the models were run again,
until reaching the total sample with 100 (one
hundred) recorded trips. Next, the data is shown in
Table 5.
Table 5: Metrics of the Backtest carried out with the 100
(one hundred) logistical support trips carried out by the
Brazilian Army in the Western Amazon Region (12th
Military Region), in the period from 2015 to 2023.
Model
Sample
size
R²
Ad
j
uste
d
Accuracy (Model
X/Model 5)*100
1 20 0.782 89.8%
2 40 0.805 92.5%
3 60 0.822 94.5%
4 80 0.845 97.1%
5 100 0.870 100%
Figure 2: The correlation of all independent variables with the dependent variable.
Machine Learning Applied to Optimize Fuel Consumption in Amazonian Waterways Military Logistics
229
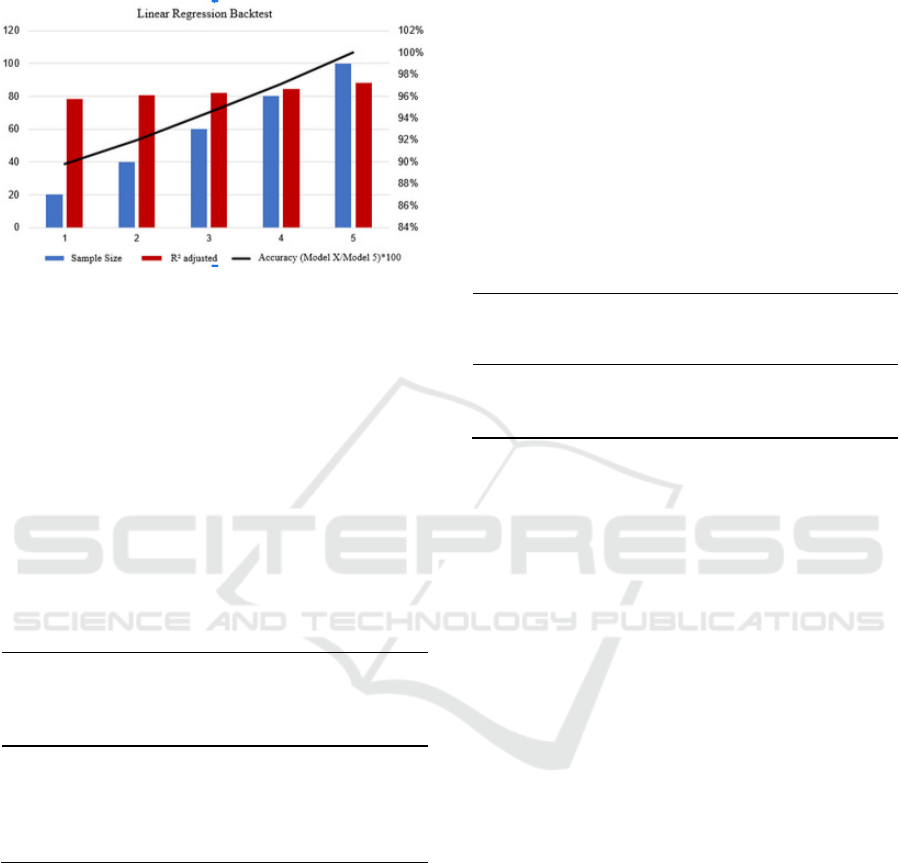
It can be seen that the larger the sample size, the
higher the Adjusted R² value, that is, the greater the
precision of this model, as shown in Figure 3:
Figure 3: The Linear Regression Backtest.
This information is a condition for understanding
the relevance of the model, confirming its validity,
and that if it is increasingly fed with more
information, its accuracy will be better, bringing
greater efficiency to the Commander who uses this
tool.
Representing the financial impact generated, the
data was presented from an economic perspective,
considering the price of diesel quoted at $1.21, as
shown in Table 6:
Table 6: Cost metrics for logistics support trips for the 100
samples of logistics support trips according to the metric
used.
Model
Actual
Cost Avg
($)
Cost Avg ($)
with
CECMA
calculation
Cost Avg
($) with
MLR
calculation
1 26519.90 30136.25 27243.17
2 25917.17 32547.15 26933.29
3 25314.45 33149.87 26618.33
4 25314.45 30136.25 26574.14
5 25073.36 29533.52 25314.51
According to the data presented, greater precision
was identified in the travel cost values calculated with
the MLR in relation to the actual cost of the
operations analyzed.
Regarding the leftover, when it comes to
navigation, vessels' fuel tanks are subject to a greater
risk of being contaminated with river water.
Furthermore, water condensation in fuel tanks can be
a common problem depending on weather conditions
(Busnello, 2020).
This contamination changes the characteristics of
the fuel, making it possible for these liquids to mix
when they are in motion, making it possible to decant
them only when the liquids remain in inertia
(Oliveira, 2013).
The fuel will undergo natural decantation in order
to separate the diesel oil from the water that
contaminated it. This decantation has already resulted
in a reduction of up to 40% in the initial amount of
fuel. After this, the fluid is filtered to remove
remaining impurities (Brasil, 2022). Table 7 presents
new information, estimating the contamination of
40% of the remaining fuel with water, due to
navigation characteristics, as shown below:
Table 7: Assessment of costs and economics of real
consumption compared to the current calculation model and
the one developed by Machine Learning.
Model
Cost
Avg
($)
Quantity
of Fuel
(liters)
Leftover
Fuel
(liters)
Waste
($)
Real 25073 20721 0 0
Actual 29533 24407 3686 1784
MLR 25314 20920 721 348
The estimated cost of fuel filtration spent by
CECMA in 2022 was approximately R$40,000.00
(forty thousand reais) annually. Considering all the
fuel left over from trips this year, approximately
76,000 liters of OD, we have an approximate cost of
0.53 cents per liter for purification. (Brasil, 2022).
According to Oliveira (2013), this fuel filtration
process is capable of purifying up to 99% of DO, thus
ensuring its use without compromising navigation
systems.
In this way, it is clear that making an
overestimated fuel calculation for logistical trips is no
longer a viable solution, becoming a problem to be
measured appropriately. The dichotomy to be
considered is not to travel with plenty of OD,
however, there must be an adequate safety margin in
addition to the fuel needed for eventual unforeseen
events and changes in planning.
4 DISCUSSION
In order to validate the presented model, sought to
make a parallel with other studies in the area.
Searching databases like Scopus and Web of Science,
find some really interesting works and researches that
appear to have similarities with our study.
The first one is an article where Carmo describes
a model to predict fuel consumption in a fleet of ships,
using a Machine Learning technique called Boosting.
SIMULTECH 2025 - 15th International Conference on Simulation and Modeling Methodologies, Technologies and Applications
230

This tool consists of adjusting an initial model,
seeking to improve its efficiency. The main objective
is to select the correct results, seeking to improve the
results that were not successful, through their
correction for subsequent models. It is worth
mentioning that this model requires several classifiers
with low accuracy, to create a more efficient variable
(Carmo, 2021).
Similarities can be identified in the predictor
variables used in the previously quoted study and the
present research since the variables analyzed by him
were: the size of the vessel, the engine power (in HP),
the place of origin and destination, departure date and
arrival date, the amount of fuel at departure and
arrival and the miles traveled. The evaluation of the
metrics of the developed model was simpler, with an
RMSE of 16.71 and an R² of 0.924, against an RMSE
of the current model analyzed of 32.99 and an R² of
0.892.
At the end of the work, the author did not present
a final equation, however, it reinforces the weight that
the variables analyzed and the influence that the
analysis of the algorithms had on the influence of the
fuel.
Another way of verifying the applicability of the
model is Backtesting, which consists of an analysis of
a series of pre-existing data. This test can identify the
behavior of the information, being fundamental in
predicting trends in the sample in question (Vezeris et
al., 2018).
This model is one of the main ones for outlining
strategies in the financial market or logistical
analyses, seeking to select the best decisions for
analysis (Bailey et al., 2016).
A study made by Takahashi developed a backtest
simulating financial return scenarios in 4 (four)
strategies adopted over 10 years by 34 different
companies. The strategies were linked to the grace
period of the titles acquired (Takahashi et al., 2021).
Through the backtesting carried out, it was
possible to identify the profitability of each one and
analyze its behavior within the historical series.
Long-term strategies presented an average annual
return of 12.91% against 4.83%, showing the
importance of this test to validate developed models.
One of the main products of automated analysis is
cost-effectiveness. In our study, the cost of the
difference in waste between the models will generate
savings of $1,435.00 per trip made (Table 7).
Duarte conducted research to calibrate some
inertial instruments, such as gyroscopes, using MLR.
The results brought efficiency to the navigation
system, improving the reading of results and,
consequently, the distribution of signals. All this
efficiency results in the reduction of direct and
indirect costs (Duarte et al., 2020).
Another interesting work is the analysis focusing
on predicting the weather seasons in the region of
India, characterized by great unpredictability in
natural phenomena, wrote by Shaker and Sureshbabu.
This peculiarity contributes to poor resource
management and decision-making regarding
calamities for farmers in the region. The model
developed was able to surpass all existing ones and
brought greater economic efficiency to the population
since there would be a more efficient allocation of
financial amounts (Shaker, Sureshbabu, 2020).
A study that presents great similarities with ours
is the research of the fuel consumption of a marine
vessel en route also using machine learning, by Hu et
al. Due to the characteristics of this type of
navigation, the authors considered variables such as
wind speed, wave height, fuel recording in real-time
every 15 (fifteen) minutes, the vessel's draft, and the
direction of the currents (which can be at any sense,
not for and against, as they are in rivers). To carry out
this analysis, they used Neural Networks and
Gaussian Process Regression. Both aim to analyze a
set of data, carry out proper training, and predict the
data set (Hu et al., 2019).
The metrics evaluated were MSE, RMSE, MAE,
and R². Through these, the authors compare the
differences with different samples, showing their
evolution with a broader set of data, such as a
backtest.
By way of comparison, this study was able to
demonstrate that R² evolved significantly, as the
amount of data fed into the Machine Learning
algorithm database, with a difference from 0.782 to
0.870.
Considering the above study, it can be seen that
the author managed to achieve an R² greater than 0.98
in both models, the result of a much more detailed
historical analysis, with an interval of 15 minutes.
However, it is worth remembering that this study has
a different aspect, as it concerns maritime navigation,
but points to the same direction as the basis of this
work.
Another study is Reis’ analysis with the linear
regression algorithm in a study to identify the
attitudinal factors that influence the purchase of
remanufactured products. The scope of his work was
to develop a relationship between the independent
variables, represented by attitudes, and the dependent
variable, which is the acquisition of this type of input.
The identification of the factors took place through a
thorough literature review, as was the case in this
study, searching for references that had already
Machine Learning Applied to Optimize Fuel Consumption in Amazonian Waterways Military Logistics
231

identified this phenomenon, in addition to a
questionnaire addressed to 287 people, to ratify or
rectify the verified notes. To validate the model, the
authors used only R, R², and adjusted R², comparing
7 (seven) models (Reis et al., 2020).
Unlike this work, which presented an R² of 0.870
using 3 predictor variables, Reis’ models started with
just one attribute, with one more attribute being added
in the next model, until reaching a model with all 7
(seven) attributes identified.
The highest adjusted R² value, in the last model,
was 0.642. The author also did not present the
correlations between attitudes, the final mathematical
model, or any other statistics that would validate the
model more efficiently.
In all the works cited above, some points become
clear: The need to have a robust and reliable database;
the algorithm needs the largest amount of data
possible, improving its accuracy as the database is
fed; and the metrics evaluated are fundamental to
validating the developed model. Without reference to
these metrics, it is not possible to say that the product
is efficient and suitable for what it proposes; and the
search for research in the same field is essential to
understand the scope of the study, as well as verify
the direction and possible adjustments of the work.
When it comes to the use of machine learning, it
was seen as a great opportunity for this research to
propose the development of a system in the cloud that
can be fed back by users and, at the same time,
improve the results obtained in the proposed models.
There are advantages of this type of technology
associated with the cloud. Initially, the author points
out the strong connection between this type of
platform and machine learning, being an effective and
economical solution for users of this type of system.
The aforementioned author highlights, stating that
there is a strong relationship between AI, Big Data,
and cloud computing, these being parts of a single
technological system (Silva, Bonacelli, Pacheco,
2021).
However, one of the points to be measured is the
cost of this technology, as well as its inputs. Although
it is difficult to measure, the data uploaded to a cloud
system will require a relative storage capacity,
information that must be taken into consideration
when creating future software (Veldkamp, Chung,
2019).
There are many advantages to this type of system:
Access to data in a simplified way, as long as a user
has permission to do so; Data control and
management, due to easy connectivity; Speed and
precision in the decision-making process; and
Savings on indirect and direct costs (IBM, 2022).
As already presented in this study, it is clear that
the possibilities of machine learning are fundamental
in the current context, and it is not acceptable for
military managers to neglect its use. Therefore,
below, we intend to propose a Machine Learning
system for use within the Brazilian Army.
In general, a cloud platform was imagined with a
database of all tabulated logistical travel information.
This would be the first tab in the system, called
“Consolidated Data”.
This Big Data would be fed at the end of all
missions by the Vessel Commanders. Thus, after
filling in this data, it would be updated in the first tab,
and MLR would update the mathematical model,
recalculating the fuel formula to be planned. It is
worth remembering that the greater the volume of
information, the greater the accuracy of machine
learning. This second tab would be called “Mission
Report”
Finally, the third tab of the system, “Planning”,
would be used by the Operations Center. These users
would have the current mathematical model, based on
the last trip made, bringing greater efficiency to
logistics planning, quickly and economically.
The idea is a system that is constantly fed back, as
logistical trips end, in order to consolidate as much
data as possible, also improving the efficiency of
machine learning.
One of the limitations of this study is the
reliability of the data entered in the analyzed reports,
with little data entered manually at the end of the day.
CECMA reports, although they have a large amount
of data, are done manually at the end of the day or
even before starting the next trip. This may
compromise the reliable release of information,
making subsequent double checking impossible.
5 CONCLUSIONS
It can be concluded that the use of machine learning
tools such as MLR, integrated into an AI system with
feedback on predictive variables and fuel
consumption of logistics missions, can increase the
efficiency of military logistics planning and reduce
costs related to handling. of fuel after missions.
The proposed mathematical model, CONS =
16.85.ENG + 2.59.DIST + 512.30.DAYS - 8361.80
(where: CONS = Fuel Consumption (l); ENG =
Engine Power (HP); DIST = Navigated Distance
(km); and DAYS = Days Sailed (days) managed to
explain 87% of the fuel consumption of military
logistical support missions in the Western Amazon.
SIMULTECH 2025 - 15th International Conference on Simulation and Modeling Methodologies, Technologies and Applications
232

It is believed that with the implementation of a
more robust system, with feedback and an increase in
the database, the power of prediction and accuracy of
fuel consumption in riverside logistics missions can
be increased, generating greater resource savings.
Finally, it is expected that the knowledge
presented in this research will be a window of
opportunity so that the Army General Staff can begin
planning the proposed employment and,
consequently, the entire Land Force can reap the
possibilities offered by Machine Learning, increasing
the efficiency of logistical tasks at all levels,
contributing to the constant evolution and
improvement of Military Doctrine.
REFERENCES
Bailey, David H. et al. The probability of backtest
overfitting. Journal of Computational Finance,
forthcoming, 2016.
Brasil. Centro de Embarcações do Comando Militar da
Amazônia. Dados Médios de Planejamento do
CECMA. 1. Ed. Manaus, AM, 2022
Brasil. Exército. Comando de Operações Terrestres.
Manual de Campanha Logística Militar Terrestre –
EB70-MC-10.238. 1. Ed. Brasília, DF, 2018.
Brasil. Exército. Comando Militar da Amazônia – 12ª
Região Militar. Diagnóstico Logístico do Comando
Militar da Amazônia. Manaus, AM, 2015.
Busnello, André Luis. Água no Diesel: Problemas e
Soluções, 20 nov. 2020. Disponível em:
https://www.pocfiltros.com.br/blog/agua-no-diesel-
problemas-e-solucoes/. Acesso em: 25 nov. 2023.
Carmo, Jorge Luiz do. Uso da Técnica de Boosting para
previsão de consumo de combustível de uma frota de
navios. Revista Científica Semana Acadêmica, 31 ago.
2021. [viewed 2023-02-08] Avaliable from:
https://semanaacademica.org.br /artigo/uso-da-tecnica-
de-boosting-para-previsao-de-consumo-de-combustive
l-de-uma-frota-de-navios.
Duarte, Camille Toscano et al. Método da Regressão Linear
Múltipla Aplicado na Calibração de Sensores Inerciais.
Brazilian Journal of Development, v. 6, n. 10, p. 75363-
75371, 2020.
Davenport, Thomas H.; Ronanki, Rajeev. Artificial
intelligence for the real world. Harvard business
review, v. 96, n. 1, p. 108-116, 2018.
Elias, Paulo Sá. Algoritmos, inteligência artificial e o
direito. 2018. [viewed 2023-11-10] Avaliable from:
https://www.conjur.com.br/dl/algoritmos-inteligencia-
artificial.pdf.
IBM (International Business Machines Corporation).
Inteligência artificial e ambiente de nuvem híbrida
definem futuro dos bancos. 18 abr. 2022. [viewed 2024-
02-02] Avaliable from: https://valor.globo.com/patroci
nado/ibm/noticia/ 2022/04/18/inteligencia-artificial-e-
ambiente-de-nuvem-hibrida-definem-futuro-dos-banco
s.ghtml.
Hirata, Marjory Alves. Ucrânia e Rússia evidenciam poder
digital: Web3 e criptomoedas ganham espaço. Revista
Consultor Jurídico, 11 mar. 2022. [viewed 2024-02-02]
Avaliable from: https://www.conjur.com.br/2022-mar-
11/marjory -hirata-ucrania-russia-evidenciam-poder-
armas-digitais.
Horney, N., Pasmore, B. & O’Shea, T. (2010). Leadership
agility: A business imperative for a VUCA world.
People & Strategy, 33, 4
Hu, Zhihui et al. Prediction of fuel consumption for enroute
ship based on machine learning. IEEE Access, v. 7, p.
119497-119505, 2019.
Minitab, Editor da, Lidando com a multicolinearidade na
análise de regressão, 19 abr. 2019 [viewed 2023-02-
08]. Avaliable from: https://blog.minitab.com/pt/ basta-
lidando-com-a-multicolinearidade-na-analise-de-
regressao.
Oliveira, Éder Chevitarese Geraidine de. Gerenciamento de
risco em missões de transporte logístico fluvial no eixo
do Rio Negro: uma proposta. 2019.
Oliveira, Marcos Gomes de. Manual da Filtração
Industrial. São Paulo SP. Artliber, 2013.
Reis, Felipe et al. Analysis of the relationship between
attitudinal factors and the intention to purchase
remanufactured products. Revista de Administração da
UFSM, v. 13, p. 1154-1174, 2020.
Shaker Reddy, Pundra C.; Sureshbabu, Alladi. An enhanced
multiple linear regression model for seasonal rainfall
prediction. International Journal of Sensors Wireless
Communications and Control, v. 10, n. 4, p. 473-483,
2020.
Silva Neto, Victo José da; Bonacelli, Maria Beatriz
Machado; Pacheco, Carlos Américo. O sistema
tecnológico digital: inteligência artificial, computação
em nuvem e Big Data. Revista Brasileira de Inovação,
v. 19, p. e0200024, 2021.
Svenmarck, Peter et al. Possibilities and challenges for
artificial intelligence in military applications. In:
Proceedings of the NATO Big Data and Artificial
Intelligence for Military Decision Making Specialists’
Meeting. 2018. p. 1-16.
Vezeris, D. Th; Schinas, Christos J.; Papaschinopoulos,
Garyfalos. Profitability Edge by Dynamic Back Testing
Optimal Period Selection for Technical Parameters
Optimization, in Trading Systems with Forecasting:
The d-BackTest PS method. Computational Economics,
v. 51, p. 761-807, 2018.
Takahashi, Wellinson Espinosa et al. Backtest da estratégia
de análise técnica T-26. 2021.
Veldkamp, L.; Chung, C. Data and the aggregate economy.
Journal of Economic Literature, 2019.
Machine Learning Applied to Optimize Fuel Consumption in Amazonian Waterways Military Logistics
233
