
Data Quality Scoring: A Conceptual Model and Prototypical
Implementation
Mario Köbis-Riedel
1
, Marcel Altendeitering
2a
and Christian Beecks
1b
1
FernUniversität in Hagen, Hagen, Germany
2
Fraunhofer ISST, Dortmund, Germany
Keywords: Data Quality, Data Management, Prototyping, Information Asymmetry, Data Products.
Abstract: A high level of data quality is crucial for organizations as it supports efficient processes, corporate decision-
making, and driving innovation. However, collaborating on data across organizational borders and sharing
data with business partners is often impaired by a lack of data quality information and different interpretations
of the data quality concept. This information asymmetry of data quality information between data provider
and consumer leads to a lower usability of data sets. In this paper, we present the conceptual model and
prototypical implementation of a Data Quality Scoring (DQS) solution. Our solution automatically assesses
the quality of a data set and allocates a data quality label similar to the Nutri-Score label for food. This way,
we can communicate the data quality score in a structured and user-friendly way. For evaluation, we tested
our approach using exemplary data sets and assessed the general functionality and runtime complexity.
Overall, we found that our proposed DQS system is capable of automatically allocating data quality labels
and can support communicating data quality information.
1 INTRODUCTION
In today's data-driven world, corporate data
management is increasingly following concpets of
data products and data factories (Patil, 2012;
Schlueter Langdon & Sikora, 2020). These concepts
aim to improve and automate data management tasks
to create scalable solutions that can handle the vast
amounts of data generated nowadays (Legner et al.,
2020). The benefits of well-managed data products
are manifold, including operational efficiency, better
customer engagement, and support innovation (Otto,
2015; Park et al., 2017; Sultana et al., 2022).
However, the benefits of data products are often
limited in inter-organizational collaborations and data
sharing scenarios (Altendeitering et al., 2024;
Woodall, 2017). The information asymmetry
between data providers and consumers can lead to
different perceptions of data quality and the
usefulness of data products for certain tasks and
processes. Data has no widely established criteria that
measure its quality for specific uses, which makes it
difficult for data consumers outside the original
a
https://orcid.org/0000-0003-1827-5312
b
https://orcid.org/0009-0000-9028-629X
domain or business unit to use the data
(Guggenberger et al., 2024). For example, consider a
sales data base that has many null values and is
outdated. For the sales representative owning the data
set this might be no problem, but the data scientist that
wants to conduct analyses to support sales strategies
this can be a big issue.
It is widely accepted that a lower degree of
information asymmetry can lead to more efficient
value creation in cooperations (Amit & Zott, 2001).
Moreover, (Geisler et al., 2022) and (Altendeitering
et al., 2022) identified data transparency and data
quality as important success factors of data
ecosystems. To lower information asymmetry in data
collaborations and data sharing scenarios an
automated approach for scoring data quality is
necessary. Based on the aforementioned, our research
question reads as follows:
Research Question: How to design and
implement a data quality scoring tool?
This paper addresses this research question and
presents a prototype for automated data quality
assessment, focusing on the creation of a Data Quality
Köbis-Riedel, M., Altendeitering, M., Beecks and C.
Data Quality Scoring: A Conceptual Model and Prototypical Implementation.
DOI: 10.5220/0013461300003967
In Proceedings of the 14th International Conference on Data Science, Technology and Applications (DATA 2025), pages 329-338
ISBN: 978-989-758-758-0; ISSN: 2184-285X
Copyright © 2025 by Paper published under CC license (CC BY-NC-ND 4.0)
329
Scoring (DQS) system. We, hereby, rely on the
design principles for DQS solutions previously
identified by (Guggenberger et al., 2024) and present
the details of an implementation. To make data
quality information available in a user-friendly
format, we rely on the well-known nutrition score that
helps customers identify healthy food. For the data
quality assessment, we used the widely-accepted data
quality dimensions specified by (Richard Y. Wang &
Strong, 1996).
Methodologically, our study follows a
prototyping approach and realizes a solution in three
phases: modeling, implementation, and evaluation
(Alavi, 1984). In the modeling phase, we identify
relevant dimensions of data quality based on a
thorough literature review. The implementation phase
involves the technical realization of the DQS system,
which currently focuses on data from CSV files.
Finally, the evaluation phase assesses the
performance of the DQS using various datasets to
generate different quality labels.
Our research contributes to the field of data
quality by providing a practical tool for organizations
to assess their data quality systematically and offering
data quality information in a structured and user-
friendly way. By addressing the challenges associated
with information asymmetry, our work aims to
support organizational decision-making and data
sharing (Geisler et al., 2022). The findings and
insights from this study will be valuable for data
specialists, researchers, and practitioners seeking to
enhance their understanding of data quality
assessment.
2 BACKGROUND
2.1 Theoretical Background
The concept of data quality has evolved into a critical
area of research that intersects various disciplines,
including computer science, statistics, data
management, and business sciences. As organizations
increasingly rely on data for strategic decision-
making, the need for high-quality data has become
more pronounced (Legner et al., 2020; Redman,
1998). Data quality if usually defined as the ‘fitness
for use’ by data consumers (Richard Y. Wang &
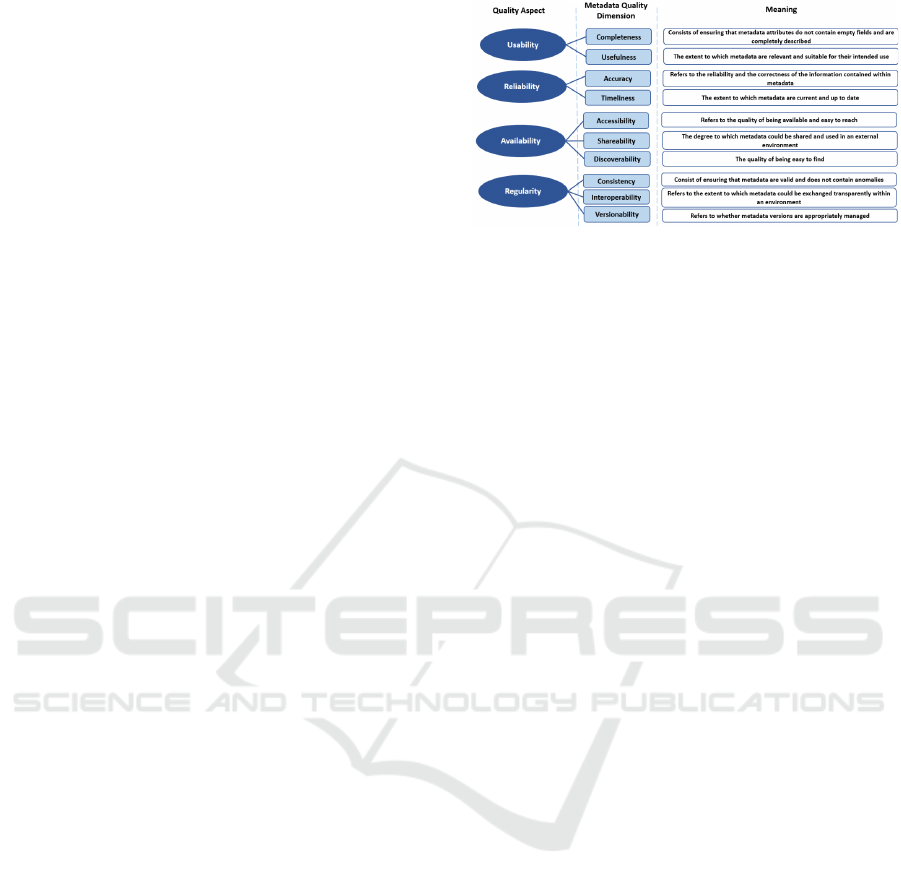
Strong, 1996). In their work, (Richard Y. Wang &
Strong, 1996) describe data quality as a multifaceted
concept, which encompasses different dimensions
such as accuracy, completeness, consistency, and
timeliness (see Figure 1).
Figure 1: Data quality dimensions based on (Richard Y.
Wang & Strong, 1996).
The growing complexity and diversity of data sources
and formats present ongoing challenges for data
quality measurements (Shankaranarayanan & Blake,
2017). Manual processes for data quality assessment
are increasingly inadequate, necessitating continuous
innovation and collaboration in developing
automated solutions (Schlueter Langdon & Sikora,
2020). High-quality data is essential for participants
within a data ecosystem, as it directly impacts the
strategic utilization of data along the value chain
(Altendeitering et al., 2022). The principle that "a
chain is only as strong as its weakest link" applies
here; if one part of the data process exhibits quality
deficiencies, it can adversely affect downstream
processes and the overall quality of outcomes (Geisler
et al., 2022).
2.2 Data Quality Solutions
In the pursuit of effective data quality management,
numerous data quality solutions have emerged in the
market, each offering unique features and capabilities
(Altendeitering & Tomczyk, 2022). Modern data
management solutions offer almost real-time
analytics and artificial intelligence integration
capabilities that make it possible to consolidate data
from different sources and obtain a coherent view of
data. These solutions are designed to improve the
quality of data. To assess data quality, it is important
to use specific metrics that calculate a data quality
score and identify errors and anomalies.
Exemplary, this section investigates three
prominent data management solutions and their
capabilities for data quality measurement and
scoring: IBM InfoSphere, Ataccama, and
Informatica. Reviewing established data quality
scoring methods, allows us to understand the benefits
and downsides of established tools and derive
requirements for our own solution. The decision to
evaluate these specific solutions stems from their
widespread use in the industry and their capabilities
in automating data quality processes. Furthermore,
they are considered the most established products
DATA 2025 - 14th International Conference on Data Science, Technology and Applications
330

according to Gartners Magic Quadrant for
Augmented Data Quality Solutions in 2024 (Gartner,
2024).
IBM InfoSphere: IBM InfoSphere (IIS)
functions as a robust data integration platform,
providing tools for data cleansing, transformation,
and monitoring. The capabilities enhance data quality
through classification, adjustment of data types, and
identification of relationships among data elements.
InfoSphere includes an Information Analyzer
component to assess both structural and content
quality, detecting inconsistencies and anomalies in
the data. When operated on-premise, IIS inherently
grants data sovereignty to the customer and restricts
unauthorized access to sensitive information. IIS
features the concept of a “score” related to data
quality allowing organizations to evaluate their data
quality systematically along different dimensions
facilitating informed decision-making based on the
assessed quality of the data. Additionally, IBM
InfoSphere streamlines the process of evaluating data
quality and identifying issues without extensive
manual intervention in an automated manner. This
automation enhances efficiency and allows for
continuous monitoring of data quality, ensuring that
organizations can maintain high standards of data
integrity over time.
Ataccama: The Ataccama platform, known as
ONE, provides a comprehensive suite of
functionalities focused on Data Quality &
Governance and Master & Reference Data
management. It features modules such as Data
Catalog, Data Quality, and Data Observability, which
facilitate the management, evaluation, and
monitoring of data quality across various data
sources, including structured, unstructured, and semi-
structured formats. The platform operates as cloud
service and allows for the creation of Business Terms
that help categorize and connect data elements,
ensuring a structured approach to data management.
In contrast to IIS and its on-premise mode Ataccama
does not provide further information on data
sovereignty. Therefore, it is not clear how Ataccama
handles sensitive information. The scoring
mechanism in Ataccama assesses data quality based
on the successful execution of predefined Data
Quality Rules across various dimensions such as
Validity, Completeness, and Accuracy. The overall
score is based on the lowest score among these
dimensions, highlighting the critical nature of each
dimension in assessing data quality. Ataccamas
automated analysis is a significant aspect of its
functionality, as it allows for continuous monitoring
of data quality and the detection of anomalies along
fixed expiration times.
Informatica: Informatica as a comprehensive
commercial solution for data quality management
emphasizes its modular approach through the
Intelligent Data Management Cloud (IDMC).
Informatica operates as cloud service as well as a
multi-hybrid platform and encompasses various
aspects of data handling, including data profiling,
cleansing, integration, and governance, enabling
organizations to effectively manage their data assets.
Its methodology involves discovering data issues,
defining rules and dictionaries, applying mappings
and validations, and measuring progress through
scorecards, which provide insights into data quality
metrics and consists of dimensions like completeness,
accuracy or consistency. In terms of data sovereignty
Informatica allows organizations to maintain control
over their data, ensuring compliance with relevant
regulations and standards across different
jurisdictions Additionally, Informatica features
capabilities for automated analysis, which enable
scheduled evaluations of data quality.
3 DATA QUALITY SCORING
MODEL
In order to proceed with the development of a data
quality assessment model, the reliability and
reputation of data in an ecosystem needs to be
enhanced (Altendeitering et al., 2024; Geisler et al.,
2022). A data quality score (DQS) system is proposed
that enables the automatic analysis of data quality and
the allocation of a user-friendly data quality label.
The goal is to provide consumers with a clear and
understandable way to evaluate the quality of data by
summarizing the results in a unified score, similar to
the Nutri-Score for food.
The proposed DQS system is based on the design
principles identified by (Guggenberger et al., 2024)
and the data quality dimensions specified by (Richard
Y. Wang & Strong, 1996). The DQS model
culminates the automated assessment in a weighted
average in order to take into account the relative
importance of individual dimensions in the
calculation of the score and to assign them to a
consistent and comparable scale. Furthermore, we
mapped the data quality results onto the interval [0,1].
This mean value is also combined with the min-max
rule. The advantage of being more strongly
influenced by the weakest evaluation result of a
dimension preserves the relative differences between
Data Quality Scoring: A Conceptual Model and Prototypical Implementation
331

the values and provides a scaling option depending on
the context. All quality criteria must therefore be in
an appropriate condition for a dataset to be classified
as high quality (Chankong & Haines, 2008).
In addition to using the weighted average and the
minimum, the Hurwicz rule is also applied, which is
a frequently used rule for decision-making. It
combines the minimax and maximax rules, whereby
the minimax rule, the decision-maker chooses the
alternative whose worst result value is the highest
(Chankong & Haines, 2008). According to the
maximax rule, the decision-maker is guided by the
highest possible result value.
Based on the dimensions mentioned for data
specialists, the most important one, “accuracy” from
the category “intrinsic dimensions”, is first used to
assess data quality. (Pipino et al., 2002) formulated
“accuracy” as a measure of the correct and faithful
representation of information. This dimension
summarizes attributes such as “flawless”, “reliable”
and “precise” (Richard Y. Wang & Strong, 1996).
Generally, the degree of accuracy is manifested by:
Percent
=
TP + TN
TP+TN+FP+FN
=
correct data records
total data records
· 100
Where TP, FP, TN and FN stand for True
Positive, False Positive, True Negative and False
Negative respectively.
p =
part · 100
whole
=
25 · 100
168
= 𝟏𝟒, 𝟖𝟖
As a result of the distribution of important
attributes or dimensions, the results for “Accuracy”
have a percentage share of 14.88.
The basic formula of percentage calculation was
used in which p stands for the percentage. The
percentage determined defines the weight.
Another important dimension is “completeness”.
Analogous to (Wand & Wang, 1996) this dimension
is described as the availability of all necessary
information; all values for a variable are thus
contained in a dataset (R. Y. Wang et al., 1995). For
this dimension, the percentage in relation to its
importance for data specialists corresponds to:
p=
part · 100
whole
=
15 · 100
168
= 𝟖, 𝟗𝟐
The weighted average value explained at the
beginning is calculated from the results of the quality
assessment and can be formally defined as follows:
weighted average value 𝒙
=
∑
⋅
∑
Q
i
stands for the analysis result of the respective
dimension and w
i
for its weight, which was
determined as a percentage (see above).
The following is a concrete example that takes
into account the above-mentioned dimensions,
accuracy and completeness, with their percentages as
weights:
𝒙
=
0,6 ⋅ 0,1488
+
0.3 ⋅ 0,0892
0,1488 + 0,0892
=
0,089 + 0,026
0,238
= 𝟎, 𝟒𝟖
Combined with the min-max approach, which
takes the minimum from the analysis results per
dimension, the result is:
Minimum = minpercent
,percent
=min
0,6; 0,3
= 𝟎, 𝟑
Following the Hurwicz rule, the parameter (λ) should
now be integrated into the calculation with 0.6:
DQS = Minimum · λ + weightedAVG ·
1 − λ
=
0,3 · 0,6
+
0,48 · 0,4
= 𝟎, 𝟑𝟕
In the above example, the minimum was weighted
more heavily in order to consider the effects of the
“completeness” dimension to be particularly critical
and unacceptable, even if the mean value indicates a
significantly better overall quality due to
compensation in other dimensions. Completeness,
therefore, has a stronger influence on the overall
result, which is only considered acceptable if all
dimensions reach a similarly acceptable level. If the
weighting is reversed, i.e. if the weighted average is
given greater weight, this would influence the overall
rating accordingly. If dimensions are at a high level,
weaker ones have less influence on the overall
analysis result.
Depending on the context, the score can therefore
be adjusted by giving more weight to either the
minimum or the mean value. No specific weighting is
defined for the implementation. A balanced approach
of both values, minimum and weighted average, is
therefore chosen as an example:
DQS = 0,3 · 0,5 + 0,48 · 0,5 = 𝟎, 𝟑𝟗
In order to emphasize and effectively
communicate the importance of this score, it is
important to depict it on an easily understandable
rating scale. The concept of the Nutri-Score for food
is suitable for this purpose, the aim of which is to offer
consumers a simple and understandable way of
recognizing the nutritional quality of food at a glance.
Favorable and unfavorable nutrients are offset against
each other in such a way that the result is assigned on
a color scale ranging from A (dark green) to E (dark
orange), thus helping consumers to differentiate
between healthy and unhealthy foods (Hercberg et al.,
2022).
The evaluation of the Nutri-Score shows that it is
useful for consumers and is perceived as very helpful
when choosing food, as it reveals at first glance the
DATA 2025 - 14th International Conference on Data Science, Technology and Applications
332
relevance for a healthy diet, which, according to the
International Food Information Council, is an
important decision-making aid for over 80% of
consumers. Inspired by this finding, the Nutri-Score
concept needs to be adapted and data sets need to be
given a label that represents the quality of their
dimensions (Borra, 2006).
Labeling the quality of data, in addition to
providing quick insight into the suitability of a
dataset, also leads to increased transparency by
allowing data specialists to select the most
appropriate dataset to achieve more valid results in
the development of AI systems (Hallinan et al., 2020).
The current study situation does not provide any
concrete threshold values that classify the quality of a
dimension as high or inferior. In this respect, the
labeling is done equally in 20% steps:
A. 80 – 100%
B. 60 – 79%
C. 40 – 59%
D. 20 – 39%
E. 0 – 19%
As already mentioned, the most important
dimensions for data specialists are taken into account,
which can be assessed in the course of an automated
analysis triggered in real time. However, it should be
noted that not every dimension can be examined
unconditionally. Dimensions such as relevance or an
appropriate amount of data can only be determined by
the user of the dataset themselves (Richard Y. Wang
& Strong, 1996). Relevance dimension requires
additional information if data is to be used for a
specific purpose. This cannot be evaluated
automatically without context. But could be
addressed by a Deep Learning approach in the future
for modeling relationships between datasets and users
to predict relevance (Graph Neural Networks) (Gori
et al., 2005).
To ensure that the evaluation is nevertheless
broad enough to provide a comprehensive picture of
the data quality of a dataset, the analysis is limited to
the dimensions of accuracy, completeness,
consistency and timeliness, for which the weightings
are 0.1488, 0.0892, 0.0476 and 0.0535 respectively.
4 PROTOTYPICAL
IMPLEMENTATION
The implementation of the Data Quality Scoring
System (DQS) aims to automatically analyze and
evaluate the quality of structured data. For simplicity
we focus our prototypical implementation on CSV
files. Analyzing CSV files should provide us an
impression on the functionality and usefulness of the
DQS system. Incorporating further data sets is part of
future work. The programming is done in Python, a
versatile programming language that is well-suited
for data analytics tasks. The Great Expectations
framework, which was specially developed for
defining and checking data quality criteria, is used to
validate the data. The data is stored in a DuckDB, a
column-oriented database that is ideal for analytical
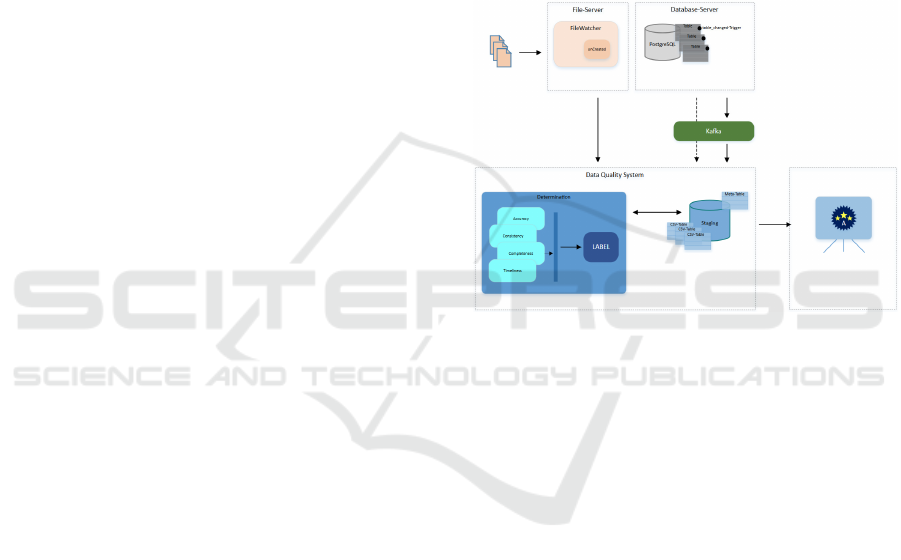
purposes and acts as a staging database. The
following diagram depicts the architecture of the
DQS system.
Figure 2: Architecture of the DQS-System.
A central element of the implementation is a
monitoring mechanism that continuously watches for
newly created CSV files and thus operates on an
event-driven basis. This mechanism ensures that the
files are completely written before they are loaded
into the database. To achieve this, the file size is
monitored during the write process. Only after the file
has been recognized as complete is it loaded into the
database. During this process, a table is created whose
name is derived from the file name, ensuring a clear
and comprehensible structure.
In addition to the actual data, important meta
information is stored in a separate table called meta.
This meta information includes a unique ID of the
dataset, the table name, the timestamp of the last
change and a quality label that is assigned after the
data has been analyzed. To avoid redundant analyses,
the system checks whether the file already exists in
the database before performing the quality
assessment. For this purpose, the timestamp of the
last change is compared with the timestamp in the
meta information table. If no changes are detected,
the quality scoring is not carried out, which increases
the efficiency of the system and saves resources.
Data Quality Scoring: A Conceptual Model and Prototypical Implementation
333
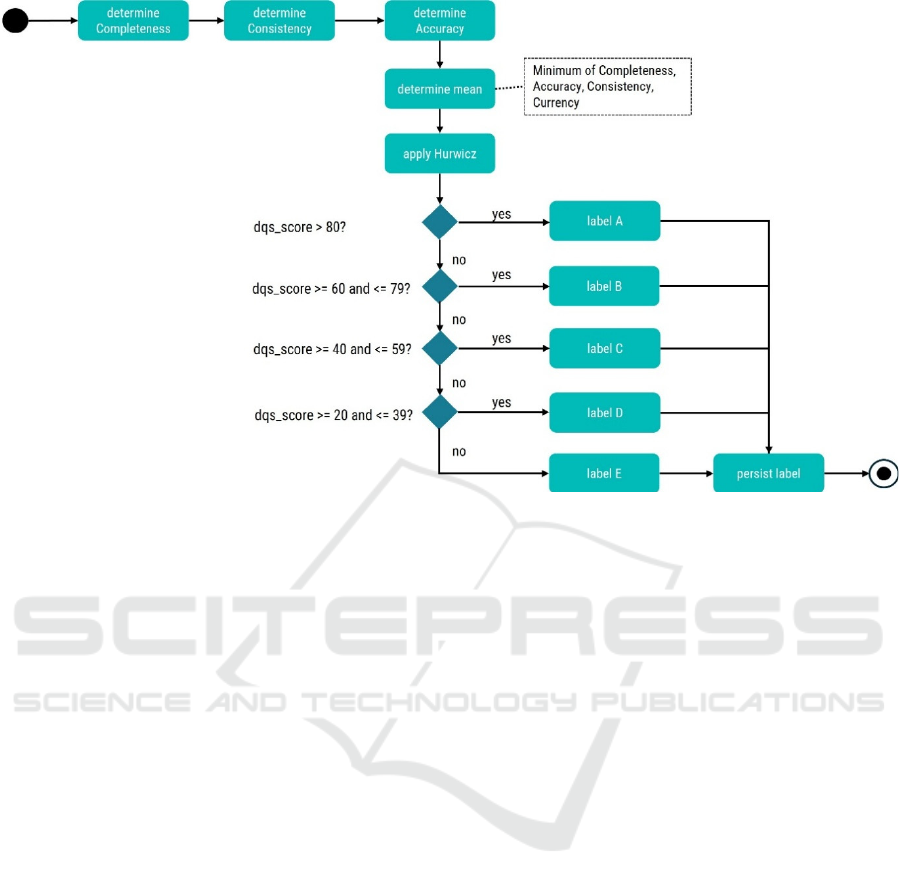
Figure 3: Flow diagram for the data quality scoring mechanism.
Data quality is assessed by analyzing several
dimensions, including completeness, consistency,
accuracy and currency. They are one of the most
important quality dimensions for data specialists (see
also previous section). Each of these dimensions is
evaluated using specific criteria and metrics and
encapsulated in a function. The overall value is
calculated as a weighted average and combined with
the Hurwicz rule, which adjusts the result, according
to context. A balanced value of 0.5 for the weighting
was used in this study.
Depending on the value determined, a quality
label from A to E is assigned, which is written back
to the metadata table for the dataset entry. The
activity diagram shown in Figure 3 depicts the
scoring algorithm process including the Hurwicz rule.
The completeness dimension is scored by
calculating the percentage of non-empty values in
relation to the total number of cells. A specific value
was set for this dimension to quantify the quality of
the data. The consistency of the data is ensured by
checking the header information for conformity with
expected formats. Regular expressions are used to
check the validity of e-mail addresses, telephone
numbers and zip codes. These checks are crucial to
ensure that the data is available in an expected format
and is therefore suitable for analysis.
An exemplary value was selected for the degree
of updating in order to identify data as timely. Data
that is updated regularly is given a higher value, while
data that is updated less frequently is given a lower
value. In a production environment, however, this
value should be carefully selected to meet specific
requirements. This flexibility allows the DQS to
adapt to different data sources and requirements.
Identification and handling of outliers in the data is
also important. Here, the Isolation Forest algorithm is
used, which has proven to be effective in detecting
anomalies in data sets. The algorithm analyses the
numerical columns of the data and identifies potential
outliers, which are then marked accordingly. To
ensure the robustness of the analysis, missing values
in the numerical columns are replaced by the median
of the respective column before the outlier analysis is
performed. This procedure ensures that the analysis is
not affected by missing data.
Another important aspect of the implementation
is the integration of a notification system in
conjunction with Apache Kafka, which is activated
when changes are made to the database. These
notifications are processed and sent to a Kafka
producer to consolidate event-driven processing of
the data. This functionality is particularly valuable in
dynamic environments where data is frequently
updated, and a timely analysis is required.
Overall, the introduction of DQS provides a stable
basis for the automated evaluation and assessment of
data quality. Data quality can be constantly monitored
and improved through the combination of continuous
monitoring, in-depth analysis and flexible data
processing. These functions play an important role in
various application areas, especially at a time when
data quality is crucial for well-informed decision
making and data analytics. With modern technologies
DATA 2025 - 14th International Conference on Data Science, Technology and Applications
334
such as the Isolation Forest algorithm and Great
Expectations, a system can be created that meets data
quality requirements and is robust and efficient.
5 EVALUATION
In the evaluation phase, we aimed to analyze and
evaluate data that exhibits significant heterogeneity.
At this stage, an exemplary 30,000-line dataset is
used that contains various employee data, including
employee number, salary, telephone number and date
of birth. The aim of this stage is to create a quality
label for the data, which assesses the quality and
integrity of the data. As soon as a new file is detected
in the specified path, the analysis starts. The CSV
files are processed sequentially by the application.
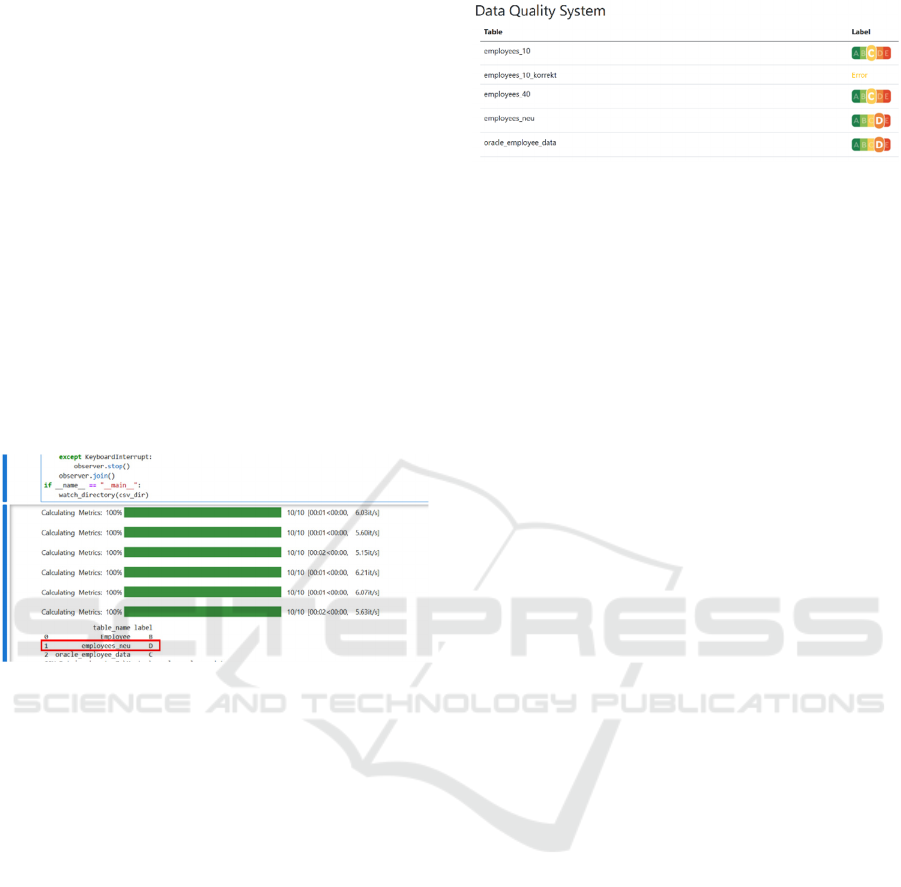
Figure 4 shows parts of the analyzing process and its
result after a new file has been detected.
Figure 4: Results of the data
quality
analysis.
This means that only one file is analyzed at a time.
In high-performance environments, this can lead to
bottlenecks, as it is not possible to process several
files at the same time. To increase efficiency, future
work should consider parallelizing the analysis
process through multithreading.
For data processing, the application uses modern
technologies such as DuckDB and provides
connectors that can be integrated into business
intelligence tools such as Tableau or Power BI. These
tools enable a visual representation of the quality
labels. However, they require a license, which means
that an APS.NET MVC application is used to display
the label. For connection-oriented real-time
communication between client and server, this
application uses SignalR and WebSockets, allowing
clients to be informed immediately of changes. Figure
5 shows the individual results of the data quality
analyses as labels in the design of the Nutri-Score.
Figure 5: Exemplary data quality labels for the data sets
used.
In addition to the general functionality of the
system, we aimed to investigate the runtime
complexity. The runtime complexity offers an
estimation of the efficiency of the analysis and its
applicability in real-world scenarios. Each quality
dimension has its own complexity, which in turn
affects the overall complexity. The runtime
complexities of the individual functions are described
in more detail below.
The init function is responsible for carrying out
the necessary initializations before the data analysis
starts. This function normally involves simple
assignments and viewing configuration data. The
runtime complexity of this function can be estimated
with O(1), as it is independent of the data set size.
This means that the init function remains constant in
time, regardless of how many rows or columns are to
be processed.
The function for determining completeness
checks whether all necessary data is contained in the
columns. This function runs over all lines and checks
whether there are any missing values. This function
has a runtime complexity of O(n), where n is the
number of lines contained in the data set. The
complexity is linear in relation to the number of lines,
as each line is run through once.
The currency function is used to determine how
timely the data is. Normally, this function uses
straightforward assignments and comparisons to
determine the age of the data. The runtime complexity
of this function can be calculated in the same way as
for the init function with O(1), as the operations are
independent of the data set size.
In contrast, the consistency function controls the
coherence of the data in the columns. Since all
columns must be traversed, it retrieves data from the
database, which represents a complexity of O(n).
There are also loops that run through the rows,
resulting in an overall complexity of O(m·n). Where
m stands for the number of columns and n for the
number of rows.
The accuracy function consists of several sub-steps:
Data preparation. The first step is to check the
columns to determine the numerical columns. The
identification has a complexity of O(d), where d is the
Data Quality Scoring: A Conceptual Model and Prototypical Implementation
335
number of numerical columns. This step ensures that
only relevant columns are used for the outlier
analysis.
Validation of the date format. The specified date
format (%d.%m.%Y) is checked for each row. The
validation has a complexity of O(m), where m is the
number of rows. The time adds up linearly to the
number of rows, as each row is checked individually.
Isolation Forest algorithm: The Isolation Forest
algorithm has a more complex runtime. First of all,
the data must be sorted. Since the sorting is applied to
each numerical column, the sorting is performed with
a runtime of O(n log n), where n is the number of data
points. In this context, the number of numerical
columns d is taken into account. As a result, a sort is
performed for each of the numeric columns, the
complexity of which can be estimated with O(d-m log
m), where m is the number of rows. Once the data has
been sorted, the median can be calculated in constant
time O(1). To replace NaN values with the median,
the entire DataFrame must be iterated over, which has
a complexity of O(m-d), since every row and every
numerical column is considered. To replace NaN
values with the median, the entire DataFrame must be
iterated over, which has a complexity of O(m-d),
since every row and every numerical column is
considered. The accuracy function is complex overall
as it is composed of the steps mentioned above. The
main source of complexity is the Isolation Forest
algorithm, especially the sorting, which leads to an
overall complexity of O(d-m log m). The runtime is
therefore highly dependent on the number of
numerical columns (d) and the number of rows (m).
The score function is an important part that brings
together all the functions that were previously used to
create the quality label by:
𝑂
𝑚𝑛
+ 𝑂
𝑚𝑛
+ 𝑂
1
+ 𝑂
𝑑 𝑚 log 𝑚
The other functions are called by this function one
after the other and the results are summarized. The
runtime complexity of this function results from the
complexity of the individual functions called. This
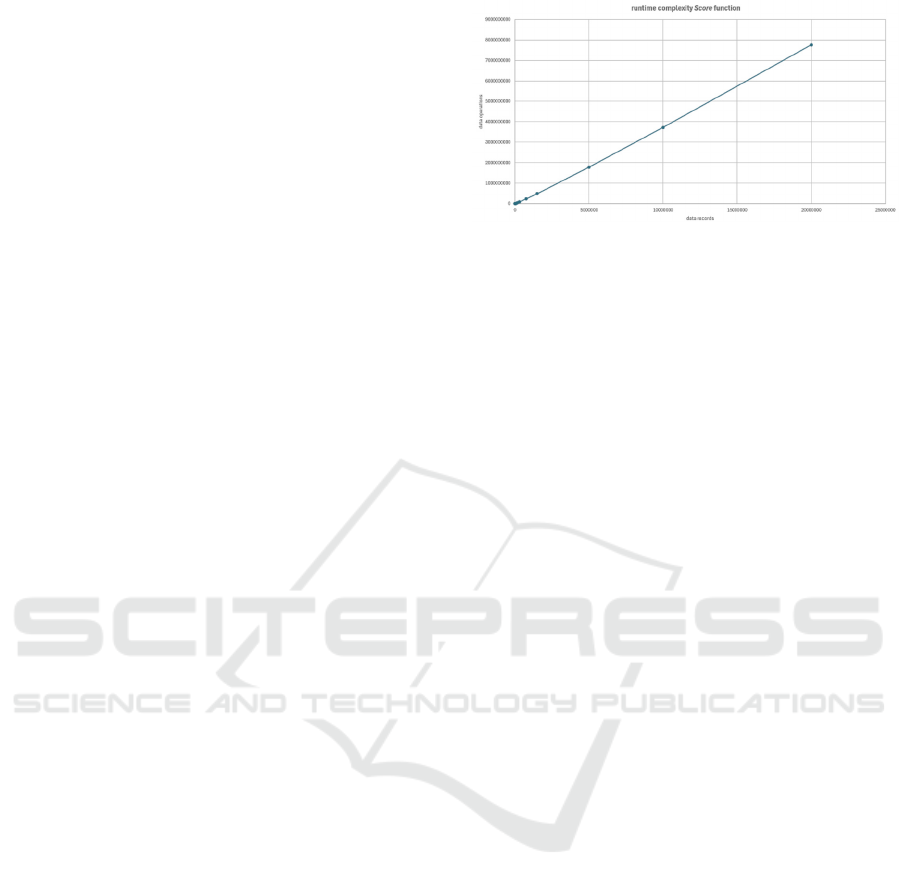
results in an overall complexity of O(n + m log m).
The performance of the score function is
primarily influenced by the calculation of the
accuracy in conjunction with the Isolation Forest
algorithm, so that the runtime grows linearly with an
increasing number of input data (see Figure 6).
Figure 6: Runtime complexity of the DQS solution.
In order to further consolidate this prototypical
approach, various approaches can be considered for
its scaling and possible extensions can be considered.
For example, the quality of additional dimensions can
be determined with the aid of further metrics.
Moreover, by parallelizing the analysis process
through multithreading, results can be provided in
real time which leads to a further reduction in analysis
times by means of horizontal scaling through the use
of several machines with automatic load distribution.
Using a microservice architecture, dimensional
analyses can be set up modularly and scaled
independently as each service is operated
autonomously. This mitigates the effects of possible
load peaks or the potential failure of other analysis
processes.
For the analysis to be extended to other
dimensions such as relevance, it is not only necessary
to use metrics but also the implementation of big data
storage solutions. The integration of contextual
information from users and data consumers is also
important to determine the exact purpose of a data set
and assess the relevance in a given context (Richard
Y. Wang & Strong, 1996).
6 CONCLUSION & OUTLOOK
Data quality is vital for the success of companies and
the benefits of operating on high-quality data sets are
manifold. Especially in view of the increasing
amounts of data and the complexities of data sharing
and data ecosystems a new solution for automated
labelling of data sets in a structured, uniform, and
user-friendly way is necessary. For this purpose, we
proposed a DQS system, which aims to optimize the
analysis process and enable reliable assessment of
data sets by tagging analyzed data with an aggregated
overall score. This promotes a user-friendly
communication by employing a more straightforward
scoring methodology similar to the Nutri-Score.
DATA 2025 - 14th International Conference on Data Science, Technology and Applications
336

Four key dimensions of data quality were
considered for this prototype: accuracy, consistency,
timeliness, and completeness. These dimensions are
crucial for an automated event-driven evaluation and
do not require any additional information (in contrast
to relevance for instance). As part of the background
analysis, we examined various data management
solutions and found that most providers pursue static
approaches that only perform analyses at fixed time
intervals and have limited scoring capabilities.
Our study describes the development of a data
quality scoring model that is based on a mathematical
model that enables a balanced assessment of data
quality by employing a weighted scoring method
across multiple specified criteria (such as correctness
and completeness). This offers a nuanced view of data
quality that many frameworks do not.
The contributions of our research are two-fold.
For practitioners, we provide a detailed description of
an artifact that aims to automate data quality scoring
and the labelling of data sets. Practitioners can use our
descriptions and findings to create custom solutions
in their environments. Moreover, they can use our
conceptual approach and evaluation results to raise
the awareness of data quality and initiate new
projects. Scientifically, we offer a design science
artifact that can inform further research and help
advance the fields of data quality and data
management (Hevner et al., 2004). Our research also
addresses calls for improving the communication of
data quality scores that several researchers made
(Geisler et al., 2022; Guggenberger et al., 2024) and
can support the future development and research on
data ecosystems.
In terms of limitations and future work, there are
multiple areas that could be improved. First, our
solution is currently focused on a limited number of
data quality metrics. By transforming the prototype
into a modular architecture and integrating additional
metrics, we could increase the data quality scoring
functionalities and offer a more profound data quality
label. Second, our evaluation is currently limited on
exemplary data sets. A more empirical and in-depth
evaluation is necessary to assess the applicability and
usefulness of our solution in real-world contexts.
Future work should, therefore, focus on applying the
solution on real-world data sets to identify areas for
improvement and future development.
REFERENCES
Alavi, M. (1984). An assessment of the prototyping
approach to information systems development.
Communications of the ACM, 27(6), 556–563.
https://doi.org/10.1145/358080.358095
Altendeitering, M., Dübler, S., & Guggenberger, T. M.
(2022). Data Quality in Data Ecosystems: Towards a
Design Theory: Findings from an Action Design
Research Project at Boehringer Ingelheim. AMCIS
2022 Proceedings.
Altendeitering, M., Guggenberger, T. M., & Möller, F.
(2024). A design theory for data quality tools in data
ecosystems: Findings from three industry cases. Data
& Knowledge Engineering, 153, 102333. https://
doi.org/10.1016/j.datak.2024.102333
Altendeitering, M., & Tomczyk, M. (2022). A Functional
Taxonomy of Data Quality Tools: Insights from
Science and Practice. Wirtschaftsinformatik 2022
Proceedings.
Amit, R., & Zott, C. (2001). Value creation in E‐business.
Strategic Management Journal, 22(6-7), 493–520.
https://doi.org/10.1002/smj.187
Borra, S. (2006). Consumer perspectives on food labels.
The American Journal of Clinical Nutrition, 83(5),
1235S. https://doi.org/10.1093/ajcn/83.5.1235S
Chankong, V., & Haines, Y. Y. (2008). Multiobjective
decision making: Theory and methodology. Dover Publ.
Gartner. (2024). Gartner Magic Quadrant for Augmented
Data Quality Solutions. https://www.gartner.com/en/
documents/5257863
Geisler, S., Vidal, M.‑E., Cappiello, C., Lóscio, B. F.,
Gal, A., Jarke, M., Lenzerini, M., Missier, P., Otto, B.,
Paja, E., Pernici, B., & Rehof, J. (2022). Knowledge-
Driven Data Ecosystems Toward Data Transparency.
Journal of Data and Information Quality, 14(1), 1–12.
https://doi.org/10.1145/3467022
Gori, M., Monfardini, G, Scarselli, F. (2005). A New Model
for Learning in Graph Domains.” Proceedings of the
IEEE International Joint Conference on Neural
Networks 2: 729–734
Guggenberger, T. M., Altendeitering, M., & Schlueter
Langdon, C. (2024). Design Principles for Quality
Scoring: Coping with Information Asymmetry of Data
Products. HICSS, 4526–4535.
Hallinan, D., Leenes, R., Gutwirth, S., & Hert, P. de (Eds.).
(2020). Computers, Privacy and Data Protection Ser:
vol. 12. Data protection and privacy: Data protection
and democracy. Hart. https://ebookcentral.proquest.
com/lib/kxp/detail.action?docID=6160332
Hercberg, S., Touvier, M., & Salas-Salvado, J. (2022). The
Nutri-Score nutrition label. International Journal for
Vitamin and Nutrition Research. Internationale
Zeitschrift Fur Vitamin- Und Ernahrungsforschung.
Journal International de Vitaminologie et de Nutrition,
92(3-4), 147–157. https://doi.org/10.1024/0300-9831/
a000722
Hevner, A. R., March, Park, J., & Ram, S. (2004). Design
Science in Information Systems Research. MIS
Quarterly, 28(1), 75–105. https://doi.org/10.
2307/25148625
Legner, C., Pentek, T., & Otto, B. (2020). Accumulating
Design Knowledge with Reference Models: Insights
from 12 Years’ Research into Data Management.
Journal of the Association for Information Systems,
21(3), 735–770. https://doi.org/10.17705/1jais.00618
Data Quality Scoring: A Conceptual Model and Prototypical Implementation
337

Otto, B. (2015). Quality and Value of the Data Resource in
Large Enterprises. Information Systems Management,
32(3), 234–251. https://doi.org/10.1080/10580530.
2015.1044344
Park, Y., El Sawy, O. A., & Fiss, P. C. (2017). The Role of
Business Intelligence and Communication
Technologies in Organizational Agility: A
Configurational Approach. Journal of the Association
for Information Systems, 18(9), 648–686. https://
doi.org/10.17705/1jais.00467
Patil, D. J. (2012). Data Jujitsu: The Art of Turning Data
into Product (1st edition). O'Reilly Media Incorporated.
https://permalink.obvsg.at/
Pipino, L. L., Lee, Y. W., & Wang, R. Y [Richard Y.]
(2002). Data quality assessment. Communications of
the ACM, 45(4), 211–218. https://doi.org/10.
1145/505248.506010
Redman, T. C. (1998). The impact of poor data quality on
the typical enterprise. Communications of the ACM,
41(2), 79–82. https://doi.org/10.1145/269012.269025
Schlueter Langdon, C., & Sikora, R. (2020). Creating a
Data Factory for Data Products. In K. R. Lang, J. Xu,
B. Zhu, X. Liu, M. J. Shaw, H. Zhang, & M. Fan (Eds.),
Lecture Notes in Business Information Processing.
Smart Business: Technology and Data Enabled
Innovative Business Models and Practices (Vol. 403,
pp. 43–55). Springer International Publishing.
https://doi.org/10.1007/978-3-030-67781-7_5
Shankaranarayanan, G., & Blake, R. (2017). From Content
to Context: The Evolution and Growth of Data Quality
Research. Journal of Data and Information Quality,
8(2), 1–28. https://doi.org/10.1145/2996198
Sultana, S., Akter, S., & Kyriazis, E. (2022). Theorising
Data-Driven Innovation Capabilities to Survive and
Thrive in the Digital Economy. Journal of Strategic
Marketing, 1–27. https://doi.org/10.1080/0965254
X.2021.2013934
Wand, Y., & Wang, R. Y [Richard Y.] (1996). Anchoring
data quality dimensions in ontological foundations.
Communications of the ACM, 39(11), 86–95.
https://doi.org/10.1145/240455.240479
Wang, R. Y [R. Y.], Storey, V. C., & Firth, C. P. (1995). A
framework for analysis of data quality research. IEEE
Transactions on Knowledge and Data Engineering,
7(4), 623–640. https://doi.org/10.1109/69.404034
Wang, R. Y [Richard Y.], & Strong, D. M. (1996). Beyond
Accuracy: What Data Quality Means to Data
Consumers. Journal of Management Information
Systems, 12(4), 5–33. https://doi.org/10.1080/0742
1222.1996.11518099
Woodall, P. (2017). The Data Repurposing Challenge.
Journal of Data and Information Quality, 8(3-4), 1–4.
https://doi.org/10.1145/3022698
DATA 2025 - 14th International Conference on Data Science, Technology and Applications
338
