
Explainable Assessment Model for Digital Transformation Maturity
Jihen Hlel
a
, Nesrine Ben Yahia
b
and Narj
`
es Bellamine Ben Saoud
c
RIADI Laboratory, National School of Computer Sciences, Manouba, Tunisia
Keywords:
Digital Transformation, Maturity, Assessment, Machine Learning, Explainability, Organizations.
Abstract:
Digital transformation has become a critical factor for organizational success in the modern business land-
scape. However, effectively and automatically assessing the maturity of this transformation remains a signifi-
cant challenge. In this paper, we address the need for a unified and explainable digital maturity model to guide
organizations in their transformation journey. Our primary research questions focus on the development of a
core digital maturity model, the automatic validation of its effectiveness, and its explainability. To this end,
we propose a core model composed of seven key dimensions (Technology, Strategy, Skills, Culture, Organi-
zation, Data, and Leadership) derived from an extensive literature review. Each dimension is assessed across
five maturity levels (Basic, Discovery, Developed, Integrated, and Leadership). We then validate the proposed
model by leveraging machine learning techniques to assess its applicability within organizations. Finally, we
introduce an ensemble learning approach that combines unsupervised and supervised learning methods to en-
hance the explainability of the proposed digital maturity model. This approach aims not only to assess but also
to elucidate the impact of different dimensions on digital maturity.
1 INTRODUCTION
In today’s business world, digital transformation (DT)
has become a key focus in both information systems
research and business practice, with 84% of global
companies considering it as critical to their survival
in the next five years (Van Veldhoven and Vanthienen,
2022). Going digital is becoming a necessity as a
study in 2011 done by MIT Center for Digital Busi-
ness and Capgemini Consulting emphasized compa-
nies face common pressures from customers, com-
petitors, and employees to initiate their DT (McAffee
et al., 2011). According to the McKinsey research re-
port in 2018, the current success rate for DT in enter-
prises is only 30 % (McKinsey and company, 2018).
This is due to the fact that DT is a complex system
engineering, which is affected by the interaction of
many factors to jointly promote the success of such
transformation. Thus, while navigating the complexi-
ties associated with the DT, managers find themselves
overwhelmed by the range of possible dimensions to
consider (Kiron, 2016).
Significant progress has been made in understand-
ing DT, with growing research on its driving factors.
a
https://orcid.org/0000-0003-2753-7070
b
https://orcid.org/0000-0003-4788-4475
c
https://orcid.org/0000-0002-8071-0189
Still, a structured perspective is essential to effectively
guide DT efforts (Neff, 2014). As a result, organiza-
tions require tailored guidance to navigate their DT
journeys and assess their current level of digital ma-
turity (DM). Hence, the need for an effective man-
agement of the stages of DT requires that digital ma-
turity models (DMMs) to be put into practice (Thord-
sen et al., 2020). DM provides an accurate projection
of a company’s DT progress; it assesses the impact of
such transformation, making it essential to measure
the company’s current position. It evolves with the
ever-changing digital landscape (Akdil, 2017). There-
fore, firms must continuously assess their maturity to
adapt effectively in this dynamic environment. Such
assessments are crucial and depend on models that
provide reference frameworks, incorporating evalua-
tion criteria and indicators. In this context, the main
research questions explored in this paper are:
(1) How to build a core DMM for an efficient and rel-
evant DM assessment?
(2) How to automatically validate the core model?
(3) How can the core model be interpreted and made
explainable?
The structure of the paper is as follows: first, we con-
duct a comprehensive literature review to explore the
current state of knowledge, including key concepts
and DMMs in the field. Second, we identify exist-
310
Hlel, J., Ben Yahia, N., Ben Saoud and N. B.
Explainable Assessment Model for Digital Transformation Maturity.
DOI: 10.5220/0013459300003967
In Proceedings of the 14th International Conference on Data Science, Technology and Applications (DATA 2025), pages 310-317
ISBN: 978-989-758-758-0; ISSN: 2184-285X
Copyright © 2025 by Paper published under CC license (CC BY-NC-ND 4.0)
ing research gaps related to DT and DM. Next, we
present our core model for DM assessment. In the fol-
lowing section, we use machine learning (ML) tech-
niques to validate the proposed model. Finally, we
combine supervised and unsupervised learning meth-
ods to enhance its explainability.
2 BACKGROUND AND
RESEARCH GAP
DM refers to the scenario in which an organization
has successfully undergone a transformation (Akdil,
2017). It is not a static concept due to the digital
landscape change (Akdil, 2017). Thus, an organiza-
tion needs to assess it over time. In this context, ma-
turity models (MMs) are conceived as “frameworks
that evaluate the maturity of an organization through
the definition of a set of structured levels” (Battista
and Schiraldi, 2013). By examining the aspects of dif-
ferent MMs, common characteristics were extracted.
They consist of (a) maturity level, (b) descriptor for
each maturity level, (c) a generic description of each
level, (d) dimensions, (e) elements linked to corre-
sponding dimensions, and (f) a description of each el-
ement for each level of maturity (Fraser et al., 2002).
Although numerous MMs have been proposed,
several factors contribute to their limitations in effec-
tively assess an organization’s DT (Akdil, 2017). For
instance, many studies focus on specific regions and
sectors and rely on diverse but potentially insufficient
sample sizes. Additionally, the complexity of validat-
ing these models often necessitates third-party assis-
tance, such as consultants, which increases costs and
extends the time required for evaluations. In fact, val-
idation of these models is frequently based on litera-
ture reviews or expert interviews, with minimal em-
pirical evidence provided to substantiate their effec-
tiveness. Moreover, a critical limitation of existing
models is their lack of explainability. While they may
provide an assessment of DM, they do not articulate
the reasoning behind their conclusions. This opac-
ity makes it difficult for organizations to understand
why certain results are obtained or to derive action-
able insights from the evaluation. Without explain-
ability, organizations face challenges in building trust
in the assessment process and aligning the findings
with strategic decision-making. In this paper, we ad-
dress these issues to develop an effective and action-
able model that can better support organizations in
navigating their DT.
3 THE PROPOSED CORE
MATURITY MODEL
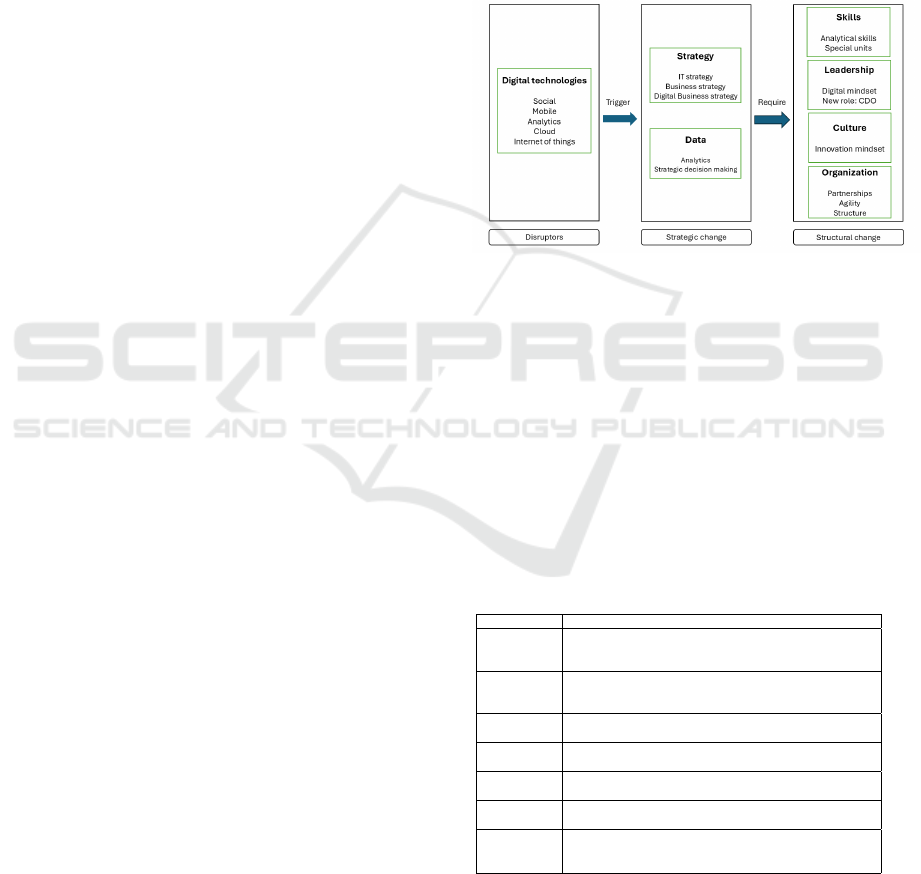
The proposed MM (Figure 1) serves as a core model
with the minimum and sufficient dimensions for a rel-
evant and efficient DM assessment. This study first
undertakes a deep and up-to-date literature review, to
develop a core holistic DMM that unifies the previ-
ous ones and covers several aspects of an organiza-
tion’s DT. The model is also generic built from multi-
ple models from different sectors.
Figure 1: The proposed core DT maturity model.
3.1 The Dimensions of Proposed
Maturity Model
As a basis for creating the core model, a review of the
current literature on MMs was conducted. It involved
a comparative analysis of several established mod-
els to assess the key dimensions crucial for achiev-
ing successful DT. The review led to the selection of
seven core dimensions including technology, strategy,
skills, leadership, culture, the organization, and data.
Table 1 summarizes some of the existing models.
Table 1: Existing digital maturity models.
Dimension Reference
Technology (Foundation, 2023),(Tubis, 2023),(Khourshed et al., 2023),
(Al-Ali and Marks, 2022), (van Tonder et al., 2024),(Kalender
and
ˇ
Zilka, 2024)
Strategy (Foundation, 2023), (Tubis, 2023), (Khourshed et al.,
2023),(Al-Ali and Marks, 2022), (van Tonder et al.,
2024),(Kalender and
ˇ
Zilka, 2024)
Skill (Spaltini et al., 2022),(Khourshed et al., 2023), (Al-Ali and
Marks, 2022), (van Tonder et al., 2024)
Culture (Tubis, 2023),(
´
Avila Boh
´
orquez and Gil Herrera, 2022), (van
Tonder et al., 2024),(Kalender and
ˇ
Zilka, 2024)
Organization (Foundation, 2023), (Khourshed et al., 2023),(van Tonder
et al., 2024)
Data (Foundation, 2023),(Tubis, 2023),(
´
Avila Boh
´
orquez and
Gil Herrera, 2022),(Khourshed et al., 2023)
Leadership (
´
Avila Boh
´
orquez and Gil Herrera, 2022), (Khourshed
et al., 2023),(Al-Ali and Marks, 2022), (van Tonder et al.,
2024),(Kalender and
ˇ
Zilka, 2024)
Explainable Assessment Model for Digital Transformation Maturity
311

3.1.1 Digital Technologies
The emergence of digital technologies mentioned
with the popular SMACIT have triggered DT as mate-
rial antecedents (Vial, 2019). The literature describes
digital technologies as inherent disrupters of the DT
wave (Vial, 2019). They shape it due to their specific
characteristics, referred to as digital properties. DT
starts with the adoption of digital technologies, then
evolving into an implicit holistic reshape of an orga-
nization, or deliberate pursuit of value creation (Vial,
2019).
3.1.2 Strategy
DT is depicted as a phenomenon that demands a
rapid organizational response. Although the con-
cept of strategy is often invoked to explain these re-
sponses, some researchers supported the traditional
view which refers to the IT strategy as a subordinated
functional-level strategy that must be aligned with the
firm’s business strategy. Others argue that strategic
responses require two novel concepts in line with the
DT: digital business strategy, which reflects a fusion
between IT and business strategy, and DT strategy
which is not part of any other strategy (Jimmy Bu-
mann, 2019).
3.1.3 Skills
Prior research shows that human factors can signifi-
cantly impact DT capacity (Kwon, 2017). Employee
skills positively moderate the relationship between or-
ganizational capabilities and the success of DT. DT
requires employees to depend more heavily on their
analytical skills to solve increasingly complex busi-
ness problems (Dremel, 2017). The survey done by
MIT Center for Digital Business and Capgemini Con-
sulting in 2011, reveals that some IT departments
have established special units to track emerging tech-
nology skills and innovation centers to go with the
digital disruption impact.
3.1.4 Leadership
In line with the DT, organizational leaders must en-
sure that their organizations develop a digital mind-
set to be capable of responding to the disruptions as-
sociated with the use of digital capabilities (Haffke,
2017). To that end, the literature highlights the cre-
ation of new leadership roles (Horlacher, 2016) as the
chief digital officer (CDO). The role of the CDO is
to implement digital business strategy into a series of
concrete actions.
3.1.5 Culture
Most of the firms that have initiated the DT often ex-
perience failures due to inert organizational cultures
that resist change (Hartl, 2017). Yet, a suitable or-
ganizational culture is a key requirement for the suc-
cessful transformation of businesses.
3.1.6 Organization
(Berghaus, 2017) considers partnerships and ecosys-
tems an important element of this dimension. Hence,
organizations must embrace a collaborative and
partnership-driven approach by actively emerging and
fusing organizational and IS strategy together to pur-
sue respectful relationships with various stakehold-
ers. While initially seen as competitors, partner-
ships should leverage each other’s strengths to meet
increasing customer needs. According to (Udovita,
2020), this dimension also encompasses the organi-
zation’s agility, which refers to its ability to respond
quickly to changes. Here, organizations should move
away from traditional hierarchies and embrace leaner
and flatter organizational structures (Vial, 2019).
3.1.7 Data
Data has a decisive role in the DT journey. The
broad literature outlines that even strategic decision-
making will be based on data-driven insights (Haffke,
2017). Furthermore, firms are engaging in analytics
and combining with integrated data to gain a strategic
advantage over competitors. As a consequence, orga-
nizations are compelled to enhance their proficiency
in harnessing and leveraging data. Moreover, they can
maximize the advantages of technologies by gather-
ing data and using the derived insights to anticipate
customer behavior.
3.2 Maturity Levels of Our Model
For the assessment of DM related to each dimen-
sion, we define a five-level maturity scale: 1—ba-
sic, level 2—discovery, level 3—developed, level
4—integrated, and level 5—leadership inspired from
(Tubis, 2023). A detailed description of the assess-
ment levels is presented in Table 4 in the appendix.
4 DATA-DRIVEN VALIDATION
OF THE PROPOSED MM
In order to validate the proposed model, we rely on
data-driven approaches. Thus, empirical evidence
DATA 2025 - 14th International Conference on Data Science, Technology and Applications
312
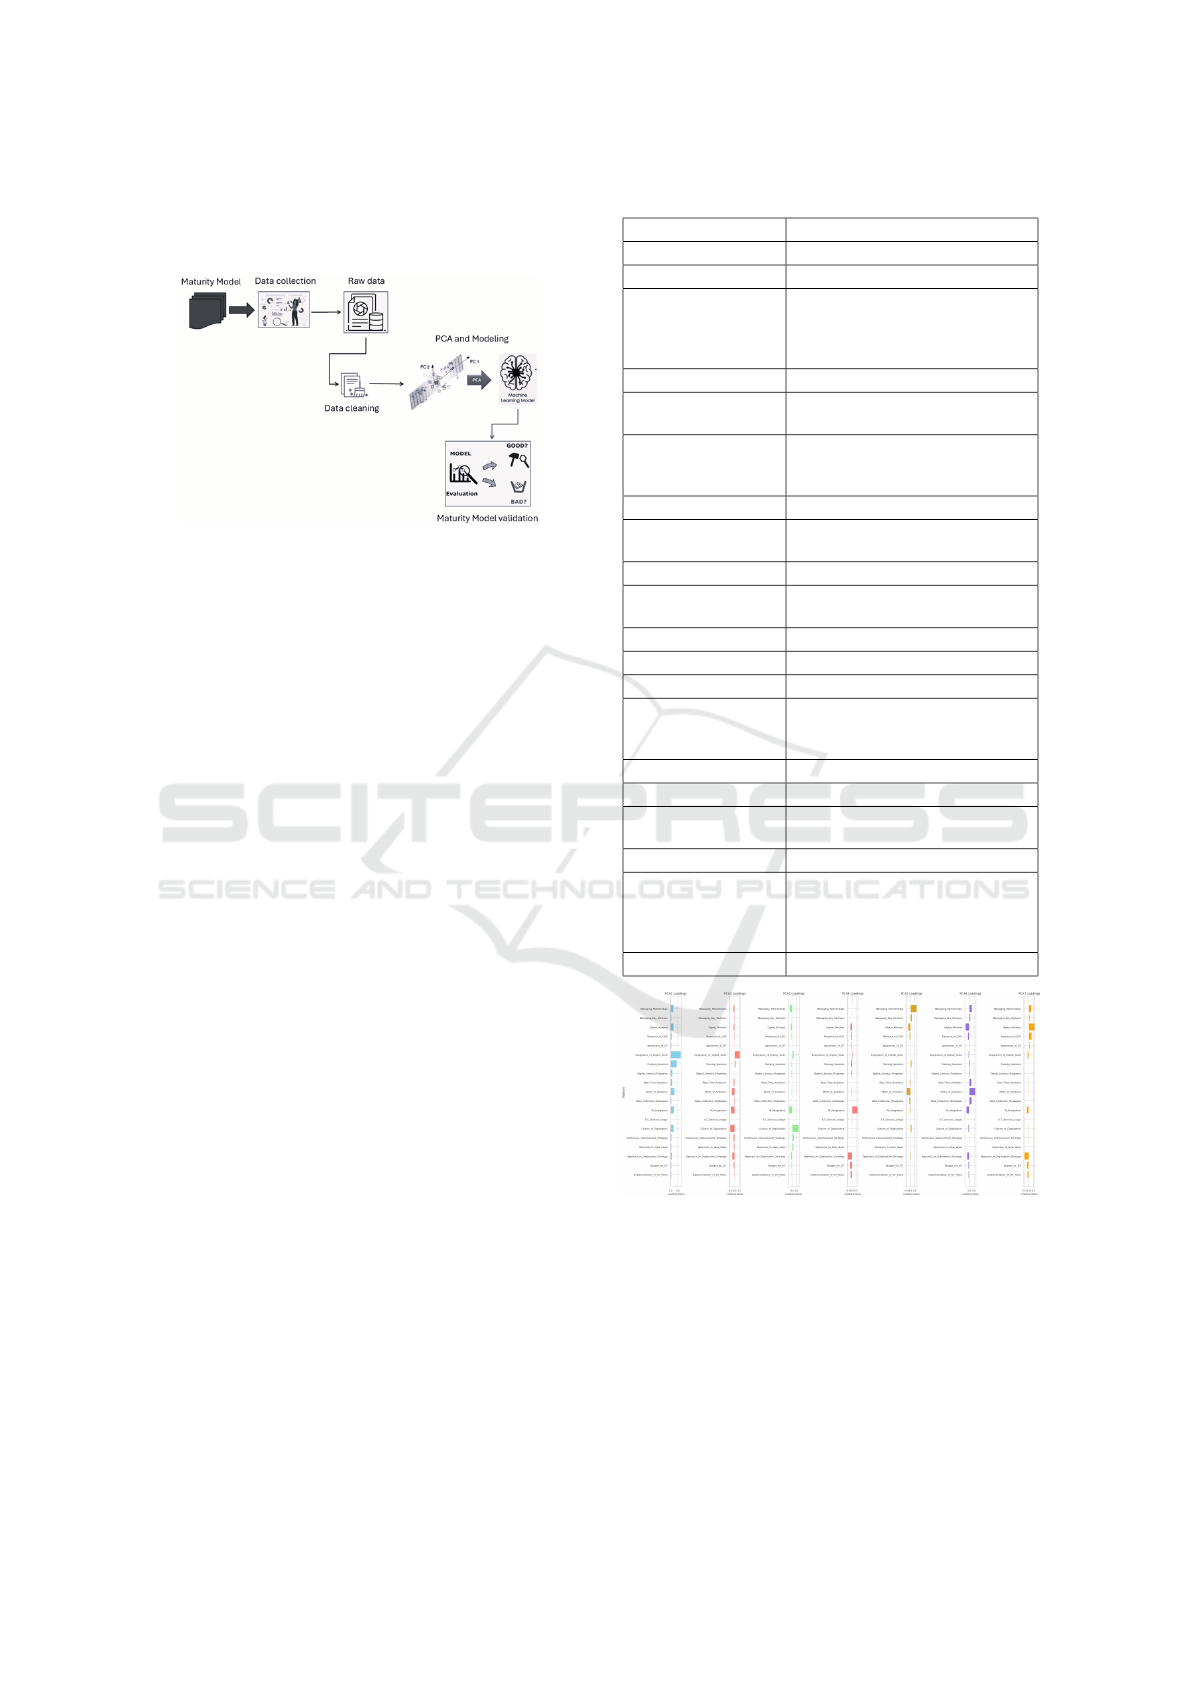
will be provided based on real data collected through
an assessment survey. The process from data collec-
tion to the model validation is presented in Figure 2.
Figure 2: Model validation approach.
4.1 Data Acquisition and Interpretation
Our MM is structured around seven dimensions each
is mapped to the criterion at each level according to
the degree of maturity. Individual areas and sub-areas
are assessed on five levels. The general characteris-
tics of individual levels are presented in Table 2. This
mapping is then used to produce a questionnaire filled
out by employees at the management level, which
is later carried out to assess organizational maturity
level and collect the necessary data. After collecting
216 survey responses, the data was compiled into a
structured tabular dataset. Our proposed scoring sys-
tem uses Python-defined functions to compute DM
scores for each dimension—stored as new features in
the dataset—and calculates the overall maturity level
as the average of these dimension scores based on or-
ganizational responses. Our final dataset features and
their definition are shown in Table 2.
4.2 Principal Component Analysis
In our study, we rely on principal component analy-
sis (PCA) to extract important insights from the col-
lected data, to do so it is crucial to, first, determine
how many principal components (PC) to select. The
elbow test, is used to identify the best number of com-
ponents (Abdi and Williams, 2010). It suggests using
7 PCs, which explain nearly 80% of the total variance.
In Figure 4 we plot the loading of each feature on
every PC. PC1, dominated by features like Integration
of Digital Skills (0.701), Training Sessions (0.416),
and Mode of Analytics (0.270), represents organiza-
tional DM. PC2 captures a trade-off between skills in-
tegration (0.546) and factors like Culture of Digitiza-
tion (-0.491) and AI Integration (-0.391), highlighting
a tension between skill-building (0.546) and techno-
Table 2: Dataset description.
Features Definition Domains in the survey
Implementation of DT Plans Yes, No
Budget for DT Yes, No
Approach to Digitization
Strategy
Business development is driven by the digiti-
zation strategy, implementing and optimizing
its practices; Business development is driven
by the digitization strategy
Openness to New Ideas High, Low
Continuous Improvement
Strategy
Yes, No
Culture of Digitization Encourages advanced solutions, rewarding in-
novators; Promotes human-machine collabo-
ration with transparent risk management
ICT Devices Usage Yes, No
AI Integration M2M (machine-to-machine) deployed;
Cloud, IoT and AI; Cloud and IoT
Data Collection Strategies Yes, No
Mode of Analytics Descriptive; Descriptive, Predictive and Pre-
scriptive; Descriptive and Predictive
Real Time Analytics Yes, No
Digital Literacy Programs Yes, No
Training Sessions Planned, Random, Systematic
Integration of Digital Skills Enhances operational efficiency and collab-
oration; Continuously improves knowledge
sharing and skill development
Awareness of DT Yes, No
Presence of CDO Yes, No
Digital Mindset Strongly Defined, Fully Embedded, Clearly
Defined
Managing Key Partners Yes, No
Managing Partnerships Established partnerships contribute to opera-
tions; Fully integrated partnerships with real-
time data exchange; Personalized partnerships
with real-time data for decision-making
Overall Digital Maturity 1, 2, 3, 4, 5
Figure 3: PCA loadings.
logical or cultural factors (-0.491). PC3 is influenced
by Culture of Digitization (0.744), contrasting it with
AI-driven strategies (-0.384), while PC4 emphasizes
AI Integration (0.682). The later components, like
PC5 to PC7, represent more specific patterns, such
as partnerships, analytical capabilities, and strategic
alignment (Digital Mindset).
Explainable Assessment Model for Digital Transformation Maturity
313
4.3 Machine and Deep Learning
Algorithms for Model Validation
In our study, we explore machine and deep learn-
ing (DL) techniques for the validation of our model.
The idea is to evaluate the effectiveness of the model
in predicting actual outcomes. High prediction re-
sults suggest that the core model is valid and accu-
rate for DM assessment. Since our dataset is struc-
tured, recommended ML algorithms were explored
such as, K nearest neighbor (KNN), support vector
machine (SVM), decision tree, ensemble of decision
trees (random forest (RF) and extreme gradient boost-
ing (XGBoost)), and multiple layer perceptron (MLP)
(Yahia et al., 2021). In tabular data, relationships be-
tween features are often intricate and interdependent,
requiring the model to capture both local and global
patterns. Convolutional Neural Networks (CNNs)
(Mziou-Sallami et al., 2023) are suited for this task.
To effectively train them a large amount of data is re-
quired. Therefore, we used a data augmentation tech-
nique. This process expanded our dataset from 226 to
1000 records. Thus, we aim to validate the proposed
model not only on a small dataset but also on a larger
dataset to ensure its robustness and generalizability.
4.4 Results and Discussion
As mentioned above, we have applied KNN, SVM,
decision tree, RF, XGBoost, and MLP for small real
data, and CNN for augmented data. Table 3 shows the
obtained results.
Table 3: Performance evaluation results.
Algorithm Acc. Prec. Rec. F1
KNN 0.80 0.83 0.78 0.78
SVM 0.95 0.93 0.97 0.95
Decision Tree 0.66 0.62 0.65 0.62
RF 0.79 0.81 0.81 0.81
XGBoost 0.78 0.76 0.87 0.78
MLP 0.83 0.81 0.84 0.82
CNN 0.73 0.75 0.73 0.72
Combined, these metrics imply that the model ac-
curately captures underlying patterns in the data and
generalizes well. This underscores that our proposed
MM is accurate and can efficiently assess the DM.
In our study, we identified the minimal set of di-
mensions from the literature necessary for evaluat-
ing maturity and validated their sufficiency using ML
and DL algorithms. By systematically excluding fea-
tures representing specific dimensions, we observed a
significant drop in model accuracy meaning that the
evaluation of the digital maturity is no more optimal,
demonstrating that this minimal set is both essential
and optimal for assessing digital maturity without re-
quiring additional dimensions thus the evaluation of
the digital maturity is no more optimal.
5 EXPLAINABILITY OF THE
PROPOSED MATURITY
MODEL
Existing studies provide insights into the coverage of
dimensions within MMs, but they fail to address how
to explain their results. To bridge this gap, we sug-
gest using a decision tree algorithm to identify rules
derived from the outputs of a K-Means clustering al-
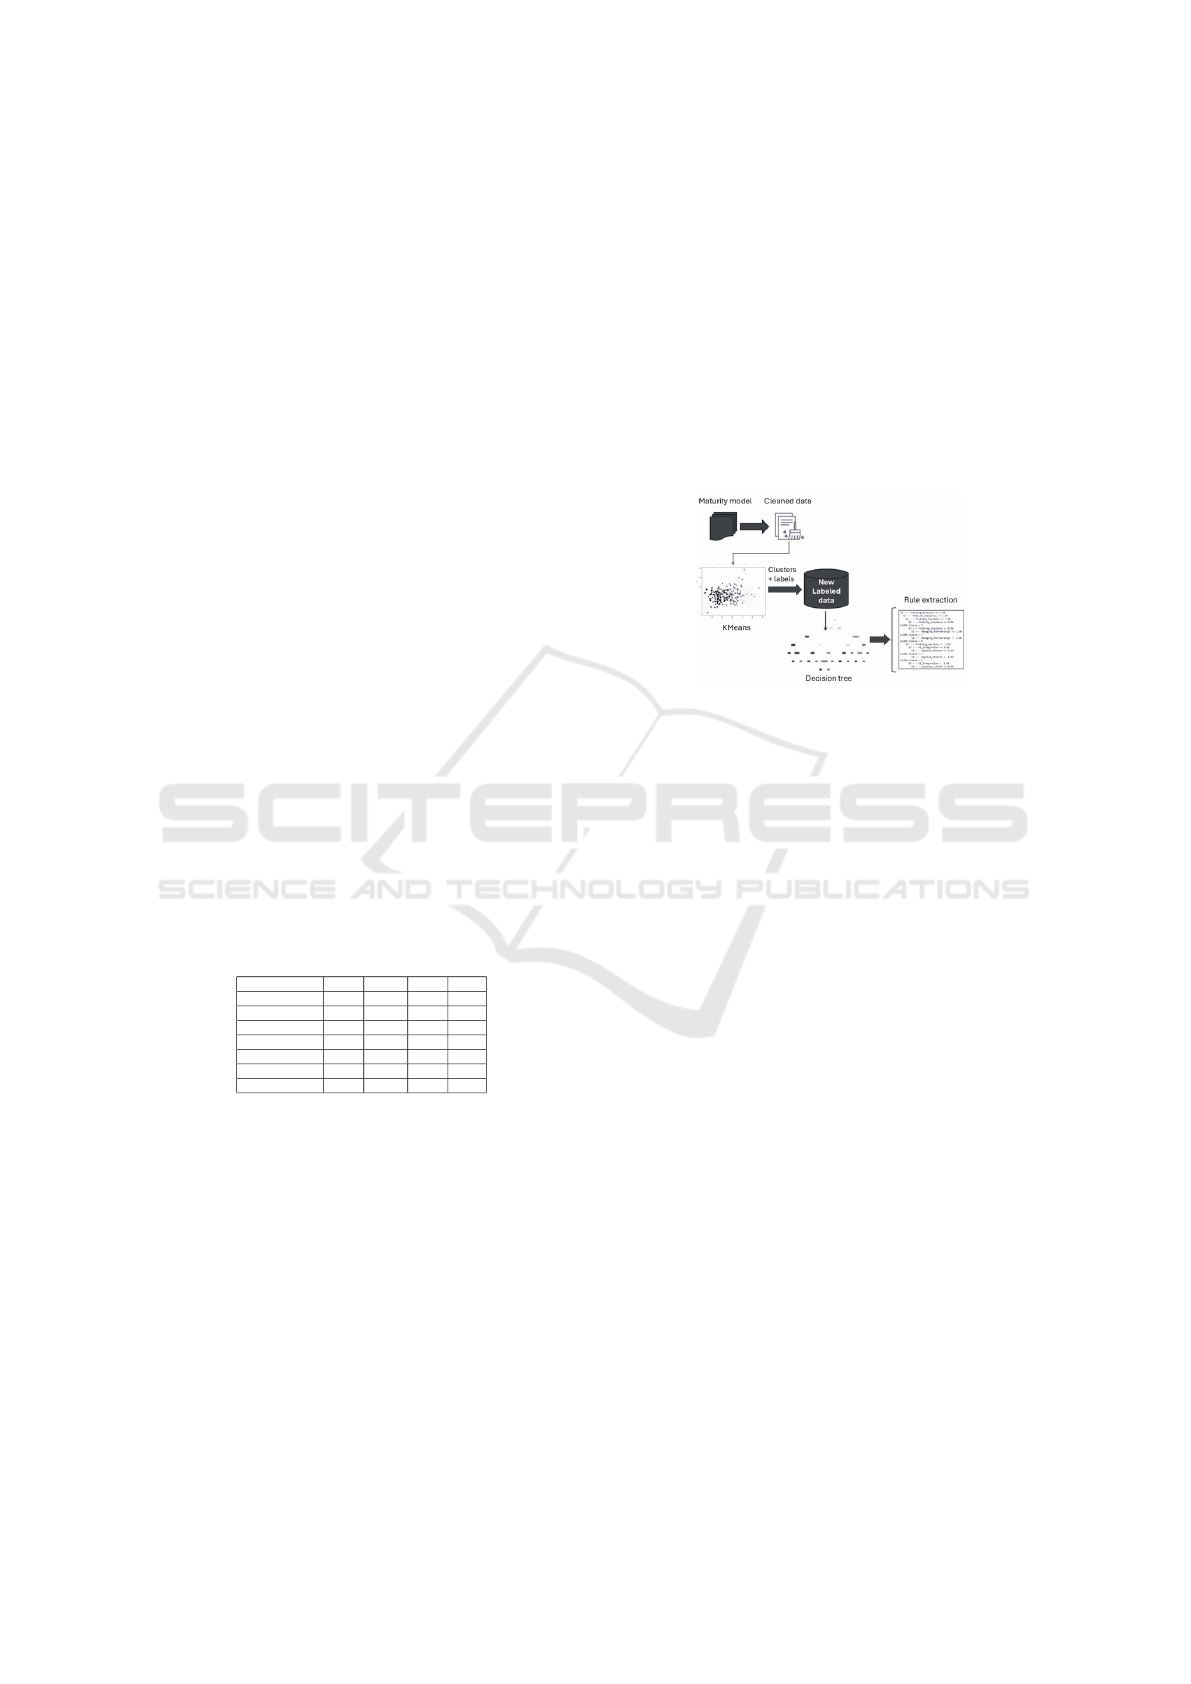
gorithm. By doing so, our approach (illustrated in
Figure 5) provides clear explanations for the clusters,
maintaining the interpretability of results.
Figure 4: Cluster-based-classification for maturity model
explainability.
Clustering offer a powerful tool for grouping or-
ganizations based on their maturity characteristics
(Wani, 2024). Ensuring that derived decisions can be
clearly understood is a fundamental requirement aim-
ing at making clustering results transparent and mean-
ingful. Thus, we enhanced our dataset with cluster la-
bels generated by k-means and subsequently applied
a decision tree classifier. By combining k-means’
capability to detect patterns with the decision tree’s
explainability, we intend to make the assessment in-
sightful. This approach was applied on both a small
and augmented dataset, underscoring that our primary
focus is not the validation of the data itself but the
evaluation of the pipeline and the core MM.
5.1 A Cluster-Based-Classification
Within Small Dataset
K-means require a predefined number of clusters (k),
therefore, the elbow method is used. It involves calcu-
lating the WCSS for a range of k values and plotting
WCSS against k. The optimal k is identified at the
elbow point, where the rate of WCSS decrease levels
off (Wani, 2024). Here, We got an ”elbow” at k=3.
Then, having applied k-means, we assigned the
resulting cluster labels to the data points, creating a
newly labeled dataset. Below are the rules derived
from the hybrid of the k-means and the decision tree
algorithm. Each rule highlights the conditions under
which a particular class (cluster) is predicted.
DATA 2025 - 14th International Conference on Data Science, Technology and Applications
314

Rules extracted from the decision tree within the
small dataset
1. Rule 1: If Training Sessions ≤ 2.50 and Mode of Analytics ≤ 1.50, then:
(a) If Training Sessions ≤ 1.50, then:
i. If Training Sessions ≤ 0.50: Class = 2.
ii. If Training Sessions > 0.50, then:
A. If Managing Partnerships ≤ 2.00: Class = 2.
B. If Managing Partnerships > 2.00: Class = 0.
(b) If Training Sessions > 1.50, then:
i. If AI Integration ≤ 1.50, then:
A. If Digital Mindset ≤ 1.50: Class = 2.
B. If Digital Mindset > 1.50: Class = 0.
ii. If AI Integration > 1.50, then:
A. If Awareness of DT ≤ 0.50, then:
B. If Approach to Digitization Strategy ≤ 1.50: Class = 2.
C. If Approach to Digitization Strategy > 1.50: Class = 0.
D. If Awareness of DT > 0.50: Class = 0.
2. Rule 2: If Training Sessions ≤ 2.50 and Mode of Analytics > 1.50, then:
(a) If Approach to Digitization Strategy ≤ 0.50, then:
i. If Training Sessions ≤ 1.50, then:
A. If AI Integration ≤ 3.50: Class = 2.
B. If AI Integration > 3.50: Class = 0.
ii. If Training Sessions > 1.50: Class = 0.
(b) If Approach to Digitization Strategy > 0.50, then:
i. If AI Integration ≤ 1.50, then:
A. If Culture of Digitization ≤ 0.50: Class = 2.
B. If Culture of Digitization > 0.50: Class = 0.
ii. If AI Integration > 1.50: Class = 0.
3. Rule 3: If Training Sessions > 2.50: Class = 1.
5.2 A Cluster-Based-Classification
Within Augmented Dataset
Even with augmented data, the elbow test remains ro-
bust, with k=3 .
Rules extracted from the decision tree within the
augmented dataset
1. Rule 1: If Training Sessions ≤ 2.50 and Mode of Analytics ≤ 1.50, then:
(a) If Training Sessions ≤ 1.50, then:
i. If Digital Literacy Programs ≤ 0.50: Class = 1.
ii. If Digital Literacy Programs > 0.50, then:
A. If Managing Partnerships ≤ 1.50: Class = 1.
B. If Managing Partnerships > 1.50, then:
C. If Data Collection Strategies ≤ 0.50: Class = 1.
D. If Data Collection Strategies > 0.50: Class = 2.
(b) If Training Sessions > 1.50, then:
i. If AI Integration ≤ 2.50, then:
A. If Managing Partnerships ≤ 2.50: Class = 1.
B. If Managing Partnerships > 2.50: Class = 2.
ii. If AI Integration > 2.50, then:
A. If Approach to Digitization Strategy ≤ 1.50, then:
B. If Awareness of DT ≤ 0.50: Class = 1.
C. If Awareness of DT > 0.50: Class = 2.
D. If Approach to Digitization Strategy > 1.50: Class = 2.
2. Rule 2: If Training Sessions ≤ 2.50 and Mode of Analytics > 1.50, then:
(a) If Implementation of DT Plans ≤ 0.50, then:
i. If Training Sessions ≤ 1.50, then:
A. If AI Integration ≤ 3.50, then:
B. If Managing Partnerships ≤ 2.50: Class = 1.
C. If Managing Partnerships > 2.50: Class = 2.
D. If AI Integration > 3.50, then:
E. If Digital Literacy Programs ≤ 0.50: Class = 2.
F. If Digital
Literacy Programs > 0.50: Class = 1.
ii. If Training Sessions > 1.50: Class = 2.
(b) If Implementation of DT Plans > 0.50, then:
i. If ICT Devices Usage ≤ 0.50, then:
A. If Continuous Improvement Strategy ≤ 0.50: Class = 1.
B. If Continuous Improvement Strategy > 0.50: Class = 2.
ii. If ICT Devices Usage > 0.50, then:
A. If Managing Key Partners ≤ 0.50, then:
B. If Mode of Analytics ≤ 2.50: Class = 1.
C. If Mode of Analytics > 2.50: Class = 2.
D. If Managing Key Partners > 0.50: Class = 2.
3. Rule 3: If Training Sessions > 2.50: Class = 0.
5.3 Findings Interpretation
The interpretation of the two generated rule bases re-
veal key insights into the DM. On the one hand, the
rules exposes the importance of core features such as
”training sessions”, ”mode of analytics”, and ”AI in-
tegration” in determining classes/ clusters which val-
idates the results obtained previously from the PCA.
They, also, offer practical implications by guiding or-
ganizations to address gaps in areas like ”data col-
lection” and ”partnership management” and empha-
sizing actionable steps that can enhance DM. On the
other hand, findings emphasize the scalability of our
MM, proving its adaptability to varying contexts. The
consistency of interpretable rules across original and
augmented datasets validates the framework’s robust-
ness, illustrating its capability to generate meaningful
assessments regardless of the dataset.
6 CONCLUSIONS
This paper presents a unified and explainable digital
maturity model. By focusing on seven key dimen-
sions, the model evaluates digital maturity across five
levels. A data-driven validation approach based on
machine learning has been used to validate the model.
Then, an ensemble learning approach combining un-
supervised and supervised methods is proposed to en-
hance the model’s effectiveness and explainability. As
organizations evolve, the dynamic nature of digital
maturity must be considered. Future work should fo-
cus on expanding the model to track organizational
changes over time, providing a continuous feedback
to optimize digital transformation efforts.
Explainable Assessment Model for Digital Transformation Maturity
315

REFERENCES
Abdi, H. and Williams, L. J. (2010). Principal component
analysis. Wiley interdisciplinary reviews: computa-
tional statistics, pages 433–459.
Akdil, K.Y.;Ustundag, A. C. E. (2017). Maturity and readi-
ness model for industry 4.0 strategy. Springer Series
in Advanced Manufacturing.
Al-Ali, M. and Marks, A. (2022). A digital maturity model
for the education enterprise. Perspectives: Policy and
Practice in Higher Education.
´
Avila Boh
´
orquez, J. H. and Gil Herrera, R. J. (2022). Pro-
posal and validation of an industry 4.0 maturity model
for smes.
Battista, C. and Schiraldi, M. M. (2013). The logistic matu-
rity model: Application to a fashion company. Int. J.
Eng. Bus. Manag, 5.
Berghaus, S., B. A. . K. B. (2017). Digital maturity & trans-
formation report. St.Gallen.
Dremel, C., W. J. H. M. W. J.-C. B. W. (2017). How audi
ag established big data analytics in its digital transfor-
mation. MIS Quart.Execut.
Foundation, I. (2023). Industry 4.0 readiness on-
line self-check for businesses. https://www.
industrie40-readiness.de/?lang=en (accessed on 10
January 2025).
Fraser, P., Moultrie, J., and Gregory, M. (2002). The use of
maturity models/grids as a tool in assessing product
development capability. In IEEE international engi-
neering management conference, pages 244–249.
Haffke, I., K. B. . B. A. (2017). The transformative role of
bimodal it in an era of digital business. proceedings
of the 50th Hawaii international conference on system
sciences.
Hartl, E., . H. T. (2017). The role of cultural values for
digital transformation: Insights from a delphi study.
Americas Conference on Information Systems.
Horlacher, A., H. T. (2016). What does a chief digital officer
do? managerial tasks and roles of a new c-level posi-
tion in the context of digital transformation. In: Sys-
tem Sciences 49th Hawaii International Conference.
Jimmy Bumann, M. K. P. (November 2019). Action fields
of digital transformation - a review and comparative
analysis of digital transformation maturity models and
frameworks. In book: Digitalisierung und andere In-
novationsformen im Management.
Kalender, Z. T. and
ˇ
Zilka, M. (2024). A comparative analy-
sis of digital maturity models to determine future steps
in the way of digital transformation. Procedia Com-
puter Science, pages 903–912.
Khourshed, N. F., Elbarky, S. S., and Elgamal, S. (2023).
Investigating the readiness factors for industry 4.0
implementation for manufacturing industry in egypt.
Sustainability, page 9641.
Kiron, D.; Kane, G. P. D. P. A. B. N. (2016).
Does it pay to be a multinational? a large-
sample, cross-national replication assessing the multi-
nationality–performance relationship. MIT Sloan
Manag.Rev, 58.
Kwon, E.H.; Park, M. (2017). Critical factors on firm’s dig-
ital transformation capacity: Empirical evidence from
korea. Int. J. Appl. Eng.
McAffee, A., Ferraris, P., Bonnet, D., Calm
´
ejane, C., and
Westerman, G. (2011). Digital transformation: A
roadmap for billion-dollar organizations. MIT Sloan
Management Review.
McKinsey and company (2018). Unlocking success in dig-
ital transformations. McKinsey and company.
Mziou-Sallami, M., Khalsi, R., Smati, I., Mhiri, S., and
Ghorbel, F. (2023). Deepgcss: a robust and explain-
able contour classifier providing generalized curvature
scale space features. Neural Computing and Applica-
tions, 35(24):17689–17700.
Neff, A.A., H. F. H. T. U. F. B. W. v. B. J. (2014). Devel-
oping a maturity model for service systems in heavy
equipment manufacturing enterprises. Inf. Manag,
page 895–911.
Spaltini, M., Acerbi, F., Pinzone, M., Gusmeroli, S., and
Taisch, M. (2022). Defining the roadmap towards in-
dustry 4.0: the 6ps maturity model for manufacturing
smes. Procedia CIRP, pages 631–636.
Thordsen, T., Murawski, M., and Bick, M. (2020). How to
measure digitalization? a critical evaluation of dig-
ital maturity models. In Responsible Design, Im-
plementation and Use of Information and Communi-
cation Technology: 19th IFIP WG 6.11 Conference
on e-Business, e-Services, and e-Society, I3E 2020,
Skukuza, South Africa, April 6–8, 2020, Proceedings,
Part I 19, pages 358–369.
Tubis, A. A. (2023). Digital maturity assessment model for
the organizational and process dimensions. Sustain-
ability, page 15122.
Udovita, P. (2020). Conceptual review on dimensions of
digital transformation in modern era. International
Journal of Scientific and Research Publications, pages
520–529.
van Tonder, C., Bossink, B., Schachtebeck, C., and
Nieuwenhuizen, C. (2024). Key dimensions that mea-
sure the digital maturity levels of small and medium-
sized enterprises (smes). Journal of technology man-
agement & innovation, pages 110–130.
Van Veldhoven, Z. and Vanthienen, J. (2022). Digital
transformation as an interaction-driven perspective
between business, society, and technology. Electronic
markets, pages 629–644.
Vial, G. (2019). Understanding digital transformation: A
review and a research agenda. Journal of Strategic
Information Systems, pages 118–144.
Wani, A. A. (2024). Comprehensive analysis of clustering
algorithms: exploring limitations and innovative solu-
tions. PeerJ Computer Science.
Yahia, N. B., Hlel, J., and Colomo-Palacios, R. (2021).
From big data to deep data to support people analytics
for employee attrition prediction. Ieee Access, pages
60447–60458.
DATA 2025 - 14th International Conference on Data Science, Technology and Applications
316

APPENDIX
Table 4: Digital maturity assessment levels.
Basic Discovery Developed Integrated Leadership
Strategy
The organization
has prepared
assumptions for the
DT implementation
or has implemented
an initial plan
with specific
highlights.
The organization
has an implemented
strategy for digitization
and assesses its
effeciency through
analyses.
Managers and consultants
notify the readiness for
starting digital changes.
The organization has a
devoted budget for
DT. Employees at all
levels of the organization
are engaged in the
DT processes.
Business development is
drived by the digitization
strategy.
The organization conduted
systematic risk assessment
concerning DT.
The organization
implements practices of
digitization strategies
and optimizes
them.
Culture
Change management is
supported by employees’
openness and the
assisstance
of managers in
implementing new ideas
and innovations
The organization has
adopted a continuous
improvement strategy and a
change management system.
Employees are kept
informed about the risks
and changes associated
with digitization.
Advanced solutions
are fostered in the
organization, and their
owners are awarded.
Employees benefit from
a support in risk
management related to
digitization.
The organization
worked with a
culture open to
digitization and use
of new technologies.
Employees agree with
the coorporaton with
active human-machine .
The organization applies
optimal practices to
cultivate a culture of
collaborative
human-machine
interaction,
arising from transparent
risk management
regarding digitization.
Technology
The organization uses
information and
communication
technology for
horizontal and
vertical integration
in the internal
value chain. It also
uses mobile devices
for communication
among employees.
The organization
uses sensors
for data collection and
operation monitoring,
in addition to cloud
computing to save
and share data.
The organization
exploit the Internet
of Things for device
connection and data
transfer among them.
The organization
uses autonomous
devices to help
in decision making,
and AI to optimize
processes.
A machine-to-machine
communication
system (M2M) is deployed
to allow devices to
interact autonomously.
Data
The organization
collected data
periodically without
a clear strategy.
Basic standards are
developed for data
collection and
share at least
manually and
insights are realised
sporadically.
The organization
implemented a data
management strategy
supported by advanced
tools (data life cycle
management and
data quality).
Basic descriptive
analytics are used.
A clear data strategy
has been established.
The organization has
automated data
collection and
distribution,
including the automatic
generation of reports
sent to relevant
managers.
Descriptive and
diagnostic analytics
are used.
Data strategy is well
-established and aligns
closely with the
strategic goals of
the organization.
The organization has
deployed a data
integration platform,
to guarantee real-time
data access.
Predictive analytics are
integrated into business
processes
The organization
completely integrates
data as a core strategic
asset into culture
and operations.
The organization
use real-time and
automated transfer
of data between the
existing systems.
Prescriptive analytics
are used to provide
actionable
recommendations for
business outcomes
enhancement.
Skills
The organization
provides its employees
with training sessions
to enhance their
digital skills
(e.g., assistance
for novel digital
solutions, data
analytics,...).
Employees imrpove
their data analytical
and analyses skills.
A plan for acquiring
and developing digital
skills for employees
and managers has also
been in place.
The organization
has implemented a
systematic knowledge
management and
employee development
strategy using analytical
tools for its
implementation.
The required skills
related to DT and an
cross-disciplinary
mindset are ubiquitous
which covers the
whole levels
of management.
The organization
implements the best
practices of knowledge
management and
employee development.
Leadership
There is little
awareness or
understanding
of DT within
leadership.
There is no assigned
leader in charge of
riding digital initiatives.
Few leaders are
starting to understand
the necessity for a digital
mindset.Initial steps are
being taken to clarify
the responsibilities
of a CDO.
A digital mindset
is clearly defined and
articulated within the
leadership team.
A CDO is formally
appointed with a
clear mandate to
drive and
coordinate DT
efforts.
Leadership shows a
strong digital mindset,
using data-driven
decision making and
a culture of
innovation and
continuous improvement.
The CDO role
is well-established
and integrated
into the executive
leadership team.
The digital mindset
is fully embedded within
the leadership and
organizational culture.
The CDO role evolves
into a central
strategic function,
driving DT.
Organization
Collaboration with
partners is ad hoc
and unstructured.
There is minimal
inetgration with
business partners
and information
exchange is limited.
Organization is rigid
to change and its
structure is hierarchical
and siloed.
There is basic processes
for managing
relationships
with key partners.
Some processes have
been adjusted to allow
for quiker changes.
Inititives to improve
croos-functional
communication and
collaboration.
Key business partners
are informationally
integrated with some
of the processes
carried out as part of
the organization.
The organizational
structure include clear
roles and
responsabilities.
The cooperation of the
organization with
business partners is
individualized and
managed based on
analyses and infor
-mation integration, as
well as data available
in real-time.
There is a systematic
approach to respond
to changes and the
organizational structure
is flexible and supports
dynamic reconfiguraton.
Partnerships are fully
integraed, there is a
continuous xchange of
real-time data.
The organization exhibits
peak agility, with optimized
processes for responsiveness
and innovation optimized
The organizational structure
is highly fluid and adaptive
Explainable Assessment Model for Digital Transformation Maturity
317
