
Citation Steadiness Analysis with GraphSAGE Approach
Renata Avros
*a
, Dvora Toledano Kitai
b
and Zeev Volkovich
c
Software Engineering Department, Braude College of Engineering, Snonit st., Karmiel, Israel
Keywords: Citation Manipulation, Network Perturbations, GraphSAGE Algorithm.
Abstract: Citation manipulation occurs when references are deliberately included in academic works for reasons
unrelated to their genuine scholarly merit. Instead of serving their primary purposes—such as supporting
arguments, providing context, or guiding readers—these citations are often utilized to inflate metrics like
citation counts artificially. Manipulated citations tend to deviate from the standard patterns and structures
found in authentic citation networks. Consequently, when such networks are perturbed by removing certain
nodes or connections, these manipulated citations are more likely to exhibit inconsistencies. This paper
introduces a method for detecting citation manipulation by studying how citation patterns change under
random perturbations of the citation graph. The method employs the GraphSAGE algorithm to generate
embeddings of the altered graph in an Euclidean space, thereby reconstructing the removed edges. The
approach assumes that legitimate citations are bolstered by a network of indirect connections, leading to
closely related embeddings for nodes linked by authentic citations that facilitate the accurate prediction of
missing edges. By iteratively perturbing the graph and assessing the accuracy of edge reconstruction, the
method highlights suspected manipulated citations, which consistently exhibit poor reconstruction
performance, signifying supposed anomalous comportment. Numerical experiments validate the effectiveness
of this approach in identifying anomalies within citation networks, highlighting its potential as a reliable tool
for enhancing the integrity of scholarly communication.
1 INTRODUCTION
Citation consistency is a fundamental issue to
research integrity, as it directly impacts the reliability
and trustworthiness of scientific literature.
Inappropriate, particularly manipulated citations
often occur in scientific literature when references are
deliberately included in academic works for reasons
other than genuine scholarly merit. Instead of
supporting arguments, providing background, or
guiding readers, these citations are predominantly
used to escalate metrics like citation counts
artificially. This practice is frequently employed to
enhance the perceived impact and prestige of
researchers, journals, or institutions and has
significant detrimental effects, eroding the core
principles of academic discourse: accuracy,
objectivity, and scientific integrity.
a
https://orcid.org/0000-0001-9528-0636
b
https://orcid.org/0009-0002-1923-3640
c
https://orcid.org/0000-0003-4636-9762
*
Corresponding author
The paper (Prabha, 1983) emphasizes the scale of this
subject, indicating that more than two-thirds of
references in a typical paper may be superfluous,
underscoring the widespread occurrence of
questionable citation practices. Others (Fong and
Wilhite, 2017) explore unethical practices in
scholarly publishing, focusing on honorary
authorship and coercive citation. The study exposes
the widespread prevalence of these manipulative
practices across various academic disciplines such
that a significant number of respondents reported
instances of including honorary authors in their
research projects and facing pressure to incorporate
unnecessary citations.
Common schemes to increase citation amount
described by (Jacobes, 2016), (Falaga ang Alexiou,
2008), (Wilhite, Fong and Wilhi, 2019), and
(Ioannidis and Thombs, 2019), include:
• Self-Citation Clusters: Excessive self-citation to
heighten personal citation counts.
Avros, R., Kitai, D. T., Volkovich and Z.
Citation Steadiness Analysis with GraphSAGE Approach.
DOI: 10.5220/0013455600003967
In Proceedings of the 14th International Conference on Data Science, Technology and Applications (DATA 2025), pages 769-777
ISBN: 978-989-758-758-0; ISSN: 2184-285X
Copyright © 2025 by Paper published under CC license (CC BY-NC-ND 4.0)
769

• Mutual Citation Agreements (citation cartels):
Groups of researchers or journals decide to cite
each other's work or publish special issues with
highly cited specific articles.
• Citation Stacking: Journals citing their own
articles to inflate impact factors.
• Inclusion of Irrelevant Citations: Referencing
unrelated works to benefit cited authors or
journals.
• Strategic publication: Publishing articles likely
to receive disproportionate attention (e.g.,
reviews or editorials).
These manners distort evaluations of academic
performance and the significance of scholarly
contributions, erode the trustworthiness of academic
publishing, and mislead stakeholders, including
researchers and funding bodies. Manipulation also
impacts younger researchers by promoting shortcuts
over developing rigorous scholarly habits. They
undermine the integrity of citation systems and
scholarly evaluation systems. To combat this issue,
the academic community needs stricter editorial
policies, promote transparent citation practices, and
employ advanced algorithms to detect anomalous
citation patterns.
Several surveys (Resnik, Gutierrez-Ford, and
Peddada, 2008), (Wilhite and Fong, 2012) and (Wren
and Georgescu, 2022) have been conducted to
explore the prevalence and characteristics of
reference list manipulation, underscoring the critical
need for attention to this issue.
Many studies reveal that manipulated citations
often deviate significantly from the established norms
and ethical standards of scholarly referencing.
Numerous authors have likened these citations to
rumours, emphasizing their tendency to propagate
without genuine relevance or merit. While we do not
delve into a comprehensive review of all studies cited
in these reviews, we briefly recall several.
Citation network analysis usually incorporates
three key aspects: the number of citations, the
structure of the citation network, and the topical
relevance reflected in citation relationships. The
Paper (Liu, Bai, Wang, et al., 2024) employs semantic
main path network analysis to generate a precise and
comprehensive understanding of domain evolution,
revealing more coherent development trajectories.
The article (Wren and Georgescu, 2022) presents
a combination of statistical techniques to identify
peculiar citation manners in academic articles to
uncover instances where authors might intentionally
manipulate reference lists to boost their citation
counts artificially.
Surveys cited in this paper have explored various
dimensions of reference list manipulation, such as the
prevalence of coercive citation practices. For
instance, the paper (Fong and Wilhite, 2017)
examines the frequency of pressure on authors to
include specific citations. A survey (Resnik,
Gutierrez-Ford, and Peddada, 2008) of 283 authors
reveals that a significant proportion (22.7%) had
experienced situations where a reviewer insisted on
including unnecessary references to their own work.
Furthermore, another survey by (Wilhite and Fong,
2012) reported that over 20% of respondents had
faced pressure from journal editors to include specific
citations.
The current study is built on the framework
introduced in (Avros, Keshet, Toledano Kitai.,
Vexler, and Volkovich, 2023), aiming to analyse
connections within a citation graph by examining
their behavior under network perturbations using the
Node2Vec method (Grover and Leskovec, 2016)
employing a graph embedding technique designed to
capture node representations through random walks
within the graph. The underlying hypothesis suggests
authentic relationships within the graph are inherently
more robust to conceivable graph disruptions.
The presented research also operates on the
premise that manipulated or fraudulent citations
create irregularities in the citation network, making
them more prone to detection under specific network
perturbations. These anomalies are introduced
intentionally to boost publications' perceived impact
or credibility artificially. Such manipulation citations
diverge from the natural citation patterns and
structures within the network. As a result, when the
network undergoes perturbations, such as removing
specific nodes or edges, these anomalous citations are
more likely to exhibit detectable inconsistencies,
distinguishing them from legitimate citations.
Following this general standpoint, this paper
explores a method for detecting citation manipulation
by examining how citation patterns respond to the
random removal of elements from the citation graph.
The approach leverages the GraphSAGE algorithm
(Hamilton, Ying, and Leskovec, 2017) to generate
embeddings of the permuted graph in an Euclidean
space, thereby reconstructing the removed edges. The
underlying assumption is that legitimate citations are
supported by a robust network of indirect
connections, resulting in closely related embeddings
for nodes connected by genuine citations.
This proximity aids in accurately predicting the
missing edges. By systematically perturbing the
graph and evaluating the reconstruction accuracy, the
approach identifies manipulated citations, which tend
DMBDA 2025 - Special Session on Dynamic Modeling in Big Data Applications
770

to demonstrate poor reconstruction performance,
thereby revealing their anomalous nature. The
provided numerical experiments demonstrate that this
technique effectively identifies anomalies within
citation networks, supplying a valuable tool for
detecting citation manipulation.
The suggested approach in this paper, while
focusing on identifying "aberrant" citation patterns,
has inherent restrictions that can lead to inaccuracies,
especially when applied to multidisciplinary articles
or phenomena like "sleeping beauties”. A "sleeping
beauty" article receives minimal attention primarily
but later experiences a surge in citations due to
significant developments or rediscovery.
Additionally, mentions of ancient works by historical
figures like Newton and Archimedes often are uncited
due to their common knowledge, so citing such an
article can be comprehended as an anomaly.
Multidisciplinary articles integrating datasets and
methodologies from multiple fields pose another
challenge. One potential strategy is to match each
citation to its relevant dataset within its respective
domain, though alternative approaches may be
considered.
The manuscript proceeds as follows: Section 2
introduces the GraphSAGE model embedding.
Subsequently, Section 3 details the proposed model
for detecting citation manipulation. Experimental
evaluation is presented in Section 4, followed by a
summary and concluding remarks in Section 5.
2 GraphSAGE MODEL
EMBEDDING
GraphSAGE (Hamilton, Ying and Leskovec, 2017)
stands as a notable model in the realm of Graph
Convolutional Networks (GCNs), drawing
inspiration from the Weisfeiler-Lehman graph
isomorphism test to deliver advanced capabilities for
inductive representation learning on large and
dynamic graphs. Unlike transductive learning
methods, which rely on the entire graph being present
during training and inference, GraphSAGE is
uniquely suited for evolving graph structures and
scenarios where new nodes are introduced post-
training. One of the approach's core strengths lies in
its ability to harness rich node attributes—such as
user profiles in social networks, chemical properties
in molecular graphs, or bibliometric metadata in
citation networks—while also considering the
graph’s structural context. By aggregating
information from a node's local neighborhood, the
model generates embeddings that effectively capture
topological relationships and feature-based nuances,
enabling it to learn highly expressive node
representations.
A notable feature of GraphSAGE is its flexibility
in choosing aggregation functions, such as mean,
LSTM-based, or pooling, allowing practitioners to
tailor the model to the specific needs of their
applications. This versatility, efficiency, and
scalability have made GraphSAGE a cornerstone for
various graph-related tasks, such as Community
Detection, Node Classification, Link prediction, etc.
To aggregate feature information from a node's local
neighbourhood, including attributes like degrees or
textual features of neighboring nodes, GraphSAGE
employs a powerful and flexible framework, which
generates node embeddings through a forward
propagation process using learned model parameters.
This procedure iteratively gathers information from a
node's neighbors, combines it, and transforms it into
a compact and meaningful representation.
The algorithm describes a method for generating
node embeddings in a graph. It iteratively updates
node representations, starting with the graph and
initial node features. During each iteration, a node's
representation is updated by aggregating information
from its neighbours and merging it with its current
representation.
This merged information is passed through a
neural network layer to generate the updated
representation. Repeating this process for a fixed,
appropriately chosen number of iterations produces
final embeddings that capture local and global graph
structure.
Data:
• A graph 𝐺= (𝑉,𝐸), where 𝑉 is the set of
nodes, input features {𝑥
,∀𝑣 ∈ 𝑉}, and 𝐸 is
the set of edges.
• Feature matrix 𝑋∈ℝ
|
|
×
, where 𝑑 is the
dimension of node features.
• Aggregation function AGGREGATE.
• Number of layers 𝐾.
• Weight matrices 𝑊
for 𝑘 = 1,2,…,𝐾.
• Non-linearity 𝜎(⋅) (e.g., ReLU).
• Neighbourhood sampling size 𝑆.
• Embedding dimension 𝐷𝑖𝑚
Result: Node embeddings 𝑍∈ℝ
|
|
×
;
1. Initialize node representations:
For each node 𝑣∈𝑉, initialize the node
Citation Steadiness Analysis with GraphSAGE Approach
771

representation: ℎ
=𝑥
, where 𝑥
is the initial
feature vector for the node 𝑣.
2. Message passing and aggregation:
For each layer 𝑘=1 𝑡𝑜 𝐾:
a. For each node 𝑣∈𝑉:
• Sample a fixed-size set of neighbors
𝑁
(
𝑣
)
⊂𝑁
(
𝑣
)
(if sampling is used),
where 𝑁(𝑣) refers to the neighborhood of
a node 𝑉 in a graph 𝐺= (𝑉,𝐸).
• Aggregate the representations of neighbors
𝑁
(
𝑣
)
:
𝑚
=
𝐴𝐺𝐺𝑅𝐸𝐺𝐴𝑇𝐸
({ℎ
:𝑢 ∈ 𝑁
(𝑣)})
• Concatenate the aggregated message 𝑚
with the current ℎ
ℎ
=𝜎(𝑊
⋅𝐶𝑂𝑁𝐶𝐴𝑇(ℎ
,𝑚
)).
3. Normalize embeddings:
Normalize ℎ
to maintain numerical stability if
required.
4. Output final embeddings:
After 𝐾 iterations, the final node embeddings
are: 𝑧
= ℎ
∀𝑣 ∈ 𝑉.
Algorithm 1: GraphSAGE- Embedding Generation
Algorithm.
Key Components:
1. Aggregation Function (AGGREGATE):
Examples of aggregation functions include:
• Mean Aggregator.
• Pooling Aggregator.
• LSTM Aggregator: Applying an LSTM over the
sequence of neighbour embeddings.
2. Sampling Neighbourhood:
To scale to large graphs, only a subset of neighbors is
sampled for aggregation.
Dimension outlines refer to the size of the hidden
layers within a neural network. This is a crucial
parameter that the user must specify. A common
practice is keeping the dimension consistent
throughout all layers or gradually reducing it as the
network's depth increases.
3 APPROACH
This section outlines the presented method for
estimating the reliability of citations in academic
systems, which may signal manipulation or
fraudulent activity grounded in the premise that
manipulated citations are intentionally added to
inflate the perceived impact of specific publications.
Such citations are expected to exhibit inconsistencies
and become detectable when a citation network is
subjected to perturbations. So, it is hypothesized that
it is possible to identify these irregularities and
expose suspicious citations by examining the stability
of citations under arbitrary disturbances introduced to
the citation network involving randomly removing
edges in a controlled manner. These modifications
simulate different scenarios to evaluate the network’s
robustness, stability, and structural integrity.
Applying these perturbations aims to expose
vulnerabilities within the network and increase the
likelihood of anomalies or manipulated elements
displaying abnormal behaviour, thereby
distinguishing them from authentic components.
A link prediction is conducted to maintain the
network’s coherence following these perturbations.
This step utilizes node embeddings of the permuted
network to measure the similarity or proximity
between node pairs. Various similarity metrics are
employed, such as cosine similarity, Euclidean
distance, and graph-based measures like mutual
neighbours and the Jaccard coefficient.
The citation graph is treated as undirected in this
study, focusing on the overall connectivity between
papers rather than the direction of citations. This
undirected perspective allows for a comprehensive
analysis of the network’s structure and patterns,
capturing relationships and dependencies among
papers irrespective of whether they are cited.
A pseudocode of the proposed approach is given
as Algorithm 2.
Data:
• A graph 𝐺= (𝑉,𝐸), where V is the set of
nodes, input features {𝑥
,∀𝑣 ∈ 𝑉}, and 𝐸 is
the set of edges.
• Feature matrix 𝑋∈ℝ
|
|
×
, where 𝑑 is the
dimension of node features.
• Aggregation function 𝐴𝐺𝐺𝑅𝐸𝐺𝐴𝑇𝐸.
• Number of layers 𝐾.
• Embedding dimension 𝐷𝑖𝑚
• Weight matrices 𝑊
for 𝑘 = 1,2,…,𝐾..
• Non-linearity 𝜎(⋅) (e.g., ReLU).
• Neighbourhood sampling size 𝑆.
• 𝑁_𝑖𝑡𝑒𝑟—Number of perturbations.
• 𝐹𝑟—Fraction of edges randomly omitted in each
iteration.
• 𝑆𝑖𝑚—Similarity measure.
• 𝑇𝑟—Similarity threshold.
DMBDA 2025 - Special Session on Dynamic Modeling in Big Data Applications
772

Result: a sorted array 𝑅𝑒𝑠𝑢𝑙𝑡0 in ascending order;
1. Load the dataset 𝐺= (𝑉,𝐸),
2. Initialize an array 𝑅𝑒𝑠𝑢𝑙𝑡0 of zeros with a
length equaling the number of edges in 𝐺,
3. For 𝑖𝑡𝑒𝑟 = 1: 𝑁_𝑖𝑡𝑒𝑟 do:
• Create a temporary dataset 𝐺_𝑇 by removing the
𝐹𝑟 fraction of edges in 𝐺 without replacement.
• Create an embedding of 𝐺_𝑇: 𝑊(𝐺_𝑇) =
GraphSAGE (𝐺_𝑇, 𝐴𝐺𝐺𝑅𝐸𝐺𝐴𝑇𝐸, 𝑊
, 𝜎, 𝑆,
𝑁_𝑖𝑡𝑒𝑟, 𝐹𝑟, 𝑆𝑖𝑚, 𝑇𝑟).
• Calculate for all pairs of nodes of 𝐺_𝑇 the
similarity values between all nodes,
• Compose a set 𝐸𝐷_𝑅 of the edges reconstructed
using the procedure:
Link_prediction (𝐺_𝑇,𝑊(𝐺_𝑇), 𝑆𝑖𝑚, 𝑇𝑟),
• For edge in 𝐸𝐷_𝑅 do:
𝑅𝑒𝑠𝑢𝑙𝑡(𝑒𝑑𝑔𝑒) = 𝑅𝑒𝑠𝑢𝑙𝑡(𝑒𝑑𝑔𝑒) + 1
4. Summarize by sorting the array 𝑅𝑒𝑠𝑢𝑙𝑡0 in
ascending order.
Algorithm 2: A pseudocode of the proposed approach.
The process starts by downloading the examined
citation graph and initializing a zero-filled array
named 𝑅𝑒𝑠𝑢𝑙𝑡0, whose length matches the number of
edges in 𝐺 . Then, it proceeds through 𝑁_𝑖𝑡𝑒𝑟
sequential iterations. In each iteration, a temporary
graph, 𝐺_𝑇 is generated by randomly removing a
fraction 𝐹𝑟 of edges from 𝐺. This temporary graph is
then embedded into ℝ
using the GraphSAGE
algorithm. A similarity measure ( 𝑆𝑖𝑚 ) and a
threshold (𝑇𝑟) are introduced to enhance the method.
A similarity measure quantifies the similarity
between node pairs and the threshold (𝑇𝑟) determines
whether a pair is considered "connected" if the
similarity score between two nodes is greater than 𝑇𝑟,
they are classified as connected; otherwise, they are
considered disconnected. This criterion is then used
in the link prediction procedure to distinguish
between connected and disconnected nodes within
the graph.
𝐿𝑖𝑛𝑘_𝑝𝑟𝑒𝑑𝑖𝑐𝑡𝑖𝑜𝑛 (𝐺_𝑇, 𝑊(𝐺_𝑇), 𝑆𝑖𝑚, 𝑇𝑟) is a
procedure designed to predict the presence of an edge
between two nodes.
Data:
• 𝐺—Graph of paper citations.
• 𝑛
,𝑛
-two nodes in 𝐺.
• 𝑊(𝐺)—Embedding of Graph 𝑇.
• 𝑆𝑖𝑚—Similarity measure.
• 𝑇𝑟—Similarity threshold.
Result: If it is feasible to predict potential links
amid nodes 𝑛
and 𝑛
: false or true.
1. If the similarity score 𝑆𝑖𝑚 (𝑛
,𝑛
) is bigger
than 𝑇𝑟, the procedure returns 1 (true),
indicating that an edge could suppositionally be
between 𝑛
and 𝑛
.
2. Otherwise, if the similarity score is less than or
equal to 𝑇𝑟, the procedure returns 0 (false),
indicating that there is likely no edge between
𝑛
and 𝑛
.
Algorithm 3: A link_prediction procedure.
4 NUMERICAL EXPERIMENTS
To investigate the datasets, we conduct numerical
experiments with 500 (number of perturbations)
iterations per experiment and explore different
parameter settings. These tests explored three key
parameters: 𝐹𝑟 (set at 0.3, 0.4, and 0.5), 𝑇𝑟 = 0.95,
and the cosine similarity. The number of layers 𝐾 is
10. All weights in 𝑊
for 𝑘=1,2,…,𝐾 are equal to
1. Non-linearity activation function 𝜎(⋅) is ReLU.
The neighbourhood sampling size 𝑆 is 2.
The main goal is to assess the distribution of the
reconstruction rate for the edges. An edge is deemed
"non-reconstructed absent" when the similarity
between the two nodes it connects does not surpass
established thresholds. The results are presented
using histograms that illustrate the distribution of
edge recovery success rates obtained during an
iterative procedure. In these visualizations, color
coding highlights critical areas:
• Red: Represents the lower bound of
reconstructed edges for the bottom 10% of the
data.
• Blue: Covers the range of reconstructed edges
between 10% and 50%.
• Yellow: Indicates 50% and 90% of reconstructed
edges.
• Green: Covers the range of reconstructed edges
above 90% of reconstructed edges.
4.1 Cora Dataset
The Cora dataset, a widely recognized benchmark for
machine learning and network analysis research,
consists of 2,708 scientific papers categorized into 7
distinct classes within the machine learning field. It
features 5,429 citation connections, making it well-
suited for evaluating algorithms for tasks like
document classification and link prediction.
GraphSAGE embedding dimensions are influenced
Citation Steadiness Analysis with GraphSAGE Approach
773
by factors such as the number of layers, hidden layer
dimensions, and aggregation methods, which are
explored by testing dimensions (32, 16, 64, 128, 256).
This hyperparameter tuning process identified
𝐷𝑖𝑚 = 256 as our application's most apposite
embedding dimension.
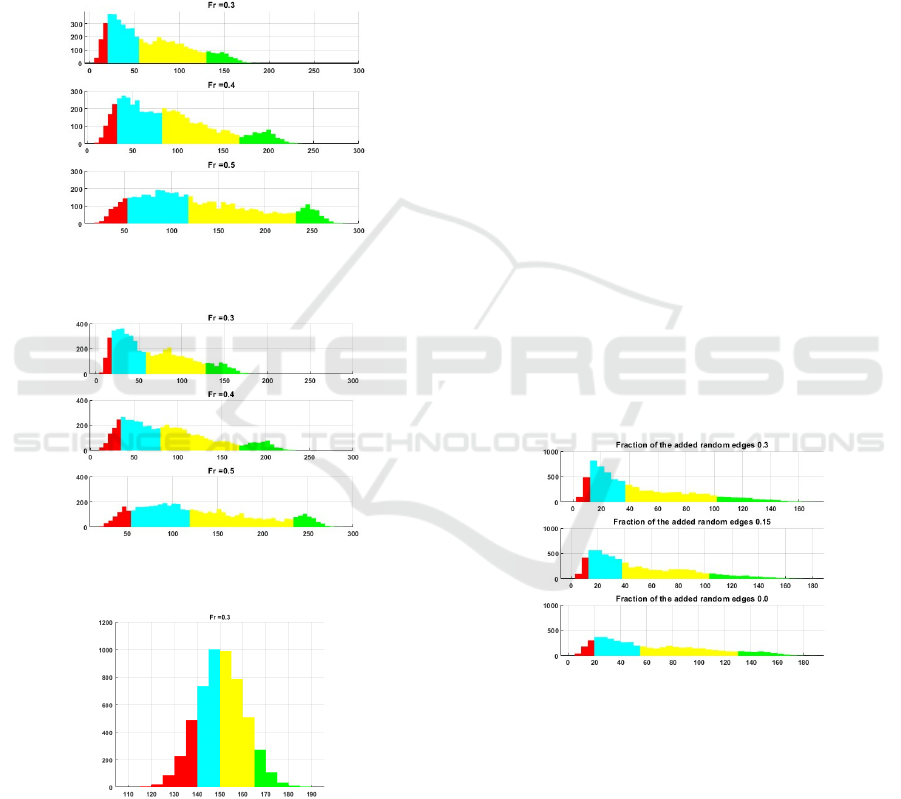
4.1.1 Experiments with Real Data
The following 3 figures demonstrate the results of the
given Aggregation function (𝐴𝐺𝐺𝑅𝐸𝐺𝐴𝑇𝐸).
Figure 1: Histograms of reconstruction rate obtained for the
Cora dataset with 𝐴𝐺𝐺𝑅𝐸𝐺𝐴𝑇𝐸=’Mean’.
Figure 2: Histograms of reconstruction rate obtained for the
Cora dataset with 𝐴𝐺𝐺𝑅𝐸𝐺𝐴𝑇𝐸=’Pool’.
Figure 3: Histograms of reconstruction rate obtained for the
Cora dataset with 𝐴𝐺𝐺𝑅𝐸𝐺𝐴𝑇𝐸=’LSTM’.
First, it must be noted that it is highly uncommon
to observe a normal distribution in subjects connected
to citation distributions, as this goes against the well-
established trend that citation distributions are
typically skewed with a long-tail pattern. This implies
that a small proportion of highly cited papers
accumulate most citations, while the vast majority
receive relatively few. Such skewness is often
explained by phenomena like the "Matthew effect"
(where highly cited papers attract even more
citations), the influential nature of groundbreaking
works, and the impact of prevailing research trends.
So, in citation networks, the Matthew effect posits
that highly cited papers tend to attract further
citations, thereby contributing to a skewed
distribution of citations within the scholarly
landscape. Moreover, it contradicts the results stated
in (Avros, Keshet, Toledano-Kitai, Vexler, and
Volkovich, 2023) and (Avros, Haim., Madar, Ravve,
and Volkovich, 2024).
The observation of a normal citation distribution
might indicate an inappropriate choice of the
aggregation function. It appears that an LSTM-based
aggregation is not appropriate for this relatively small
dataset.
4.1.2 Sanity Checks
The Modified versions of the CORA dataset are
tested to evaluate the model's performance
thoroughly. The variation includes a 15% and 30%
increase in edges, simulating noise or unexpected
connections. These changes allow us to assess the
model's ability to generalize and adapt to
transformations in the graph's underlying structure.
The experiments are provided for 𝐹𝑟=0.3.
Figure 4: Histograms of reconstruction rate obtained for
noise versions of the Cora dataset with
𝐴𝐺𝐺𝑅𝐸𝐺𝐴𝑇𝐸=’Mean’.
As was expected, the injected noises significantly
increase the distribution of positive asymmetry, i.e.,
the tail of the distribution extends towards the right
side of the number line. The most visible influence
occurs in 30% noise attitude (the upper panel). To
ensure consistency in analysis, the distributions of all
three dataset versions are presented using the
identical binning structure of 4 colored areas as that
utilized for the original, "clean" dataset without any
added noise.
DMBDA 2025 - Special Session on Dynamic Modeling in Big Data Applications
774
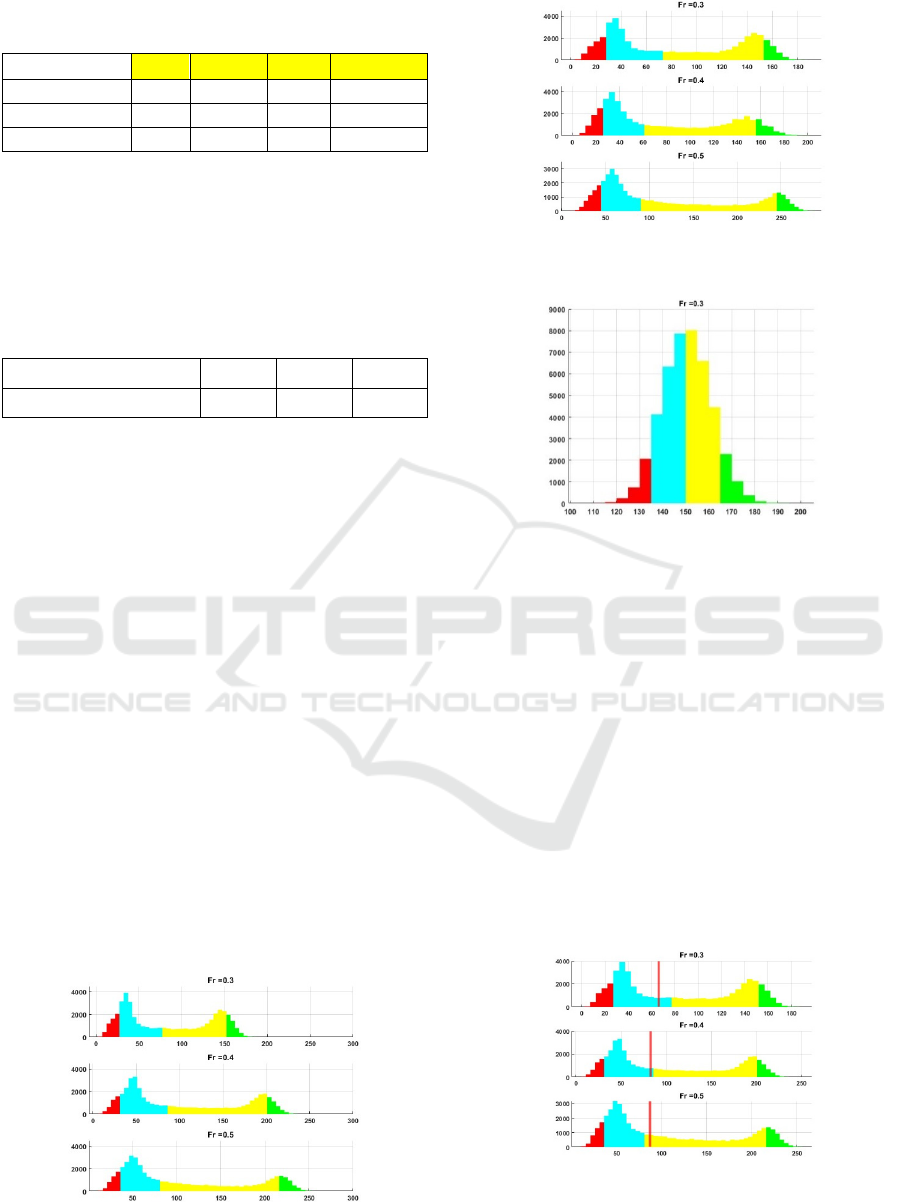
Table 1: The reconstructed edges in 3 dataset versions
within 4 colored areas.
Noise attitude 1 2 3 4
0.3
740
2890 2778 705
0.15
519
2401
2667 683
0.0
131
1553
2575 1119
The presented results provide evidence of the
model's readiness for deployment. A notable
observation is an increase in the frequencies of the
two first categories, accompanied by shifts in the
frequency of the last group. The appropriate skewness
values also support this conclusion.
Table 2: The skewness attitude calculated for 3 datasets.
Noise attitude 0.30 0.15 0.0
Skewness 0.19 0.37 0.58
4.2 PubMed Dataset
PubMed is a freely available database curated by the
U.S. National Library of Medicine (NLM), a part of
the National Institutes of Health (NIH). It serves as a
comprehensive platform for accessing biomedical
and life sciences literature. The database primarily
includes references and abstracts from scientific
journals, spanning various disciplines such as
medicine, biology, healthcare, bioinformatics,
biochemistry, and public health. The core of
PubMed's content is sourced from **MEDLINE**,
NLM’s primary bibliographic database. Additionally,
it integrates literature from **PubMed Central
(PMC)**, a free repository for full-text biomedical
articles. Hosting over **35 million citations and
abstracts**, PubMed offers coverage that extends
back to the 1940s and is regularly updated with the
latest research findings. The dataset exhibits a
network structure with 19,717 nodes representing
papers and 88,648 edges representing citation links
between them. The articles are classified into 3
distinct thematic categories.
Figure 5: Histograms of reconstruction rate obtained for the
PubMed dataset with 𝐴𝐺𝐺𝑅𝐸𝐺𝐴𝑇𝐸=’Mean’.
Figure 6: Histograms of reconstruction rate obtained for the
PubMed dataset with 𝐴𝐺𝐺𝑅𝐸𝐺𝐴𝑇𝐸=Pool’.
Figure 7: Histograms of reconstruction rate obtained for the
PubMed dataset with 𝐴𝐺𝐺𝑅𝐸𝐺𝐴𝑇𝐸=LSTM’.
In all considered circumstances except for the
“LSTM” case, the appearing histograms are bimodal,
suggesting a mixture distribution where the observed
data originates from two separate underlying
components. This pattern typically indicates that the
data is not homogeneous but fairly composed of two
subpopulations governed by its own distribution. The
“Expectation-Maximization (EM) algorithm” can be
employed to uncover these subpopulations. The
resulting clusters, derived from the histogram's
bimodal nature, enable a deeper understanding of the
data's composition, allowing researchers to explore
each subpopulation's distinct properties and
templates. Examples of such partitions are given in
the following figure.
Figure 8: Histograms of reconstruction rate obtained for
the PubMed dataset with 𝐴𝐺𝐺𝑅𝐸𝐺𝐴𝑇𝐸=Mean’ with
clusters boundary.
Citation Steadiness Analysis with GraphSAGE Approach
775

The vertical red lines assign the boundary
between clusters. As can be seen, the partitions are
about the same in all cases, which can indicate the
presence of two subpopulations in the edge
community.
5 SUMMARY AND
CONCLUSIONS
This research introduces a new methodology for
detecting suspicious citations in scientific literature
using the GraphSAGE algorithm and enhanced
citation graph embeddings. The method has shown
effectiveness in uncovering citation anomalies
through extensive testing. However, challenges arise
in handling interdisciplinary research and "sleeping
beauties"—articles initially overlooked but later
recognized due to delayed breakthroughs—making it
difficult for the model to differentiate genuine citation
dynamics from anomalies.
Approximately 80% of citation edges studied in
the study are identified as vulnerable to distortion,
revealing their lack of robustness within the citation
graph. These edges are flagged as potentially
manipulated, highlighting the fragile nature of
citation datasets and the significant impact that
individual edges can have on network stability and
reliability. Despite structural differences between
datasets, shared characteristics are identified,
suggesting universal tendencies within citation
systems. The Cora dataset displayed a homogeneous
structure with a higher proportion of suspicious
citations, while an analysis of the larger and more
heterogeneous PubMed dataset reveals two distinct
citation groups: one associated with suspicious edges
and another with more stable, well-reconstructed
citations.
All datasets considered exhibit a stable core of
reliable connections, reflecting the gradual
accumulation of trustworthy citations over time.
Nonetheless, even in datasets regularly updated with
new publications, a substantial number of edges are
found to be unstable or irrelevant, suggesting that
citation datasets inherently include connections
disposed to manipulation or unreliability.
Reconstruction score distributions demonstrated a
positively skewed, unimodal pattern, where most
citations clustered around lower scores, with a right-
skewed tail influenced by higher scores. This
distribution implies that a significant portion of
citations may lack reliability, raising concerns about
potential manipulation.
To validate the proposed approach, an experiment
is conducted with artificially augmented citation
graphs obtained by adding random noise expressed in
random edges. The results validate the model's
effectiveness in detecting such anomalies, further
reinforcing its value as a reliable tool for identifying
citation manipulation. The proposed method provides
a framework for dynamically monitoring research
trends and integrating new articles into citation
graphs, leveraging a stable core of knowledge to
evaluate individual links. Exploring positions within
the recovery histogram offers insights into citation
reliability and susceptibility to manipulation.
This research proposes new avenues for
understanding citation dynamics, emphasizing the
role of stable reconstructed edge clusters in
maintaining citation network integrity. It also
highlights universal patterns within citation systems,
offering valuable insights for developing robust tools
for citation analysis and anomaly detection.
REFERENCES
Avros, R., Haim, M. B., Madar, A., Ravve, E., &
Volkovich, Z. (2024). Spotting suspicious academic
citations using self-learning graph transformers.
Mathematics, 12(6), 814.
https://doi.org/10.3390/math12060814.
Avros, R., Keshet, S., Kitai, D. T., Vexler, E., & Volkovich,
Z. (2023). Detecting pseudo-manipulated citations in
scientific literature through perturbations of the citation
graph. Mathematics, 11(18), 3820.
https://doi.org/10.3390/math11123820.
Avros, R., Keshet, S., Kitai, D. T., Vexler, E., & Volkovich,
Z. (2023). Detecting manipulated citations through
disturbed node2vec embedding. In Proceedings of the
25th International Symposium on Symbolic and
Numeric Algorithms for Scientific Computing
(SYNASC), Nancy, France, 2023 (pp. 274–278). IEEE.
https://doi.org/10.1109/SYNASC61333.2023.00047
Falagas, M. E., & Alexiou, V. G. (2008). The Top-Ten in
Journal Impact Factor Manipulation. Archives of
Immunology and Therapy Experimental (Warsz),
56(4), 223–226. https://doi.org/10.1007/s00005-008-
0024-5.
Fong, E. A., & Wilhite, A. W. (2017). Authorship and
citation manipulation in academic research. PLOS
ONE, 12(12), e0187394.
https://doi.org/10.1371/journal.pone.0187394.
Grover, A., & Leskovec, J. (2016). Node2vec: Scalable
feature learning for networks. In Proceedings of the
22nd ACM SIGKDD International Conference on
Knowledge Discovery and Data Mining (KDD '16),
San Francisco, CA, USA, 13–17 August 2016 (pp. 855–
864). ACM. https://doi.org/10.1145/2939672.2939754.
Hamilton, W., Ying, Z., & Leskovec, J. (2017). Inductive
representation learning on large graphs. Advances in
Neural Information Processing Systems, 30, 1024–
1034.
DMBDA 2025 - Special Session on Dynamic Modeling in Big Data Applications
776

Ioannidis, J. P. A., & Thombs, B. D. (2019). A user’s guide
to inflated and manipulated impact factors. European
Journal of Clinical Investigation, 49(7), e13151.
https://doi.org/10.1111/eci.13151.
Jacobs, J. A. (2016, June 30). Manipulated journal
rankings? Inside Higher Ed. Retrieved from
https://www.insidehighered.com/views/2016/07/01/ex
amination-whether-academic-journal-rankings-are-
being-manipulated essay.
Liu, J., Bai, X., Wang, M., et al. (2024). Anomalous
citations detection in academic networks. Artificial
Intelligence Review, 57, 103.
https://doi.org/10.1007/s10462-023-10375-w.
Prabha, C. G. (1983). Some aspects of citation behaviour:
A pilot study in business administration. Journal of the
American Society for Information Science, 34(4), 202–
206. https://doi.org/10.1002/asi.4630340404.
Resnik, D. B., Gutierrez-Ford, C., & Peddada, S. (2008).
Perceptions of ethical problems with scientific journal
peer review: An exploratory study. Science and
Engineering Ethics, 14(3), 305–310.
https://doi.org/10.1007/s11948-008-9077-2.
Wilhite, A., & Fong, E. (2012). Coercive citation in
academic publishing. Science, 335(6072), 542–543.
https://doi.org/10.1126/science.1210353.
Wilhite, A., Fong, E. A., & Wilhi, S. (2019). The influence
of editorial decisions and the academic network on self-
citations and journal impact factors. Research Policy,
48(6), 1033–1044.
https://doi.org/10.1016/j.respol.2019.03.003.
Wren, J. D., & Georgescu, C. (2022). Detecting anomalous
referencing patterns in PubMed papers suggestive of
author-centric reference list manipulation.
Scientometrics, 127(3), 5753–5771.
https://doi.org/10.1007/s11192-022-04362-w.
Citation Steadiness Analysis with GraphSAGE Approach
777
