
A Nested Structure of Anomalies in Academic Publication Citations
Renata Avros
a
, Gal Farfel
b
and Zeev Volkovich
*c
Department of Software Engineering, Braude College, P.O. Box: 78, Karmiel, 21982, Israel
Keywords: Citation Anomalies, Graph Wavelet Transform, Beta Wavelet Graph Neural Network.
Abstract: The article presents a novel approach to detecting nested anomalies in citation networks. These anomalies, as
irregularities within citation patterns, significantly threaten the reliability of academic research. Traditional
methods for anomaly detection often study the entire citation graph, missing abnormalities within specific
subfields or research clusters. Unlike these methods, our approach delves deeper by examining articles within
the citation network at different nested scales. Such an approach allows anomalies that might be missed to be
uncovered by focusing on a single level, revealing hidden patterns across various granularities, detecting a
broader spectrum of nested irregularities, and offering a more nuanced understanding of how citation patterns
deviate from the expected. The presented approach supports identifying potential issues, such as citation
manipulation, and uncovering emerging trends within the network. The delivered numerical experiments also
demonstrate the method's ability to estimate the consistency of the dataset structure.
1 INTRODUCTION
The research on anomalies in citation networks, a
complex and pressing issue, is of utmost importance
for the integrity and reliability of scholarly
communication. Understanding these incongruities
involves identifying multiple irregularities or
unexpected outliers within the larger citation patterns.
Investigating citation patterns at multiple levels can
uncover critical insights, including identifying
improper citations, potentially fraudulent activities,
and emerging knowledge-sharing trends. Our
approach aims to recognize potential issues, such as
citation manipulation, and uncover emerging trends
within the citation realm. The need for a more
nuanced understanding of how citation patterns
deviate from the expected is crucial for ensuring the
integrity and reliability of scholarly communication
and enhancing the accuracy of citation-based metrics
and analyses.
The anomaly papers may manifest at multiple
levels of the citation network hierarchy, indicating
deviations or inconsistencies in citation patterns
snuggled within broader citation relationships.
a
https://orcid.org/0000-0001-9528-0636
b
https://orcid.org/0009-0005-1672-5924
c
https://orcid.org/0000-0003-4636-9762
* Corresponding author
Certain articles may exhibit abnormal citation
behavior, such as a disproportionate number of
citations from articles located in other clusters of
papers. These irregularities may indicate citation
manipulation, biased referencing, or emerging
research trends within specific subfields. For
instance, a paper may contain citations to obscure or
irrelevant sources, self-citations intended to
artificially inflate the author's citation count, or
citations to predatory journals or discredited research.
While a paper may conform to expected citation
norms, specific citations within the paper may stand
out as inconsistent. Unethical citation practices are
not just a minor inconvenience but a serious threat to
the core principles of academic discourse – precision,
impartiality, and scientific credibility. Researchers
commonly acknowledge the uneven value of citations
and attempt to differentiate them by type and
importance (e.g., weighting), but this approach
remains limited. Prabha's work (Prabha, 1983)
underscores the gravity of the issue, revealing that
over two-thirds of references in a paper might be
needless. This statistic highlights the prevalence of
dubious citations that undermine the integrity of the
academic record.
Avros, R., Farfel, G., Volkovich and Z.
A Nested Structure of Anomalies in Academic Publication Citations.
DOI: 10.5220/0013455300003967
In Proceedings of the 14th International Conference on Data Science, Technology and Applications (DATA 2025), pages 761-768
ISBN: 978-989-758-758-0; ISSN: 2184-285X
Copyright © 2025 by Paper published under CC license (CC BY-NC-ND 4.0)
761

Scholarly citation practices are not immune to
author bias, which takes various forms. Excessive
self-citation, for example, occurs when authors cite
their work excessively, potentially to bolster their
publication count or perceived impact. Coercive
citation involves reviewers or editors pressuring
authors to cite specific references, sometimes
including their own or those from journals.
Citation networks can exhibit phenomena like
citation rings, where groups of researchers
reciprocally inflate each other's citation counts, and
ghost citations, fabricated references to strengthen
arguments or create the illusion of broader support.
Data-related issues, such as inaccurate reference
formatting or ambiguity in author names, further
complicate citation tracking. External influences, like
the bias towards citing studies from prestigious
journals or those funded by entities, also skew citation
practices. Moreover, erratic citation patterns may
emerge as scholars establish foundational works and
methodologies in emerging research fields.
As widely acknowledged, citation analysis is
focused on identifying various anomalies. This
attention stems from the concern raised in the
introduction that these anomalies may originate from
inaccurate references in a specific context. The
effectiveness of anomaly detection hinges on
selecting the most appropriate algorithm for the
specific data type and desired data-centric outcome.
Most studies in the mentioned field (see, e.g., (Liu
2022), (Liu, 2024)) concentrate on anomaly citation
recognition, examining a citation graph in its entirety
and losing the graph granularity. An anomaly paper
in a citation network is one whose citation patterns
deviate significantly from the norm for its field and
topic. These deviations can indicate various issues,
potentially impacting the integrity of the academic
record. Such an anomaly is associated with the paper's
position within the citation network. Unexpected co-
citation patterns can signal anomalies, such as a
highly cited paper only co-cited with irrelevant
works.
The community structure is also important to
consider, considering whether the paper belongs to a
cluster of highly interconnected papers that exhibit
unusual citation behavior. So, anomalies can exhibit
a spectrum of deviations from the norm, indicating
that their departure from typical patterns can vary in
severity across different instances, creating a nested
anomaly structure.
Unlike traditional methods, this paper presents a
multi-level analysis for more comprehensive
detection, examining articles at various granularities
to uncover overlooked irregularities. The findings
of this research can be applied to various fields,
including citation analysis, software engineering, and
scholarly communication, to detect irregularities,
uncover emerging trends, and enhance the accuracy
of citation-based metrics and analyses, thereby
improving the quality and trustworthiness of
academic research evaluation.
Aiming to recognize anomaly papers on nested
citation levels, we base our research on the method
proposed in (Tang, 2022). It is an innovative
approach to harnessing spectral information within
Graph Neural Networks (GNNs) to detect anomalies.
It proposes a new network architecture called a Beta
Wavelet Graph Neural Network (BWGNN).
The proposed method involves a detailed
examination of articles' location in a network, starting
from their broad structural attributes and narrowing
down to finer connection elements to identify
anomalies in the citation nested patterns.
Aiming to prepare the initiating anomaly sets in
data clusters, a citation graph is embedded using the
Node2Vec method (Grover, 2016) and clustered in a
linear space. Subsequently, the outer shell of the
clusters—those points most distant from the cluster
centers—is identified as the initial set of anomalies.
We employ the BWGNN network trained on a dataset
with elements assigned as anomalies or normal
elements to better understand the identified
anomalies. After categorizing the data points, the
network identifies anomalies and their connections
within the network. These anomalies are then
removed, resulting in a cleaner dataset. The process
is then repeated using this reduced graph to refine the
detection and analysis of anomalies at further deeper
levels.
2 MATHEMATICAL
FRAMEWORKS
Subsections 2.1 and 2.2 establish the background for
BWGNN to be employed throughout this study.
2.1 Signal on Graphs
An attributed graph, G = {V, E}, is characterized in
this study by a collection of nodes V and unweighted
edges E connecting the nodes. The degree matrix D is
a diagonal matrix where D
ii
denotes the degree, or
number of connections, of vertex i. The adjacency
matrix A is a square matrix where A
ij
signifies the
presence (with a 1) or absence (with a 0) of an edge
between vertices i and j. Let L=D-A be the regular
DMBDA 2025 - Special Session on Dynamic Modeling in Big Data Applications
762

Laplacian (not that the normalized one also can be
used) matrix with eigenvalues arranged in ascending
order, 0 = 𝜆
≤⋯≤𝜆
, and a corresponding
orthonormal basis of eigenvectors 𝑈 =
(𝑢
,𝑢
,…,𝑢
).
Except for the two endpoints 𝜆
and 𝜆
the
remaining eigenvalues can be partitioned into low
frequencies
{
𝜆
,𝜆
,⋯,𝜆
}
and high frequencies
{𝜆
,𝜆
,…,𝜆
} using an arbitrary threshold 𝜆
.
The paper (Tang, 2022) brings attention to the “right-
shift” phenomenon concept. Anomalies disturb a
graph's spectral energy distribution, causing it to shift
towards higher frequencies. So, regular graphs
display a specific energy pattern, but anomalies
disrupt this pattern by focusing more energy on high-
frequency elements.
This concept can be clarified by considering the
known case of the Fourier transform on graphs. Just
like a regular Fourier transform breaks down a
complex signal into its basic frequencies, the graph
Fourier transform acts as a similar tool for network
data. It decomposes the data into fundamental
components unique to the network's structure.
Here, the spectral energy distribution of a signal
𝑥= (𝑥
,𝑥
,⋯,𝑥
)
∈𝑅
on a graph is given by the
signal's frequency components obtained by the named
transform
𝑥= (𝑥
,𝑥
,⋯,𝑥
)
=𝑈
𝑥 .
Let us introduce
𝑝(𝜆
)=
𝑥
∑
𝑥
as the spectral energy distribution at 𝜆
(1≤𝑘≤
𝑁). The famous coefficient of variation can be
interpreted as the level of anomalies present in the
distribution. An increasing proportion of anomalies
corresponds to a more significant coefficient of
variation in the energy distribution. If the distance
between anomalies and the mean vector expands, the
indicator also rises, designating a greater degree of
anomalies. To quantify the changes in the spectral
energy distribution relative to the degree of
anomalies, a metric called the Energy Ratio is
introduced as follows:
𝜂
(𝑥,𝐿)=
∑
∑
,(1≤𝑘≤𝑁−1).
Generally, as the coefficient of variation increases,
the expected value of the inverse of the low-
frequency energy ratio also increases. This means that
a greater number of outliers or anomalies in the
dataset results in a higher average of the inverse low-
frequency energy ratio. Therefore, a greater degree of
anomaly results in the spectral energy distribution
showing reduced concentration on the low-frequency
eigenvalues. A spectral energy ratio can be used to
detect anomalies in a graph. However, this method is
sufficiently complex and slow for large graphs. A
simpler and faster method has been proposed,
focusing on the spectral domain.
To accomplish this, a piecewise linear function is
introduced within the interval from zero to 𝜆
.
Between two successive eigenvalues
[
𝜆
,𝜆
]
this
function equals to 𝜂
(𝑥,𝐿) . The residual area
between this simplified curve and a line representing
constant energy (g(t) = 1) is termed the high-
frequency area (S
high
). It can be calculated through
elementary manipulations without the necessity for
eigendecomposition:
𝑆
(𝑥)=
.
This equation demonstrates the close relationship
between a signal's energy distribution in the spectral
domain and the smoothness in the spatial domain.
Consequently, when the signal x demonstrates similar
values between connected nodes, resulting in a
smaller 𝑥
𝐿𝑥 suggests a lower degree of irregularity.
2.2 Beta Wavelet Graph Network
As indicated in (Tang, 2022), many existing Graph
Neural Networks (GNNs) face challenges from using
low-pass filters and prioritizing information from
lower frequencies, potentially leading to oversight of
high-frequency anomalies of interest. While adaptive
filters allow them to adjust their focus, they may still
need more specificity in targeting the frequency band
where anomalies reside (band-pass) or accurately
pinpointing the location of these anomalies within the
graph (spectral-localized). This issue arises because,
even in anomalies, a substantial portion of the graph's
energy remains concentrated on lower frequencies.
Consequently, these adaptive GNNs may exhibit
behavior akin to low-pass filters, potentially missing
critical high-frequency anomalies.
To better handle anomalies, a new graph neural
network architecture is proposed based on
Hammond's graph wavelet theory (Hammond, 2011),
which is well-known for its band-pass nature. This
theory represents a significant advancement in signal
processing and analysis, as it extends the capabilities
of wavelets to graphs. Researchers can analyze
signals within intricate graph structures, unlike
traditional wavelets limited to Euclidean spaces. It
provides them with a robust toolkit for conducting
A Nested Structure of Anomalies in Academic Publication Citations
763

localized analysis on graphs, like how wavelets
facilitate the examination of signals in time or
frequency domains.
Generally, this graph wavelet transform is created
on a “mother” wavelet ψ and utilizes a set of wavelets
as bases, denoted as 𝑊 = (𝑊
,𝑊
,⋯) . In
formal terms, the application of 𝑊
to a graph signal
x
∈
R
N
can be expressed as:
𝑊
(𝑥) = 𝑈𝑔
(𝛬)𝑈
𝑥.
To avoid computing the eigen decomposition of the
graph Laplacian, the kernel function 𝑔
is chosen
commonly as a polynomial function represented as
𝑈𝑔
(
𝐿
)
𝑈
= 𝑔
(𝐿)
The presented research selects a slightly modified
beta distribution density as the graph kernel function:
𝛽
,
(
𝑤
)
=
(,)
𝑤
(1 − 𝑤)
, 𝑖𝑓 𝑤 ∈[0,1]
0 𝑜𝑡ℎ𝑒𝑟𝑤𝑖𝑠𝑒
where 𝑝,𝑞∈𝑅
and B is the standard Beta function,
also called the Euler integral of the first kind. Aiming
to cover all eigenvalues 𝜆∈
[
0,2
]
of the normalized
graph Laplacian 𝐿 a modified kernel
*
(,)() (,)
1
22
pq w pq
w
ββ
=
𝛽
∗
,
is a polynomial for 𝑝,𝑞 𝜖ℕ
. Thus,
()
()( )
pq
*T
(p,q) (p,q)
L/2 I L/2
WU U
2
Β
(p 1,q 1)
β
−
==
++
Λ
Let us choose a constant 𝑝+𝑞=𝐶 to generate a
set of C+1 the Beta wavelet transforms 𝑊 with the
same order:
𝑊=(𝑊
,
,𝑊
,
,…,𝑊
,
).
Here is a low-pass filter 𝑊
,
, However, all the other
functions provide band-pass filters of different scales.
Based on the introduced beta graph wavelet, BWGNN
is proposed for anomaly detection.
𝑍
=(𝑊
,
𝑀𝐿𝑃
(
𝑋
)
,𝐻=𝐴𝐺𝐺
(
𝑍
,𝑍
,…,𝑍
)
.
MLP(
⋅
) represents a multi-layer perceptron, while
AGG(
⋅
) is a basic aggregation function like
summation or concatenation. Following aggregation,
the resultant representation H is forwarded to another
MLP employing the Sigmoid function to determine
the abnormal probability.
2.3 Node2Vec Graph Embedding
Analogous to word embedding, graph embedding
methodologies are designed to distill the fundamental
attributes of nodes and edges within a graph into
continuous vectors of diminished dimensions. In a
manner akin to word embeddings, which elucidate the
semantic nuances and interrelationships among
words in textual contexts, graph embeddings
elucidate the structural layout and interconnections
intrinsic to a graph.
The famous Node2Vec approach (Grover, 2016)
constitutes a particular algorithm employed for graph
embedding, which addresses converting a graph into
numerical representations for each node. Termed
embeddings, these numerical representations
encapsulate the relationships among nodes within the
graph. Analogous to word embedding, where words
with analogous meanings possess similar
embeddings, Node2Vec attempts to generate
embeddings wherein closely interconnected nodes
within the graph exhibit analogous numerical
representations.
Node2Vec uses random walks on graphs, with a
bias, during this exploration process. This bias allows
it to balance two important aspects of a node's
neighborhood: Homophily and Structural
Equivalence. Two settings, namely “return” and
“inout”, regulate the algorithm's exploration behavior
by covering the network. These settings influence the
direction of the random walk, dictating its next steps.
• Local Exploration: “Return(p)” - This setting
governs the likelihood of the walk revisiting
recently traversed nodes. A higher “return” value
results in the walk staying near its starting point,
emphasizing the exploration of the local
neighborhood and capturing the network's
structural characteristics.
• Global Exploration: “Inout(q)” - This setting
determines whether the walk explores outward to
new regions or inward towards previously visited
nodes. A higher “inout” value encourages
outward exploration, facilitating the discovery of
diverse network regions.
Node2Vec balances exploring novel graph areas
and exploiting information from neighboring nodes
by adjusting settings, particularly using probabilities
1/p and 1/q.
After generating random walks, Node2Vec
considers each walk ostensibly a sentence in natural
language and encodes the nodes using Word2Vec
word embeddings. Node2Vec operates with the Skip-
gram approach, where the embedding captures the
DMBDA 2025 - Special Session on Dynamic Modeling in Big Data Applications
764

structural similarities between nodes, effectively
translating their proximity or connectivity within the
network. The Skip-gram model is trained on a large
text corpus. For each word (target), the approach
considers a window of surrounding words (context)
and aims to predict these context words based solely
on the internal representation of the target word.
3 NESTED ANOMALIES’
STRUCTURE APPROACH
The proposed procedure seems to unfold as follows:
Algorithm 1.
Pseudocode of the procedure:
Input parameters:
• GraphG -A citations graph.
• Node2Vec procedure:
p and q – “return” and “inout” parameter values.
Nwalk- The number of random walks.
Lwalk-a length of a random walk.
d- a dimension of the Word2Vec embedding.
• H-a number of levels in the hierarchy.
• Cl- a clustering algorithm with K
Cl
- a number of
the clusters in GraphG.
• Fr - a core fraction in clusters.
• C-a constant to generate a set of C+1 the Beta
wavelet transforms
Procedure:
a. Load the dataset GraphG.
b. Initialize the set of anomaly nodes 𝑉
=∅.
c. For iter = 1: H do:
1. Create a temporal dataset G
iter
by omitting all
anomaly nodes from 𝑉
together with the
connections between 𝑉
and 𝐺𝑟𝑎𝑝ℎ𝐺\𝑉
.
2. Create an embedding of G
iter
:
W(G
iter
) = Node2Vec(G
iter
, Nwalk ,p, q, d).
3. Cluster W(G
iter
) using Cl into K
Cl
clusters.
a. Calculate distances from each point to
its cluster centroid.
b. In each cluster, select a fraction Fr of
the points closest to the centroid as the
cluster core while designating the
remaining points as anomalies.
c. Update 𝑉
as a union of all cluster
anomalies.
d. Update 𝑉
as a union of all cluster cores.
e. Train BWGNN(C) on 𝑉
, 𝑉
f. Assign each node in G
iter
recognized as
an anomaly to set 𝑉
.
d. Summarize the results.
4 NUMERICAL STUDY
4.1 CORA Dataset
The CORA dataset is famous for machine learning
and natural language processing researchers,
especially those interested in citation networks. It is a
collection of computer science research papers. Each
paper is represented as a bag of words by terms
appearing in the paper. The dataset also includes
information on how these papers cite each other,
forming a network of citations. So, CORA has the
following features:
• 2,708 Scientific Papers (the nodes of the
network)
• 5,429 Citation Links
• A binary bag of words Vector for Each
Paper based on a dictionary of 1,433 unique
terms.
• 7 Paper Categories: The papers are neatly
classified into 7 different areas as presented
in Table 1.
Table 1: Research Areas Presented in the CORA Dataset.
Field Amount
1. Neural Networks 818
2. Probabilistic Methods 426
3. Genetic Algorithms 418
4. Theory 351
5. Case-Based 298
6. Reinforcement Learning 217
7. Rule Learning 180
Figure 1 partially visualizes the CORA dataset
resting upon 2000 nodes. Different categories are
colored another way. The experiments are conducted
using a specified set of parameters.
• p = q = 1.
• Nwalk = 200.
• Lwalk = 50.
• d = 64.
• H =10.
• Cl- the PAM algorithm (see, e.g.,
(Kaufman, 1990)) with the K-means++
initialization and K
Cl
=7.
• Fr = 0.7, 0.8, 0.9.
• C= 64
It is important to note that while the number of
clusters used in the algorithm matches the number of
categories, the resulting partition does not correspond
A Nested Structure of Anomalies in Academic Publication Citations
765

to the original categorization. The Cramér's V
correlation coefficient between two partitions is
0.048, indicating an absence of significant
correlation. This discrepancy likely arises due to
differences in how papers are assigned. The applied
embedding method inherently relies on the citation
base partition. The obtained results are presented in
Tables 2-4.
Table 2: Distribution of anomaly papers during the sequential iterations and inherent categories for cora for FR=0.7.
Iteration\
cluster
1 2 3 4 5 6 7 Sum
1 26 2 17 11 11 0 10 77
2 1 16 16 0 15 10 9 67
3 5 4 7 0 9 25 9 59
4 21 17 12 7 25 4 1 87
5 16 8 1 5 1 11 6 48
6 1 7 14 17 2 38 13 92
7 3 7 0 7 6 13 4 40
8 3 15 0 1 7 14 8 48
9 6 13 0 8 2 15 8 52
10 21 9 7 7 6 33 0 83
Sum 103 98 74 63 84 163 68
Table 3: Distribution of anomaly papers during the sequential iterations and inherent categories for cora for FR=0.8.
Iteration\
cluster
1 2 3 4 5 6 7 Sum
1 14 7 10 22 24 17 0 94
2 6 7 6 0 8 6 8 41
3 3 3 15 2 12 1 0 36
4 18 9 4 1 9 0 11 52
5 2 7 8 8 11 0 3 39
6 8 10 0 11 11 1 7 48
7 11 17 6 0 0 11 23 68
8 3 10 12 3 2 1 2 33
9 13 8 11 1 6 0 1 40
10 2 8 15 1 7 6 6 45
Sum 80 86 87 49 90 43 61
Table 4: Distribution of anomaly papers during the sequential iterations and inherent categories for cora for FR=0.9.
Iteration\
cluster
1 2 3 4 5 6 7 Sum
1 14 13 0 4 10 11 1 53
2 4 9 9 1 3 3 5 34
3 4 7 3 9 6 4 0 33
4 4 3 5 5 3 13 1 34
5 2 3 2 2 2 18 0 29
6 1 0 1 0 0 13 0 15
7 3 0 5 0 4 11 0 23
8 2 8 6 1 10 8 3 38
9 9 2 3 8 2 0 6 30
10 0 2 3 0 0 0 0 5
Sum 43 47 37 30 40 81 16
DMBDA 2025 - Special Session on Dynamic Modeling in Big Data Applications
766
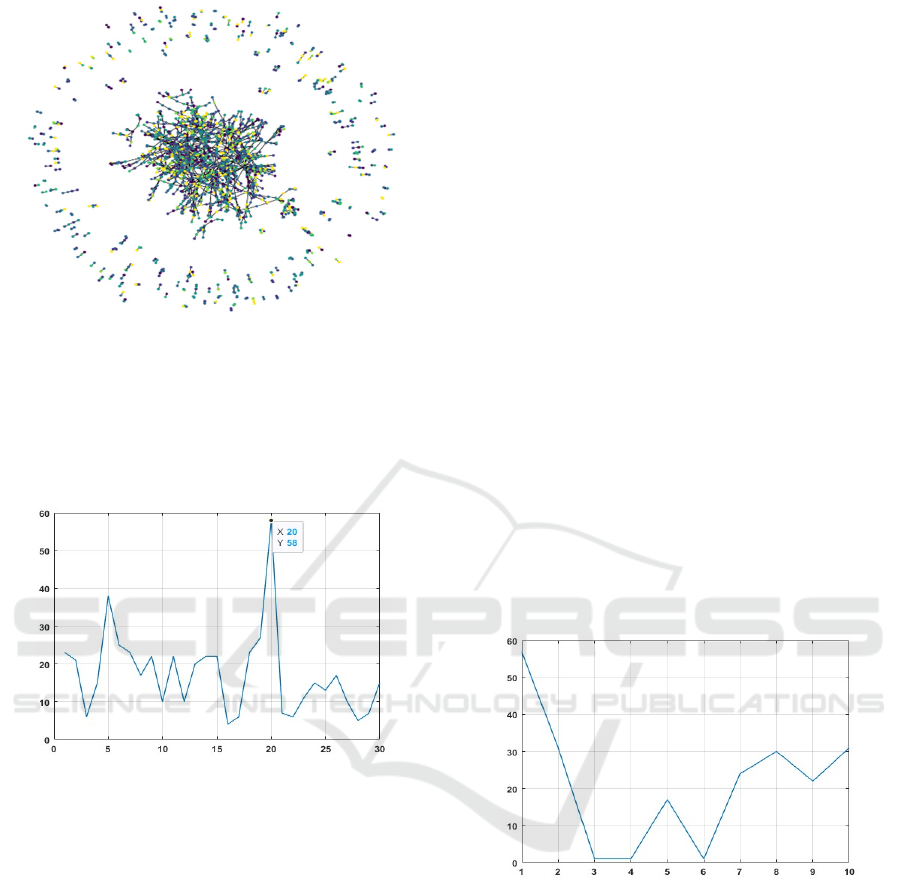
Figure 1: Partial visualization of the CORA dataset.
It appears interesting to consider the behavior of the
number of nested anomalies during iterations. The
following Figure 2 demonstrates an example of such
a performance for Fr=0.9 through 30 sequential
iterations.
Figure 2: The averaged number of anomalies calculated for
CORA data with Fr=0.9 through 30 sequential iterations.
This observation underscores the robustness and
stability of the CORA dataset's structure. As the
number of iterations increases, the characteristic
behavior consistently demonstrates a natural
tendency to decrease, indicating a reliable and well-
defined framework within the dataset.
4.2 PubMed-Diabetes Dataset
The “PubMed-Diabetes Dataset” is a meticulously
curated compilation of scientific articles delving into
diabetes research sourced from the extensive
biomedical literature on PubMed. Managed by the
National Center for Biotechnology Information
(NCBI) and the U.S. National Library of Medicine,
PubMed is a central hub for accessing scientific
advancements across the life sciences. This database
encompasses many publications, including research
papers, reviews, and scholarly articles spanning
various biomedical disciplines. Leveraging this
extensive repository, the PubMed-Diabetes dataset
focuses on articles investigating different aspects of
diabetes, offering valuable insights into this complex
condition.
To delve into the thematic connections among
articles in diabetes research, we adopted a subset
analysis approach. Specifically, we randomly
extracted 3000 nodes from the PubMed-Diabetes
dataset, constituting roughly 10% of the entire
dataset. This sample size is deemed statistically
significant for conducting network analysis.
Remarkably, within this subset, we identified 1995
edges, representing approximately 90% of the total,
indicating links between the respective articles.
Exploring this subset of the PubMed-Diabetes
dataset allows us to analyze thematic relationships
and uncover potential knowledge gaps, like the
CORA dataset analysis. The analysis provided for
this sampled dataset with the exchange of K
Cl
value
to 3, which is the inherent number of the categories in
the dataset, supplies the following result for Fr=0.9.
(see, Table 5).
Figure 3 presents the average number of
anomalies calculated for PubMed data with Fr=0.9
through 10 sequential iterations.
Figure 3: The average number of anomalies calculated for
PubMed data with Fr=0.9 through 10 sequential iterations.
This curve exhibits more unstable behavior than
the graph shown in Figure 2.
This instability could be attributed to the random
sampling method used to construct this dataset. The
inherent randomness in the sampling process likely
introduced more significant variability, leading to the
observed fluctuations in the curve. This suggests that
the inborn data structure significantly affects the
resulting stability.
A Nested Structure of Anomalies in Academic Publication Citations
767

Table 5: Distribution of anomaly papers during the
sequential iterations and inherent categories for PubMed for
Fr=0.9.
Iteration\c
luster
1 2 3 Sum
1 54 1 2 57
2 29 1 1 31
3 1 0 0 1
4 0 0 1 1
5 17 0 0 17
6 0 0 1 1
7 24 0 0 24
8 0 30 0 30
9 0 21 1 22
10 20 1 10 31
Sum 145 54 16
5 CONCLUSIONS
This paper introduces a novel multi-level analysis
approach for detecting anomalies within citation
networks. Unlike traditional methods that focus on a
single level, this approach examines articles at
various granularities, inspired by the work of (Tang,
2022), which leverages Beta Wavelet Graph Neural
Networks (BWGNNs) to utilize spectral information
for pinpointing anomalies. The proposed process
begins with Node2Vec embedding and sequential
clustering to identify initial anomalies. The
Node2Vec approach is applied to embed the current
graph into Euclidian space, making it possible to use
clustering to reveal the initial anomalies set fed into
BWGNN for further refinement. The detected outliers
and their connections are removed, resulting in a
cleaner dataset. This process is repeated, each
iteration revealing at each step a level in a nested
structure of anomalies within the citation network.
This stable structure is essential for conducting
accurate and meaningful analyses, ensuring reliable
results, and genuinely reflecting the inherent
relationships among the data items.
REFERENCES
Grover, A., Leskovec, J. (2016). Node2vec: Scalable
feature learning for networks. In Proceedings of the
22nd ACM SIGKDD International Conference on
Knowledge Discovery and Data Mining.
Hammond, D. K., Vandergheynst, P., Gribonval, P. (2011).
Wavelets on graphs via spectral graph theory. Applied
and Computational Harmonic Analysis, vol. 30(2), pp.
129-150.
Kaufman, L., Rousseeuw, P.J. (1990). Finding Groups in
Data: An Introduction to Cluster Analysis, John Wiley
& Sons, Inc.
Liu, J., Bai, X., Wang, M., Tuarob, S., Xia, F. (2024).
Anomalous citations detection in academic networks.
Artif Intell Rev, vol. 57, 103. DOI:
https://doi.org/10.1007/ s10462-023-10655-5.
Liu, J.; Xia, F.; Feng, X., Ren, J., Liu., H. (2022). Deep
Graph Learning for Anomalous Citation Detection.
IEEE Transactions on Neural Networks and Learning
Systems, vol. 33(6), pp. 2543-2557, DOI:
10.1109/TNNLS.2022.3145092.
Prabha, C. G. (1983). Some aspects of citation behavior: A
pilot study in business administration. Journal of the
American Society for Information Science, vol. 34(3),
pp. 202–206.
Tang, J., Li, J., Gao, Z., Li, J. (2022). Rethinking Graph
Neural Networks for Anomaly Detection. International
Conference on Machine Learning,
https://api.semanticscholar.org/ CorpusID:249209972.
DMBDA 2025 - Special Session on Dynamic Modeling in Big Data Applications
768
