
Predicting Employee Turnover Using Personality Assessment: A
Data-Driven Approach
Reynold Navarro Mazo
2,3 a
, Maur
´
ıcio Pereira Nogueira J
´
unior
3
,
Arthur Rodrigues Soares de Quadros
1,3 b
, Alessandro Vieira
3 c
and Wladmir Cardoso Brand
˜
ao
1,3 d
1
Department of Computer Science, Pontifical Catholic University of Minas Gerais (PUC Minas), Brazil
2
Institute of Mathematical and Computer Sciences (ICMC), University of S
˜
ao Paulo (USP), S
˜
ao Carlos, SP, Brazil
3
Data Science Laboratory (SOLAB), S
´
olides S.A., Belo Horizonte, MG, Brazil
Keywords:
Machine Learning (ML), Artificial Intelligence, Employee Turnover, Predictive Analytic, Human Resources
(HR), Behavioral Profiling, PACE Framework.
Abstract:
Employee turnover represents a persistent challenge for organizations seeking to maintain stability, retain insti-
tutional knowledge, and control costs. Traditional predictive models often rely on static employee records and
demographic variables, providing limited insight into the nuanced behavioral patterns that precede workforce
attrition. This study leverages the PACE Behavioral Profile Mapping (BPM) framework to integrate behavioral
features into a machine learning–based turnover prediction pipeline. Clustering techniques were employed to
ensure model generalization for specific company clusters, and hyperparameter optimization was performed
using Optuna. The resultant CatBoost models demonstrated notable improvements in predicting turnover risk,
particularly for employees at higher risk of departure, when PACE-based behavioral indicators were incor-
porated. These findings suggest that a more comprehensive characterization of employee tendencies, beyond
conventional demographic and historical measures, can enhance the identification of at-risk individuals. By
adopting behaviorally informed analytics, organizations may achieve more targeted and effective retention
strategies, ultimately supporting more stable workforce management.
1 INTRODUCTION
Employee turnover presents a persistent challenge for
organizations, influencing productivity, operational
continuity, and financial outcomes. Understanding
and predicting turnover risk is crucial for Human Re-
source Management (HRM) to implement effective
retention strategies. Despite the growing availability
of employee data, predicting turnover remains com-
plex, as it often involves multifaceted behavioral and
contextual factors that are not easily quantifiable.
One approach that offers a structured basis for
categorizing and evaluating employee behaviors is
the PACE Behavioral Profile Mapping (BPM) frame-
work (Vieira et al., 2023). By classifying individu-
als into four archetypes (Planner, Analyst, Communi-
cator, and Executor) this framework provides an em-
pirical foundation for examining complex behavioral
patterns within organizational contexts. Given its rel-
a
https://orcid.org/0009-0003-2011-3715
b
https://orcid.org/0009-0004-9593-7601
c
https://orcid.org/0000-0002-9921-3588
d
https://orcid.org/0000-0002-1523-1616
ative novelty, PACE may serve as an underexplored
reference point for systematically investigating sub-
tle interactions and adaptive responses, thereby con-
tributing to a more nuanced understanding of work-
place dynamics.
While PACE provides a theoretically comprehen-
sive framework, its practical effectiveness for predict-
ing turnover has yet to be rigorously evaluated. Be-
havioral profiling is inherently complex, and the ex-
tent to which archetypal classifications and situational
indicators – such as energy, morale, and flexibility –
translate into actionable insights for turnover predic-
tion remains an open question.
This study investigates the integration of the
PACE Behavioral Profile Mapping (BPM) framework
with machine learning techniques to predict employee
turnover using real-world data. By carefully engi-
neering features to address ethical concerns, grouping
companies based on shared turnover patterns for en-
hanced model generalization, and prioritizing recall
to effectively identify at-risk employees, this research
seeks to assess the PACE framework’s practical util-
ity and limitations. The findings aim to inform HR
practitioners and researchers on whether such behav-
582
Mazo, R. N., Nogueira Júnior, M. P., Soares de Quadros, A. R., Vieira, A. and Brandão, W. C.
Predicting Employee Turnover Using Personality Assessment: A Data-Driven Approach.
DOI: 10.5220/0013436400003929
In Proceedings of the 27th International Conference on Enterprise Information Systems (ICEIS 2025) - Volume 1, pages 582-592
ISBN: 978-989-758-749-8; ISSN: 2184-4992
Copyright © 2025 by Paper published under CC license (CC BY-NC-ND 4.0)

ioral profiling approaches can complement existing
methods, ultimately supporting more proactive and
targeted retention strategies.
Our contributions in this paper are as follows:
• We propose a methodology for predicting em-
ployee turnover using behavioral profiling, inte-
grating the PACE framework with machine learn-
ing models.
• We explore clustering techniques to group compa-
nies based on turnover patterns, enhancing model
scalability and generalizability.
• We provide insights into the challenges of
turnover prediction and propose recommenda-
tions for improving data collection and model in-
terpretability in future applications.
2 BACKGROUND
In this section, we specify terms related to this study,
such as Employee Turnover, Machine Learning core
concepts, and the features utilized in our methodol-
ogy.
2.1 Employee Turnover
Employee turnover remains a critical concern for or-
ganizations worldwide due to its substantial impact
on financial performance, operational efficiency, and
overall effectiveness (Hancock et al., 2013). High
turnover rates can lead to increased recruitment and
training costs, loss of organizational knowledge, and
decreased employee morale. Consequently, under-
standing the factors that influence employees’ inten-
tions to leave has become a paramount focus for aca-
demics and professionals in HRM. By exploring these
elements, organizations can develop effective strate-
gies to enhance employee retention, improve produc-
tivity, and maintain a competitive edge in their respec-
tive industries. However, to implement these strate-
gies successfully, it is crucial to identify potential
turnover risks early. Early identification of employees
who may be considering departure allows organiza-
tions to proactively address underlying issues, tailor
retention initiatives, and ultimately mitigate the ad-
verse effects associated with high turnover rates.
2.2 Machine Learning
2.2.1 Supervised Machine Learning
Supervised learning is particularly suitable for
turnover classification because it leverages labeled
data to predict outcomes. This works in contrast to
unsupervised machine learning, where it uses only the
input features X without corresponding labels Y and
is typically used for clustering or anomaly detection,
which is less applicable in this context. In scenarios
where labeled data is scarce, semi-supervised learn-
ing can be an alternative. This method uses a small
portion of labeled data along with a larger set of unla-
beled data to improve learning accuracy.
Our study focuses on supervised machine learning
methods, specifically utilizing algorithms like Ran-
dom Forest and Logistic Regression, which will be
detailed in subsequent sections. Typically, the dataset
is split into training and testing subsets, often in an 80-
20 ratio. The model is trained on 80% of the data and
tested on the remaining 20% to evaluate its perfor-
mance. The supervised learning approach is advanta-
geous when ample labeled data is available, allowing
the model to learn intricate patterns that distinguish
employees who are likely to leave from those who are
not. This method is also adaptable for making predic-
tions on new data, enabling organizations to identify
at-risk employees proactively.
2.2.2 Training and Testing
In the realm of supervised machine learning, the fun-
damental concepts of training and testing data are piv-
otal for developing predictive models. These models
learn from data pairs {X, Y }, where X represents the
input features – such as employee demographics, job
satisfaction scores, and performance metrics –, and Y
denotes the target variable, in this case, the turnover
status i.e., whether an employee stays or not.
The training dataset is employed to teach the
model’s underlying patterns and relationships be-
tween X and Y . Once trained, the model’s efficacy is
evaluated using the testing dataset, which assesses its
ability to generalize and make accurate predictions on
new, unseen data. This process ensures that the model
is not merely memorizing the training data but is ca-
pable of predicting turnover intentions in a real-world
setting.
2.3 Features for Turnover Classification
At the organizational level, subtle indicators related
to the composition of the workforce, the structure of
internal roles and units, the general patterns of staff
tenure, the degree to which systematic behavioral as-
sessments are embedded in the corporate routine, and
the cumulative record of prior separations collectively
offer a nuanced perspective on turnover dynamics.
Analyzing these interconnected signals allows for a
Predicting Employee Turnover Using Personality Assessment: A Data-Driven Approach
583

more comprehensive understanding of how organiza-
tional characteristics and embedded practices shape
both retention outcomes and the likelihood of depar-
tures.
The PACE BPM framework (Vieira et al., 2023)
offers a probabilistic approach to quantifying indi-
vidual behavioral tendencies through four distinct
archetypes: Planner, Analyst, Communicator, and
Executor. These archetypes provide a structured
framework for understanding employee behavior pat-
terns in response to workplace stimuli, which makes
them particularly useful for predicting turnover. Each
archetype embodies a unique response rhythm, high-
lighting specific personality traits and work prefer-
ences. For example, “Planners” prioritize stabil-
ity, meticulous preparation, and adherence to rules,
while “Executors” excel in fast-paced, dynamic envi-
ronments requiring decisive and energetic responses.
Meanwhile, “Communicators” thrive in collaborative,
socially engaging settings, and “Analysts” emphasize
precision, organization, and methodical approaches
within structured contexts.
This framework enables organizations to evaluate
not only the dominant behavioral traits of employ-
ees but also situational indicators such as energy lev-
els, morale, flexibility, and motivation. Such granular
profiling provides valuable insights into how employ-
ees engage with their work environment and adapt to
varying demands. By incorporating these behavioral
insights as features together with the non-behavioral
features into machine learning models, organizations
could enhance their ability to predict turnover risks,
ensuring alignment between employees’ behavioral
tendencies and their roles within the workplace. This
integration facilitates more proactive and targeted re-
tention strategies, contributing to organizational sta-
bility and efficiency.
3 RELATED WORKS
Employee turnover remains a critical challenge for
organizations, significantly affecting financial perfor-
mance, operational stability, and long-term organiza-
tional growth. High turnover rates increase recruit-
ment and training costs, leading to the loss of institu-
tional knowledge, and lower employee morale. These
impacts are particularly pronounced in industries such
as manufacturing and services, where skilled labor is
integral to maintaining productivity. (Veglio et al.,
2024) highlight that turnover in multinational compa-
nies disrupts strategic continuity and operational ef-
ficiency, emphasizing the need for tailored retention
strategies informed by predictive analytics.
Artificial intelligence (AI) and advanced analytics
have become essential tools in addressing employee
turnover. (Gopinath and Appavu alias Balamurugan,
2024) explore the role of human resource analytics,
demonstrating how machine learning models can in-
tegrate behavioral, demographic, and organizational
data to predict turnover risk. Their study shows that
AI can provide actionable insights, enabling HR pro-
fessionals to implement targeted interventions for at-
risk employees. However, they also acknowledge
challenges such as the potential for data bias and the
need for transparent algorithms to maintain employee
trust.
(Mar
´
ın D
´
ıaz et al., 2023) examine the integration
of traditional employee metrics with behavioral data
for predicting turnover. Their work highlights the im-
portance of incorporating factors like job satisfaction
and career development opportunities into predictive
models. Similarly, (Morelli et al., 2024) investigates
clustering techniques to group employees based on
turnover propensity, enhancing the interpretability of
predictive models.
Moreover, probabilistic approaches to behavioral
profiling are gaining attention in turnover research.
(Gopinath and Appavu alias Balamurugan, 2024) em-
phasize that behavioral profiling frameworks, such as
those mapping archetypes or response rhythms, can
improve turnover predictions by integrating qualita-
tive insights with quantitative metrics. This com-
plements the findings of (Veglio et al., 2024), who
stress the importance of blending behavioral insights
with organizational data to address the complexities
of turnover dynamics in multi-national contexts.
Studies on turnover prediction show results are
highly dependent on the dataset used. (Park et al.,
2024) achieved 78.5% accuracy using XGBoost on
the Korean 2019 Graduate Occupation Mobility Sur-
vey. (Lim et al., 2024) achieved over 90% accu-
racy on the IBM Employee Attrition dataset using
a hybrid KNN-based model. (Chakraborty et al.,
2021) reached 90% with Random Forest and 80%
with Naive Bayes. (Al Akasheh et al., 2024) achieved
92.5% on the same IBM dataset using Knowledge
Convolutional Networks. Still on the IBM dataset,
(Yi
˘
git and Shourabizadeh, 2017) used data mining
for over 80% average precision, and (Ozdemir et al.,
2020) used various methods for 75% precision.
To our knowledge, no studies directly use BPM
information for turnover prediction. (Tsaousoglou,
2021) argue that psychometric assessment is crucial
to ensure employees can learn and maintain job per-
formance. (Li et al., 2022) discuss how different pro-
files have varying motivations, requiring different re-
tention strategies. Similarly, (Emerson et al., 2023)
ICEIS 2025 - 27th International Conference on Enterprise Information Systems
584
show how psychometric assessments of stress and
burnout contribute to student dropout rates, suggest-
ing different profiles respond differently to incentives.
All mentioned studies collectively underscore the
value of AI-driven analytics in turnover prediction
while highlighting key challenges, including data
quality, ethical concerns, and model interpretability.
This paper builds on prior work by integrating behav-
ioral profiling through the PACE framework with ma-
chine learning models, prioritizing recall to enhance
the identification of at-risk employees. By addressing
these challenges, this study contributes to the devel-
opment of scalable, actionable, and ethical solutions
for managing employee turnover.
4 METHODOLOGY
This study investigates the application of machine
learning techniques for employee turnover predic-
tion using the PACE behavioral profiling framework.
The methodology aims to balance predictive accu-
racy, ethical considerations, and practical applicabil-
ity, while addressing challenges related to data vari-
ability across different organizations and ensuring
generalizability across a wide range of enterprise con-
texts.
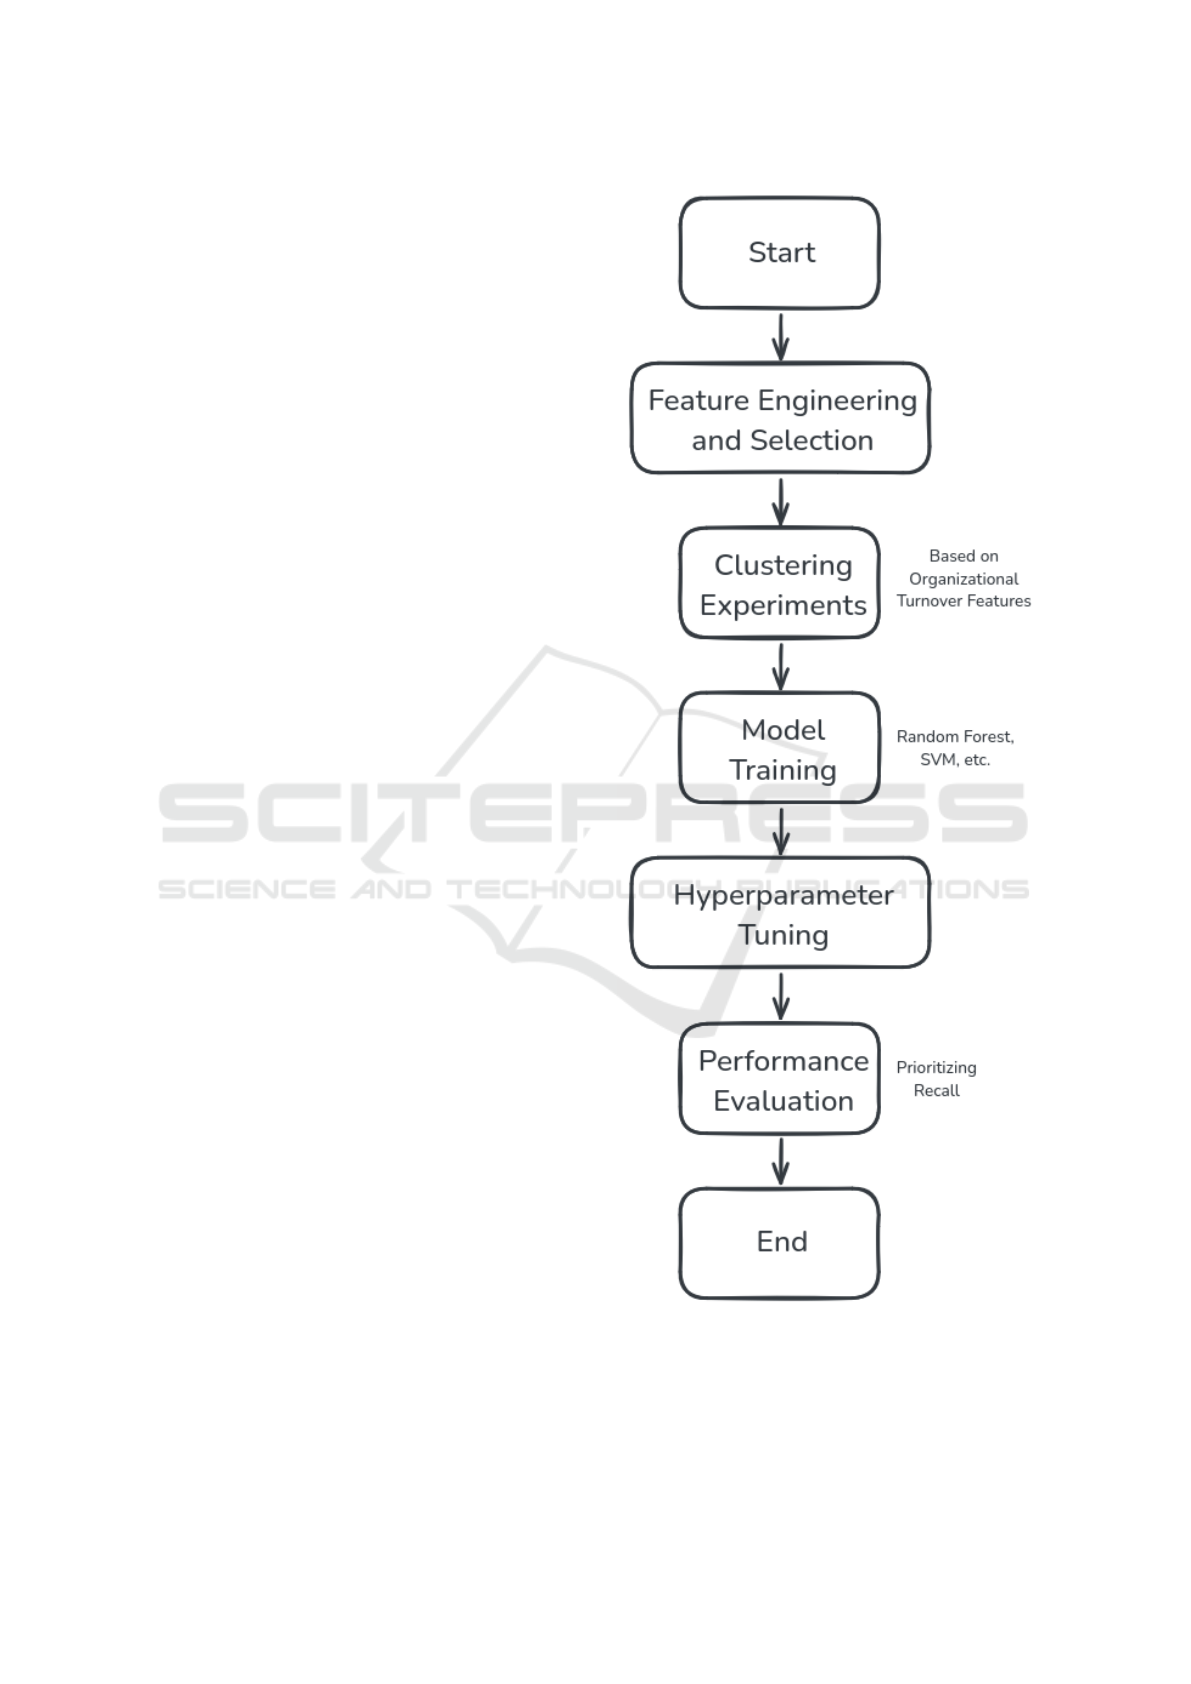
The methodology is outlined in Figure 1, which
illustrates the key steps that guided the experimental
process. Each step in the flowchart represents a crit-
ical phase in the development and evaluation of the
proposed approach, ensuring a systematic and struc-
tured workflow.
4.1 Modeling Strategy
4.1.1 Feature Engineering and Selection
Feature engineering was guided by both practical and
ethical considerations. In particular, features with
potential ethical implications, such as those related
to demographic attributes or hierarchical status, were
purposefully excluded to maintain fairness and com-
pliance with regulatory standards. Instead, derived
features concentrated on organizational and behav-
ioral metrics, including the proportional relationship
between an individual’s tenure and the average tenure
within the company, the density of turnover occur-
rences over specified intervals, and aspects derived
from the PACE framework. By favoring these con-
structs, the feature set aimed to retain predictive util-
ity while mitigating biases and ethical concerns.
Correlation analysis was performed to identify
and remove multicollinear features. Additionally,
Figure 1: Methodology Flowchart. This diagram represents
the steps and processes used in the proposed methodology.
feature importance was evaluated using preliminary
model tests, with preference given to interpretable
features.
Predicting Employee Turnover Using Personality Assessment: A Data-Driven Approach
585

4.1.2 Clustering Strategy
Initially, turnover prediction models were developed
for individual companies or sectors, requiring a min-
imum volume of data to enable training, as shown
in the study (Adeusi et al., 2024), which applies ma-
chine learning techniques to predict turnover in high-
stress sectors. However, this approach proved imprac-
tical for smaller companies due to insufficient data
and the recurring cost of tailoring models to each
new organization. To overcome these limitations,
a unified modeling approach was explored, group-
ing companies with shared characteristics to main-
tain individual-level relevance while reducing mod-
eling costs.
The grouping was primarily driven by the
score company variable, which represents a turnover
density rate adjusted for time, reflecting company-
specific turnover characteristics. This approach aimed
to achieve meaningful predictions, especially in con-
texts where the goal is proactive retention interven-
tions, even if this means prioritizing recall over accu-
racy to capture a larger number of potential turnover
cases.
The clustering strategy aimed to identify more
uniform training subsets by grouping company’s
based on a combination of organizational-level met-
rics. Initially, a single metric served as a foundation,
score company, however, more balanced and repre-
sentative groupings emerged when additional features
were considered in conjunction. Integrating a broader
range of features—encompassing organizational vol-
ume, indicators of workforce separations, tempo-
ral retention measures, and the original foundational
score
company. To determine the optimal number of
clusters, the Elbow Method was employed, allowing
the selection of an appropriate partitioning threshold
that minimized within-cluster variance while avoid-
ing overfitting. The final clustering was performed
using the k-means algorithm, which efficiently parti-
tioned the data into meaningful, internally cohesive
groups, thereby facilitating more robust and general-
izable turnover prediction.
4.1.3 Machine Learning Models
Various ML models were tested, including neural net-
works as Long Short-Term Memory (LSTM) based,
Support Vector Machine (SVM), Random Forest,
XGBoost, and CatBoost. The following strategies
were implemented:
• Hyperparameter Tuning. Optuna (Akiba et al.,
2019) was used to optimize model hyperparame-
ters.
• Data Imbalance Management. Oversam-
pling technique Synthetic Minority Oversampling
Technique (SMOTE) (Chawla et al., 2011) were
combined with manually tuned class weights to
address imbalances and ensure meaningful pre-
dictions without overly passive or alarmist results.
4.2 Evaluation Metrics
Predictive performance was evaluated using the recall
metric, which prioritizes the identification of true pos-
itives over precision and overall accuracy. Recall is
calculated as follows:
Recall =
True Positives (TP)
True Positives (TP) + False Negatives (FN)
This approach ensures the model captures the
maximum number of employees at risk of turnover,
aligning with the goal of enabling proactive retention
strategies. While precision and overall accuracy were
considered, the trade-off with recall was deemed ap-
propriate for the specific application. Precision is cal-
culated as follows:
Prec. =
True Positives (TP)
True Positives (TP) + False Positives (FP)
Additionally, the F1-score, which balances preci-
sion and recall, was also considered. It is defined as
the harmonic mean of precision and recall:
F1 = 2 ×
Precision × Recall
Precision + Recall
Accuracy, which measures the proportion of cor-
rectly predicted instances, is given by:
Acc. =
True Positives (TP) + True Negatives (TN)
Total Predictions
Metrics were examined at the aggregate level for
both experimental setups, incorporating class balanc-
ing and oversampling techniques. Following this ini-
tial assessment, the best-performing model was sub-
jected to hyperparameter optimization (Akiba et al.,
2019). Subsequently, metrics were re-evaluated to
compare the model’s performance when utilizing the
complete set of features against the configuration ex-
cluding the PACE framework features.
5 RESULTS
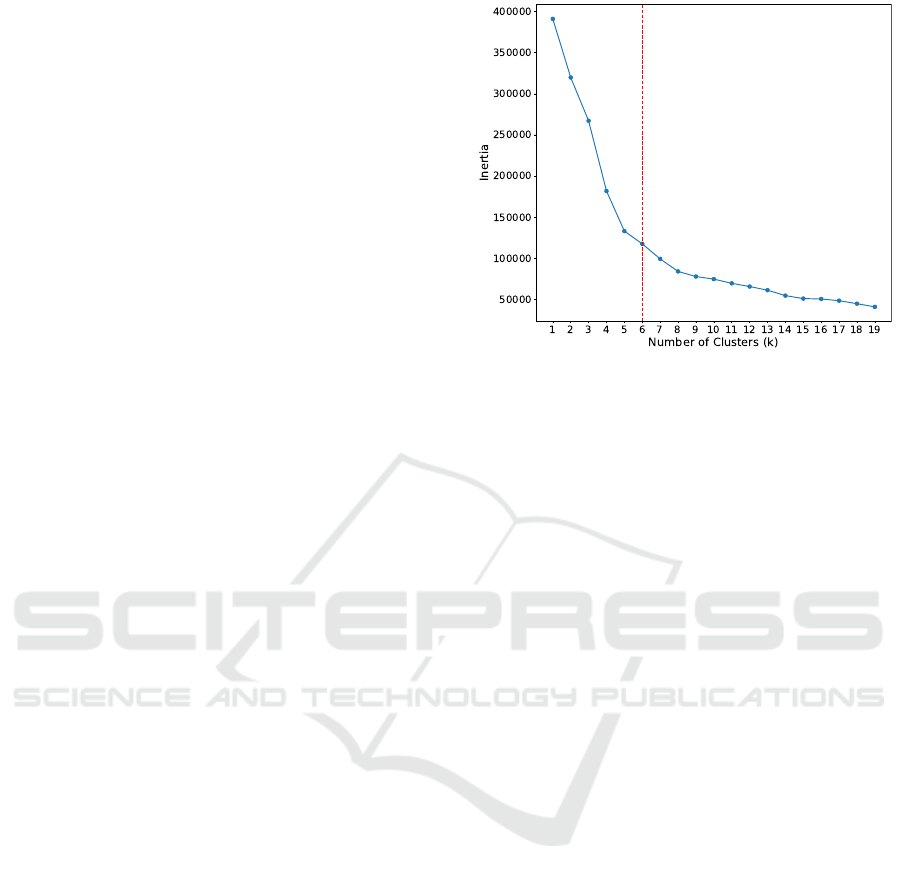
5.1 Clustering Analysis
To improve the predictive accuracy of turnover mod-
els, a clustering strategy was implemented to group
ICEIS 2025 - 27th International Conference on Enterprise Information Systems
586
companies based on shared characteristics derived
from key turnover metrics. The Elbow Method was
used to determine the optimal number of clusters, bal-
ancing model complexity and performance. As shown
in the Elbow Curve (Figure 2), the point of inflection
occurs at k = 6, suggesting that six clusters provide an
appropriate representation of the data while avoiding
overfitting.
Each cluster was analyzed individually, with sepa-
rate predictive models evaluated within these groups.
This clustering strategy allowed the models to ac-
count for inter-company variations in turnover behav-
ior and better adapt to specific organizational con-
texts. By tailoring the prediction models to clusters,
the following advantages were observed:
1. Increased Recall. Models trained within clusters
demonstrated higher recall for the minority class
(class 1), indicating better identification of em-
ployees at high turnover risk.
2. Balanced Metrics. Accuracy and F1-scores were
more evenly distributed across clusters, reflect-
ing improved generalization compared to a single,
non-clustered model.
3. Interpretable Results. Clustering enabled a bet-
ter understanding of company-specific patterns,
such as turnover density, regional impacts, and
operational constraints.
The resulting performance metrics for the mod-
els (LSTM, SVM, XGBoost, and CatBoost) were
summarized across all clusters, detailing precision,
recall, and F1-scores for each class. This demon-
strates the efficacy of leveraging clustering as a pre-
processing step to improve the predictive power of
machine learning models in turnover prediction tasks.
Moreover, the tailored approach ensures actionable
insights for companies with varying sizes and oper-
ational characteristics.
5.2 Experimentation with Weight
Balancing
Weight balancing was employed to address the inher-
ent class imbalance in turnover prediction, where the
minority class (employees likely to leave) is often un-
derrepresented. This approach aimed to enhance re-
call for the minority class (class 1) without signifi-
cantly compromising precision for the majority class
(class 0). Table 1 summarizes the performance met-
rics for LSTM, SVM, XGBoost, and CatBoost mod-
els across all clusters when weight balancing was ap-
plied.
The results demonstrate that weight balancing im-
proved the recall and F1-scores for class 1 in all mod-
Figure 2: Elbow Method for KMeans Clustering.
els, particularly in clusters with higher turnover den-
sity. This adjustment ensures the models can bet-
ter identify employees at risk of leaving, supporting
proactive retention strategies while maintaining ade-
quate performance for class 0. The experimentation
highlights the utility of weight balancing in mitigat-
ing class imbalance challenges in turnover prediction.
Among the models evaluated, CatBoost consis-
tently achieved the best overall performance across
clusters, with high precision and recall for both
classes, balancing predictive accuracy and generaliza-
tion effectively
5.3 Experimentation with SMOTE
SMOTE (Chawla et al., 2011) was applied to address
class imbalance by generating synthetic samples for
the minority class (employees likely to leave). The
primary objective of using SMOTE was to enhance
recall for class 1 while maintaining balanced perfor-
mance across other metrics. Table 2 presents the per-
formance metrics for LSTM, SVM, XGBoost, and
CatBoost models across all clusters when SMOTE
was employed.
Contrary to expectations, the use of SMOTE did
not result in consistent improvements in recall for
class 1. While some models, such as CatBoost, main-
tained relatively stable performance across clusters,
the recall for class 1 generally decreased compared
to models trained without SMOTE. For instance, Cat-
Boost achieved a maximum recall of only 42% for
class 1 in cluster 4, whereas recall for other models,
such as XGBoost, dropped to as low as 24% in certain
clusters. These results indicate that SMOTE’s over-
sampling may have introduced noise or distorted the
feature space, leading to suboptimal performance for
the minority class.
Predicting Employee Turnover Using Personality Assessment: A Data-Driven Approach
587

Table 1: Combined Performance Metrics Across Clusters for Turnover Prediction using Weight Balance.
No. Model Cluster Class Accuracy (%) Precision (%) Recall (%) F1-Score (%)
1 LSTM
1
0 62.00 80.00 61.00 69.00
1 39.00 62.00 48.00
2
0 59.00 91.00 57.00 70.00
1 23.00 69.00 34.00
3
0 63.00 88.00 64.00 74.00
1 28.00 62.00 39.00
4
0 61.00 84.00 61.00 71.00
1 31.00 59.00 41.00
5
0 59.00 86.00 59.00 70.00
1 28.00 61.00 38.00
6
0 62.00 91.00 61.00 73.00
1 23.00 67.00 34.00
2 SVM
1
0 58.00 81.00 54.00 65.00
1 37.00 68.00 48.00
2
0 61.00 91.00 60.00 72.00
1 23.00 67.00 35.00
3
0 61.00 88.00 61.00 72.00
1 28.00 64.00 39.00
4
0 63.00 85.00 63.00 72.00
1 33.00 63.00 43.00
5
0 58.00 87.00 56.00 68.00
1 27.00 66.00 39.00
6
0 63.00 91.00 62.00 74.00
1 23.00 66.00 34.00
3 XGBoost
1
0 64.00 78.00 69.00 73.00
1 40.00 51.00 45.00
2
0 84.00 89.00 92.00 91.00
1 48.00 40.00 43.00
3
0 77.00 86.00 86.00 86.00
1 40.00 41.00 41.00
4
0 78.00 85.00 87.00 86.00
1 51.00 48.00 50.00
5
0 73.00 85.00 80.00 82.00
1 36.00 45.00 40.00
6
0 81.00 89.00 89.00 89.00
1 37.00 37.00 37.00
4 CatBoost
1
0 63.00 81.00 62.00 70.00
1 40.00 63.00 49.00
2
0 70.00 93.00 70.00 80.00
1 30.00 71.00 42.00
3
0 72.00 89.00 76.00 82.00
1 36.00 58.00 44.00
4
0 72.00 86.00 76.00 81.00
1 42.00 58.00 49.00
5
0 68.00 87.00 70.00 77.00
1 33.00 59.00 42.00
6
0 73.00 91.00 76.00 83.00
1 29.00 57.00 39.00
Although SMOTE did not meet its intended goal
of improving recall for class 1, it slightly increased
precision and F1-scores for class 0 in most mod-
els, indicating better representation of the majority
class. This highlights a potential trade-off between
oversampling and predictive accuracy, emphasizing
the need for tailored strategies to handle imbalanced
datasets in turnover prediction.
Our experiments showed that applying SMOTE
to address class imbalance did not improve perfor-
mance. This is likely due to the complex structure
of the turnover dataset. The minority class (employ-
ees likely to leave) overlaps significantly with the ma-
jority class. SMOTE’s synthetic samples did not ac-
ICEIS 2025 - 27th International Conference on Enterprise Information Systems
588

curately capture the data distribution, adding noise
and increasing overfitting. The high dimensionality
of our features also complicated SMOTE’s interpo-
lation, reducing the discriminative power of the aug-
mented data. These findings suggest weight balancing
may be more effective than SMOTE for this dataset’s
class imbalance.
5.4 Best Model Selection: CatBoost
with Class Weights and
Hyperparameter Tuning
Based on the results of previous experiments, the Cat-
Boost model with class weight balancing emerged as
the most suitable for turnover prediction. This model
demonstrated consistent performance across clusters,
excelling in recall for the minority class (class 1)
while maintaining robust metrics for the majority
class (class 0). To further enhance its predictive ca-
pability, hyperparameter tuning was performed using
the Optuna framework, which systematically searches
for the optimal combination of parameters to maxi-
mize performance.
5.4.1 Hyperparameter Tuning with Optuna
Optuna (Akiba et al., 2019) is a state-of-the-art frame-
work for automated hyperparameter optimization.
The tuning process focused on improving recall for
class 1, a critical metric for turnover prediction. Key
parameters optimized during the process included:
• Learning Rate. Controlled the step size at each
iteration of model training.
• Depth. Defined the maximum depth of the de-
cision trees in the model, impacting its ability to
capture complex patterns.
• L2 Regularization. Mitigated overfitting by pe-
nalizing large weights, ensuring generalization.
• Bagging Temperature. Adjusted the variability
in data subsampling during training to balance di-
versity and stability.
The optimization objective prioritized maximiz-
ing recall for class 1 while ensuring balanced perfor-
mance across other metrics.
5.4.2 Performance Metrics of the Best Model
The final performance metrics of the CatBoost model,
presented in Table 3, underscore the model’s capac-
ity to handle turnover prediction and lend support
to the hypothesis that incorporating the PACE be-
havioral features enhances predictive performance.
When compared to the configuration excluding PACE
features, the full feature set consistently achieved
higher accuracy and improved F1-scores for the posi-
tive (turnover) class across all examined clusters. This
pattern suggests that behavioral indicators captured
by the PACE framework provide actionable informa-
tion that augments traditional organizational metrics,
ultimately contributing to more robust and nuanced
turnover predictions.
Key observations for the best model when utiliz-
ing the complete feature set include:
• Class 0 (Majority Class). The model consis-
tently achieved high precision and recall across
all clusters, with F1-scores ranging from approxi-
mately 75% to 81%.
• Class 1 (Minority Class). Recall values im-
proved notably, reaching up to 76% in certain
clusters, while F1-scores varied between 42% and
56%. These results indicate a substantive increase
in the detection of actual turnover cases.
These findings emphasize the potential value of
incorporating behavioral features derived from pro-
filing frameworks like PACE into turnover predic-
tion efforts. The CatBoost model, especially after
hyperparameter tuning, performed better when these
PACE-based inputs were included, underscoring their
added value over configurations relying solely on tra-
ditional organizational metrics. Although overall im-
provements in minority class detection were moder-
ate, the inclusion of behavioral indicators contributed
to more nuanced insights and enhanced recall rates,
ultimately supporting more informed and targeted re-
tention strategies.
5.4.3 Insights and Implications
The CatBoost model, with its tuned parameters and
the integration of behavioral features derived from the
PACE framework, not only achieved robust perfor-
mance for the majority class but also demonstrated
improved recall for the minority class. This balanced
performance is particularly valuable for actionable
turnover predictions, as it enables HR professionals
to more accurately identify at-risk employees while
preserving precision for those likely to remain.
The experiment highlights the importance of com-
bining class weighting strategies, advanced hyperpa-
rameter optimization frameworks such as Optuna, and
the incorporation of behavioral profiling features to
achieve superior results in complex predictive tasks.
These findings underscore the potential of tailored,
behaviorally-informed machine learning approaches
for addressing organizational challenges, ensuring
that models remain both interpretable and actionable
for HR decision-making.
Predicting Employee Turnover Using Personality Assessment: A Data-Driven Approach
589

Table 2: Combined Performance Metrics Across Clusters for Turnover Prediction using SMOTE.
No. Model Cluster Class Accuracy (%) Precision (%) Recall (%) F1-Score (%)
1 LSTM
1
0 58.00 79.00 58.00 66.00
1 36.00 60.00 45.00
2
0 70.00 88.00 76.00 81.00
1 23.00 40.00 29.00
3
0 65.00 87.00 67.00 75.00
1 28.00 56.00 37.00
4
0 62.00 83.00 65.00 73.00
1 31.00 54.00 39.00
5
0 60.00 84.00 62.00 71.00
1 27.00 55.00 36.00
6
0 69.00 89.00 72.00 80.00
1 24.00 49.00 32.00
2 SVM
1
0 62.00 78.00 66.00 71.00
1 38.00 53.00 44.00
2
0 68.00 88.00 72.00 79.00
1 23.00 46.00 30.00
3
0 66.00 86.00 70.00 77.00
1 28.00 50.00 36.00
4
0 66.00 83.00 70.00 76.00
1 33.00 50.00 40.00
5
0 66.00 84.00 70.00 77.00
1 29.00 48.00 36.00
6
0 71.00 90.00 74.00 81.00
1 25.00 50.00 34.00
3 XGBoost
1
0 69.00 75.00 84.00 79.00
1 43.00 31.00 36.00
2
0 83.00 89.00 92.00 90.00
1 45.00 34.00 39.00
3
0 80.00 84.00 93.00 88.00
1 43.00 24.00 31.00
4
0 75.00 83.00 85.00 84.00
1 44.00 40.00 42.00
5
0 78.00 83.00 92.00 87.00
1 44.00 24.00 31.00
6
0 83.00 88.00 93.00 90.00
1 40.00 27.00 32.00
4 CatBoost
1
0 72.00 75.00 90.00 82.00
1 51.00 25.00 34.00
2
0 83.00 88.00 93.00 90.00
1 43.00 29.00 34.00
3
0 81.00 84.00 94.00 89.00
1 49.00 23.00 32.00
4
0 78.00 84.00 88.00 86.00
1 51.00 42.00 46.00
5
0 80.00 82.00 95.00 88.00
1 52.00 20.00 29.00
6
0 84.00 88.00 94.00 91.00
1 43.00 27.00 33.00
5.5 Discussions About PACE
5.5.1 Limitations for Turnover Prediction
While the PACE framework effectively assesses indi-
vidual responses in specific situations, Profiler reports
alone cannot directly measure performance. This lim-
itation can be addressed by analyzing changes in pre-
vious test results, evaluating environmental demands,
and measuring individual adaptation. Poor adaptation
could suggest performance issues.
Since PACE is a self-report tool, accurate self-
assessment is crucial. If an individual cannot accu-
rately assess environmental demands or their own per-
sonality traits, the resulting data may not reflect true
performance, leading to inaccurate conclusions.
ICEIS 2025 - 27th International Conference on Enterprise Information Systems
590
Table 3: Performance Metrics Across Clusters for Turnover Prediction Best Model CatBoost.
No. Model Cluster Class Accuracy (%) Precision (%) Recall (%) F1-Score (%)
1 All features - CatBoost
1
0 68.00 86.00 66.00 75.00
1 46.00 72.00 56.00
2
0 71.00 96.00 69.00 80.00
1 33.00 84.00 47.00
3
0 73.00 92.00 73.00 81.00
1 38.00 73.00 50.00
4
0 71.00 89.00 71.00 79.00
1 41.00 69.00 52.00
5
0 72.00 92.00 71.00 80.00
1 39.00 76.00 52.00
6
0 72.00 93.00 72.00 81.00
1 30.00 70.00 42.00
2 Non PACE Features-CatBoost
1
0 65.00 84.00 63.00 72.00
1 43.00 71.00 53.00
2
0 67.00 96.00 63.00 76.00
1 30.00 87.00 44.00
3
0 69.00 92.00 68.00 78.00
1 35.00 75.00 48.00
4
0 67.00 85.00 70.00 77.00
1 36.00 58.00 45.00
5
0 69.00 91.00 68.00 78.00
1 37.00 74.00 49.00
6
0 70.00 93.00 70.00 80.00
1 29.00 69.00 41.00
5.5.2 PACE-Based Retention Strategies
HR can use PACE results to develop targeted reten-
tion strategies. Profiler results reveal how individ-
uals respond to specific situations, allowing HR to
place employees in preferred environments and mini-
mize conflict. For example, assigning an Analyst to a
communication-focused role could cause stress, forc-
ing them into undesired situations. While such as-
signments might be necessary at times, Profiler data
helps HR to avoid unsuitable reassignments that could
lead to employee attrition.
6 CONCLUSIONS AND FUTURE
WORKS
One of the key challenges and considerations in
turnover prediction is addressing ethical concerns. To
mitigate the risk of biased predictions, features with
potential ethical implications were excluded. For in-
stance, while state-level data (UF) was initially con-
sidered, it ultimately proved both resource-intensive
and inconsistent to collect, resulting in its removal.
Another challenge lies in the data limitations
themselves. A significant hindrance to model devel-
opment was the incomplete and inconsistent logging
of employee turnover data by organizations. Encour-
aging companies to maintain continuous and accurate
data recording practices could substantially enhance
the quality of future predictive models. By improving
data reliability, these efforts would not only refine the
accuracy and robustness of turnover predictions but
also facilitate their broader application across varied
organizational settings.
Turnover prediction is inherently complex due to
the multifaceted and evolving factors influencing em-
ployee decisions. Evaluating the effectiveness of such
models poses a particular challenge: successful reten-
tion strategies may, by design, lower turnover rates,
thus diminishing the apparent predictive accuracy.
To address this, subsequent rounds of profiling af-
ter retention interventions can provide a more reliable
gauge of their true impact. Moreover, presenting re-
sults as probability intervals rather than categorical
outcomes facilitates a more consultative, analytics-
driven approach, allowing HR professionals to inter-
pret these predictions as indicative trends rather than
definitive forecasts.
For future improvements, the focus should be on
enhancing the predictive capabilities of turnover mod-
els by integrating temporal data and expanding the
range of features. Incorporating time-based informa-
tion can reveal critical patterns and trends preceding
turnover events. Key avenues for improvement in-
clude:
• Temporal Data Integration. Incorporating time-
series data such as changes in employee perfor-
Predicting Employee Turnover Using Personality Assessment: A Data-Driven Approach
591

mance metrics, tenure progression, and fluctua-
tions in workload can provide deeper insights into
the dynamics influencing turnover.
• Additional Features. Introducing new variables
like employee engagement scores, satisfaction
surveys, training participation, and career devel-
opment opportunities can enrich the dataset and
enhance model accuracy.
• Longitudinal Analysis. Employing longitudinal
studies to track employee behavior over extended
periods may uncover latent factors contributing to
turnover, enabling more proactive interventions.
• External Factors. Including external data such as
economic indicators, industry trends, and regional
employment rates can help contextualize turnover
patterns within the broader market environment.
By expanding the feature set and integrating tem-
poral aspects, future models can achieve improved
generalization and predictive performance. These
enhancements would allow organizations to iden-
tify at-risk employees more accurately and imple-
ment targeted retention strategies, ultimately reducing
turnover rates and associated costs.
REFERENCES
Adeusi, K., Amajuoyi, P., and Benjami, L. (2024). Utiliz-
ing machine learning to predict employee turnover in
high-stress sectors. International Journal of Manage-
ment & Entrepreneurship Research, 6:1702–1732.
Akiba, T., Sano, S., Yanase, T., Ohta, T., and Koyama, M.
(2019). Optuna: A Next-generation Hyperparameter
Optimization Framework.
Al Akasheh, M., Hujran, O., Malik, E. F., and Zaki,
N. (2024). Enhancing the prediction of employee
turnover with knowledge graphs and explainable ai.
IEEE Access.
Chakraborty, R., Mridha, K., Shaw, R. N., and Ghosh, A.
(2021). Study and prediction analysis of the employee
turnover using machine learning approaches. In 2021
IEEE 4th International Conference on Computing,
Power and Communication Technologies (GUCON),
pages 1–6. IEEE.
Chawla, N. V., Bowyer, K. W., Hall, L. O., and Kegelmeyer,
W. P. (2011). SMOTE: Synthetic Minority Over-
sampling Technique.
Emerson, D. J., Hair Jr, J. F., and Smith, K. J. (2023).
Psychological distress, burnout, and business student
turnover: The role of resilience as a coping mecha-
nism. Research in higher education, 64(2):228–259.
Gopinath, K. and Appavu alias Balamurugan, S. (2024).
Human Resource Analytics: Leveraging Machine
Learning for Employee Attrition Prediction. pages
137–158.
Hancock, J. I., Allen, D. G., Bosco, F. A., McDaniel, M.,
and Pierce, C. A. (2013). Meta-analytic review of em-
ployee turnover as a predictor of firm performance.
Journal of Management, 39(3):573–603.
Li, H., Yuan, B., Yu, Y., Li, J., and Meng, Q. (2022).
Work motivation of primary health workers in china:
the translation of a measurement scale and its corre-
lation with turnover intention. Risk Management and
Healthcare Policy, pages 1369–1381.
Lim, C. S., Malik, E. F., Khaw, K. W., Alnoor, A., Chew, X.,
Chong, Z. L., and Al Akasheh, M. (2024). Hybrid ga–
deepautoencoder–knn model for employee turnover
prediction. Statistics, Optimization & Information
Computing, 12(1):75–90.
Mar
´
ın D
´
ıaz, G., Gal
´
an Hern
´
andez, J. J., and Gald
´
on Sal-
vador, J. L. (2023). Analyzing Employee Attrition
Using Explainable AI for Strategic HR Decision-
Making. 11(22):4677.
Morelli, C., Fusai, G., and Zenti, R. (2024). Who and
why will leave me? Utilizing Machine Learning-
Based Models to Anticipate and Manage Employee
Turnover. (4744130).
Ozdemir, F., Coskun, M., Gezer, C., and Gungor, V. C.
(2020). Assessing employee attrition using classifi-
cations algorithms. In Proceedings of the 2020 the 4th
International Conference on Information System and
Data Mining, ICISDM ’20, page 118–122, New York,
NY, USA. Association for Computing Machinery.
Park, J., Feng, Y., and Jeong, S.-P. (2024). Developing an
advanced prediction model for new employee turnover
intention utilizing machine learning techniques. Sci-
entific Reports, 14(1):1221.
Tsaousoglou, K. (2021). Using psychometrics in
Human Resource Management in tourist accom-
modation: Employees’ predisposition for organi-
zational turnover. PhD thesis, Πανεπιστ
´
ηµιo
Πατρ
´
ων. Σχoλ
´
η ∆ιo
´
ικησης και Oικoνoµ
´
ιας.
Tµ
´
ηµα ∆ιo
´
ικησης . . . .
Veglio, V., Romanello, R., and Pedersen, T. (2024). Em-
ployee turnover in multinational corporations: A su-
pervised machine learning approach.
Vieira, A. G., de Jesus, A. C. C., da Assunc¸
˜
ao Almeida de
Lima, J., Mariano, R. V. R., de Castro, G. Z., and
Brand
˜
ao, W. C. (2023). A probabilistic mapping ap-
proach to assess the employee behavior profile. pages
1–8. ISSN: 2378-1971.
Yi
˘
git,
˙
I. O. and Shourabizadeh, H. (2017). An approach
for predicting employee churn by using data mining.
In 2017 International Artificial Intelligence and Data
Processing Symposium (IDAP), pages 1–4.
ICEIS 2025 - 27th International Conference on Enterprise Information Systems
592
