
Visual Intelligence for Program Animation
Mohamed Moussa and Nada Sharaf
The German International University, Cairo, Egypt
Keywords:
Program Visualization, Interactive Learning Environments, Program Animation, Algorithm Visualizer.
Abstract:
This paper introduces CodeMotion: an AST-driven web-based program visualization tool designed to improve
learners’ understanding of JavaScript code execution and algorithmic concepts through interactive visual ex-
ploration. By parsing user-submitted code into Abstract Syntax Trees (ASTs), the system enables secure,
step-by-step simulations of program logic without direct execution, addressing common security and scalabil-
ity issues found in traditional approaches. In contrast to existing browser-based and educational visualization
tools, our platform offers granular control over the execution process, supports algorithm visualization (e.g.,
sorting), and is easily extendable to other code structures. Usability testing with a sample of computer sci-
ence students demonstrates that this approach reduces complexity, increases user confidence, and leads to
measurable improvements in comprehension. The tool allows users to trace their programs not pre-defined
algorithms. This allows them to gain more understanding of their bugs. In addition, various aspects of the
visualization are controlled by the user.
1 INTRODUCTION
Program visualization tools have evolved from static
textual explanations to dynamic, interactive environ-
ments that facilitate deeper engagement with code.
Traditional learning resources often struggle to con-
vey the complexity of algorithm execution and logic
flow in an intuitive way. While existing solu-
tions—such as browser-based code editors, debug-
gers, and educational visualizers—offer incremental
improvements, they frequently rely on direct code ex-
ecution and lack a structural representation of pro-
grams that can enhance learning.
This paper presents a novel, AST-driven web-
based visualization tool aimed at bridging these gaps.
Its core contribution lies in leveraging Abstract Syn-
tax Trees to provide a structured, language-aware
model of JavaScript code. By doing so, learners can
explore code execution step-by-step, visualize algo-
rithm states, and manipulate representations without
the security and flexibility limitations of direct code
evaluation.
Unlike standard browsers or existing educational
platforms that show primarily static snapshots or ba-
sic line-by-line execution, the AST-based design of
our tool allows for a more informed and granular
representation of the program. We integrate inter-
active features like dynamic highlighting of current
execution steps, visual transformations of arrays dur-
ing sorting, and explicit representation of conditionals
and loops.
We position this tool as an educational supplement
for beginners and a conceptual aid for more experi-
enced learners. The method is initially applied to fun-
damental algorithms, such as sorting, but the under-
lying architecture is designed for broader scalability.
Through careful evaluation using System Usability
Scale (SUS) survey (Lewis, 2018) and controlled user
tasks, we demonstrate its positive impact on compre-
hension and engagement. The following sections de-
tail the background, implementation, evaluation re-
sults, and future directions of this approach.
This paper introduces CodeMotion, a powerful
tool that significantly enhances the way developers in-
teract with their code by enabling them to trace and
understand their own scripts, not just predefined al-
gorithms. This capability is particularly crucial for
debugging, allowing developers to delve deeply into
their specific implementations to effectively identify
and resolve issues. By tracing their personal pro-
grams, users gain a deeper understanding of the un-
derlying mechanics of their code, which greatly im-
proves their ability to debug and optimize efficiently.
CodeMotion stands out due to its high degree of
customizability, empowering users to tailor the visu-
alization experience to meet their individual needs.
Moussa, M. and Sharaf, N.
Visual Intelligence for Program Animation.
DOI: 10.5220/0013432000003932
In Proceedings of the 17th International Conference on Computer Supported Education (CSEDU 2025) - Volume 1, pages 565-572
ISBN: 978-989-758-746-7; ISSN: 2184-5026
Copyright © 2025 by Paper published under CC license (CC BY-NC-ND 4.0)
565

This flexibility allows for adjustments in how visual-
izations represent code execution, such as controlling
how variables are displayed during the process to pro-
vide clear insights into how values evolve. Addition-
ally, CodeMotion’s ability to visualize complex data
structures like arrays offers a comprehensive view of
data manipulation and flow, enhancing the traditional
debugging environment. By creating an interactive
and adjustable visualization environment, CodeMo-
tion serves as an indispensable resource for program-
mers at all levels, aiming to enhance their coding pro-
ficiency and problem-solving capabilities.
2 RELATED WORK
Visualization is recognized as a powerful way of pre-
senting complex concepts (Repenning and Sumner,
1995). Various definitions of Algorithm Visualization
(AV) have been proposed, describing it as the visual
depiction of an algorithm’s execution using discrete
or continuous graphical images that are controlled by
the user (Naps et al., 2000; Keller and Keller, 1993;
Fortner, 1995; Saraiya et al., 2004). AV is often
viewed as mapping sequences of digital operations to
graphical renderings (Naps et al., 2000) and as pro-
ducing animated abstractions of an algorithm’s states
(Kerren and Stasko, 2002).
According to (Naps et al., 2000), the purposes of
Algorithm Visualization (AV) are to help users under-
stand the algorithm’s technique, comprehend why it
works, prove its correctness, analyze the program’s
efficiency, and support the algorithm’s implementa-
tion.
However, (de Marneffe, 1998) observed that vi-
sualizations contribute little towards proving the cor-
rectness of the algorithm, analyzing the efficiency of
the program, and supporting the implementation of
the algorithm are key objectives.
Empirical studies indicate that combining anima-
tions with textual explanations enhances learning out-
comes. For instance, (Stasko et al., 1993) reported
that learners exposed to both forms performed bet-
ter than those who relied on text alone, and (Saltan,
2017) found higher achievement scores when an AV
tool was used compared to traditional methods. Fur-
thermore, (Hundhausen et al., 2002) discussed AV ap-
plications in lecture slides, laboratories, in-class dis-
cussions, and debugging scenarios.
Recent advances in data and information visu-
alization have enriched computer science education
by effectively bridging theory and practice (Roshdy
et al., 2018; Fırat and Laramee, 2018; Mulvey, 2015).
Innovations such as source-to-source transformation
for Constraint Handling Rules visualization and rule-
based systems for Java code annotation have further
enhanced the educational experience in specific do-
mains (Abdennadher and Sharaf, 2012a; Sharaf et al.,
2014a; Abdennadher and Sharaf, 2012b; Sharaf et al.,
2014b). Nonetheless, challenges remain in develop-
ing comprehensive tools that accommodate diverse
programming techniques and personalized learning
experiences (Rajala et al., 2008; Cornelissen et al.,
2010).
In contrast, CodeMotion gives users greater con-
trol by enabling them to trace and understand their
own code rather than relying on pre-defined algo-
rithms. This approach, which includes extensive cus-
tomization and dynamic variable tracking, not only
aids debugging but also deepens users’ comprehen-
sion of underlying code mechanics.
3 CodeMotion
This section outlines the conceptual foundation, ar-
chitectural design, and technical implementation of
CodeMotion—a web-based program visualization
tool that leverages Abstract Syntax Trees (ASTs) to
offer an interactive, learner-centered understanding of
programming concepts. By integrating AST-based
analysis with modern web technologies and a flexi-
ble visualization framework, CodeMotion addresses
common limitations in program visualization, includ-
ing security risks, limited structural insight, and nar-
row applicability.
3.1 Conceptual Approach
Traditional educational programming tools often
rely on direct code execution, instrumentation, or
language-specific configurations. Such approaches
can limit adaptability, introduce security concerns,
and provide only superficial insights into program
behavior. In contrast, our methodology is built
on the principle that analyzing code as structured
data—rather than executing it directly—can yield a
more nuanced and comprehensive understanding of
code logic.
By parsing user-submitted JavaScript code into an
AST, CodeMotion derives a detailed, language-aware
representation of the program’s syntax and logic. This
structural analysis enables thorough examination of
control flows, data manipulations, and algorithmic
steps while mitigating the security risks associated
with executing arbitrary code. Importantly, CodeMo-
tion is designed to be algorithm-agnostic: it does not
confine users to a set of pre-defined algorithms. In-
CSEDU 2025 - 17th International Conference on Computer Supported Education
566

stead, users are free to input and develop their own al-
gorithms, empowering them to trace and debug their
unique implementations.
Furthermore, although CodeMotion does not ex-
ecute code directly, it simulates code execution in a
manner akin to a compiler. Each line of code is pro-
cessed sequentially, with the effects of its execution
visualized in real time. The tool highlights the cur-
rently simulated line—mimicking the behavior of a
running compiler—to provide users with a clear, step-
by-step illustration of how their code operates.
In essence, the conceptual approach of CodeMo-
tion transforms raw code into a rich, interactive visu-
alization. By making the internal workings of code
transparent and accessible, the system lays a robust
foundation for scalable, extensible, and user-driven
programming education.
4 SYSTEM DESIGN AND
IMPLEMENTATION
CodeMotion is a modern web-based visualization tool
leveraging React and D3.js to create an interactive
environment for understanding JavaScript algorithms.
The design focused on four key objectives:
1. Security and Code Simulation: CodeMotion uses
the Acorn parser to convert JavaScript code into
Abstract Syntax Trees (ASTs), forming the basis
for a secure simulation of code execution. This
approach eliminates the risks of executing arbi-
trary code, provides fine-grained control over sim-
ulation, enables step-by-step visualization of state
changes, and mimics a compiler by processing
each line sequentially while highlighting the cur-
rent execution step.
2. Real-Time Visualization: Integrating D3.js with
React, the system renders variables and arrays
as interactive visual elements. It offers smooth
animated transitions driven by state changes, a
dynamic canvas that adapts to evolving states,
and a control panel for customizing visual aes-
thetics (e.g., choosing among circles, squares, or
hexagons for variables, and selecting between bar
charts and card styles for arrays).
3. State Management and Component Architecture:
Utilizing React’s state management capabilities,
CodeMotion tracks variable values and execution
state while ensuring consistent data flow between
components. This approach:
• Supports responsive user interface updates,
• Facilitates immediate visual feedback without
server roundtrips, and
• Enables offline functionality since code pro-
cessing occurs entirely on the client side.
4. Extensibility and Customization: The modular ar-
chitecture is designed to accommodate future en-
hancements and user-driven algorithm develop-
ment. The system supports:
• Various visualization formats for arrays and
variables,
• Customizable text sizes and visual properties,
• The easy integration of additional visualization
features and new algorithm types, and
• Expansion to support more complex language
constructs beyond basic JavaScript operations.
The system architecture separates concerns into
distinct components:
• Code Editor: Provides the interface for code in-
put.
• Parser Module: Converts JavaScript code into an
AST using Acorn.
• Execution Engine: Simulates code execution via
AST traversal, processing each node and updating
the simulation state.
• State Manager: Tracks variable values and pro-
gram execution state using React hooks.
• Visualization Canvas: Renders real-time visual
representations of the program state through
D3.js.
• Control Panel: Allows users to customize visual-
ization properties such as variable shapes, array
formats, and text sizes.
This modular design not only ensures maintain-
ability and responsiveness but also provides a solid
foundation for future enhancements. By leverag-
ing modern web technologies, CodeMotion provides
immediate feedback, supports offline operation, and
secures the simulation process by never executing
user code directly. The system supports fundamental
JavaScript constructs including:
• Variable declarations and assignments,
• Array operations and manipulations,
• Basic control flow statements (if/else, switch
cases, loops), and
• Console output simulation.
Overall, this implementation focuses on provid-
ing clear, real-time visual feedback for algorithm exe-
cution, making it particularly suitable for educational
purposes and in-depth algorithm understanding. The
design also facilitates free algorithm development by
enabling users to trace and debug their own code, thus
enhancing both learning and debugging experiences.
Visual Intelligence for Program Animation
567
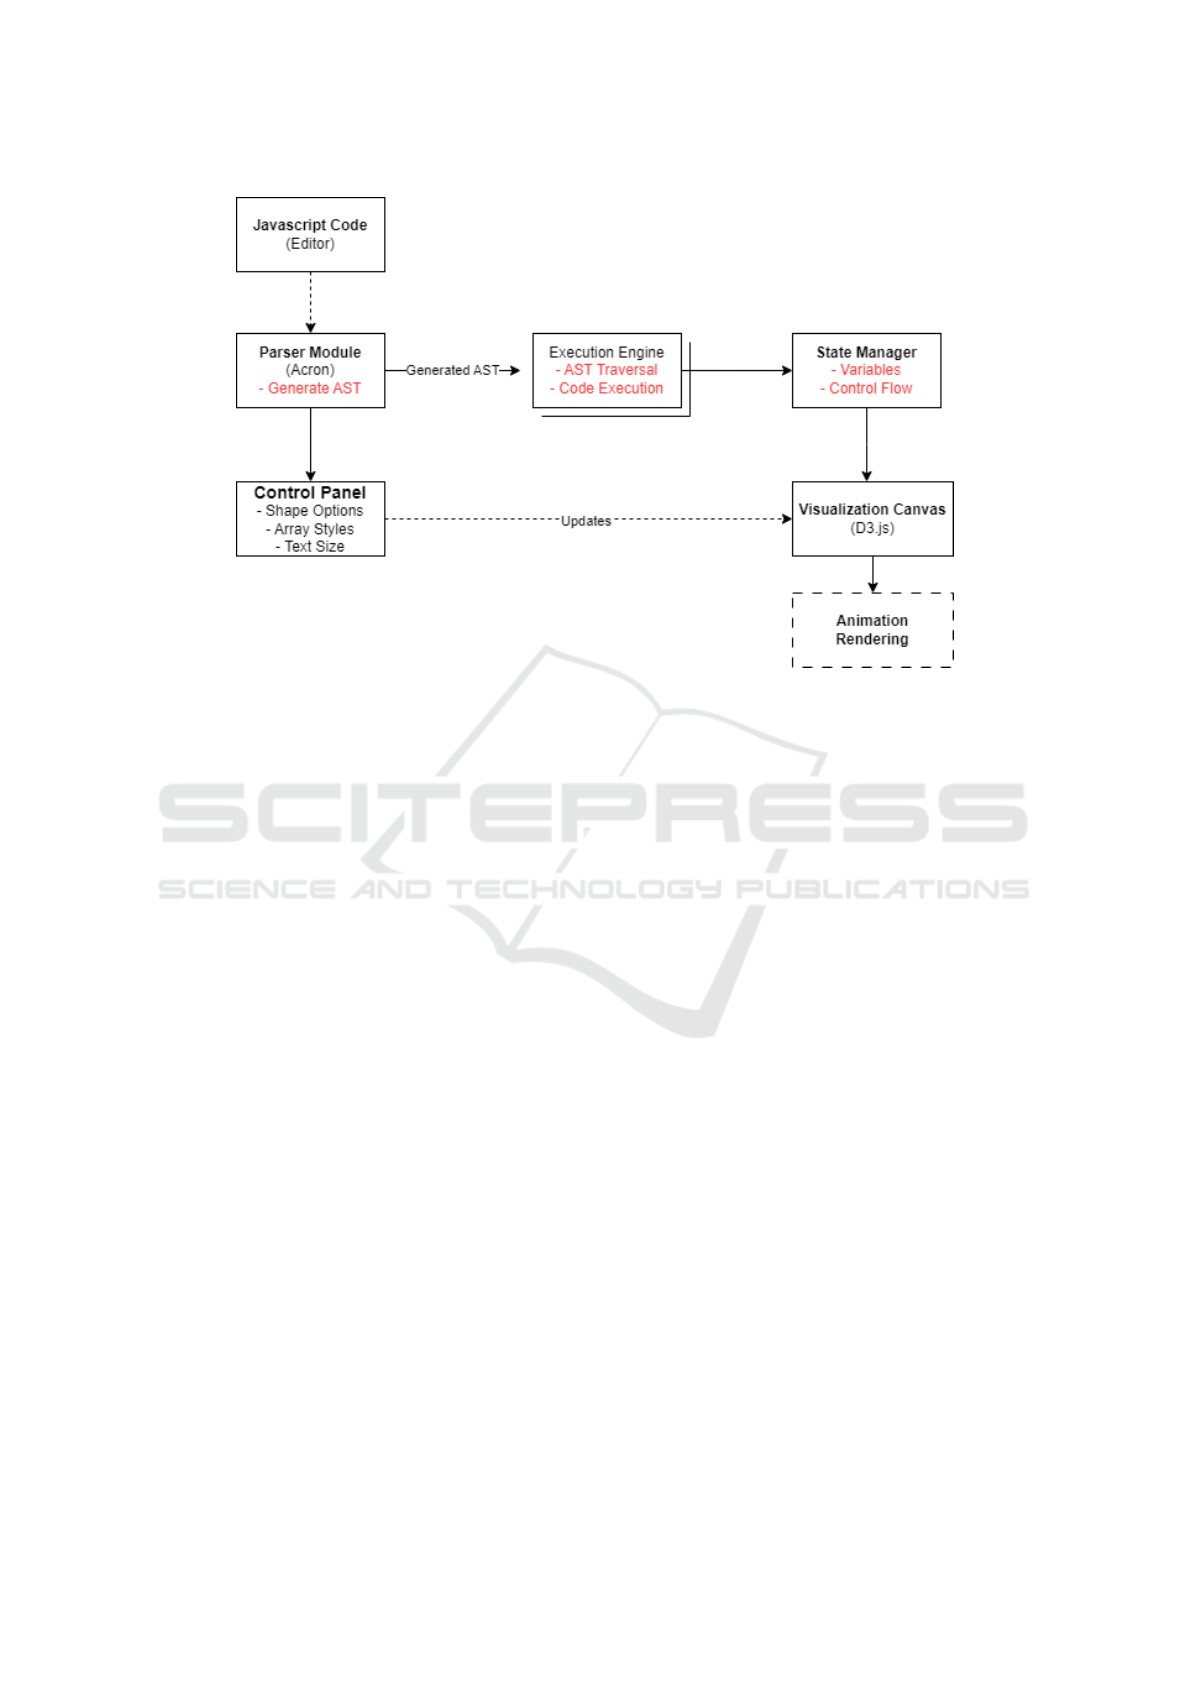
Figure 1: High-level architecture of CodeMotion.
4.1 Client-Side Visualization and
Interactivity
CodeMotion is built with D3.js and React. It trans-
forms program states into interactive, animated dis-
plays, providing real-time feedback during code sim-
ulation. Users can see changes in variables, arrays,
and control flows, and customize visual properties via
an intuitive control panel to suit their preferences.
4.1.1 Variable and Array Visualization
CodeMotion represents program state using distinct
visual elements:
• Scalar Variables: Scalar variables are displayed
as geometric shapes (e.g., circles, squares, or
hexagons) with dynamic labels that update to re-
flect current values. This visualization is de-
signed to help users understand variable states and
changes in real time. Figure 3 illustrates the con-
trol panel used for customizing their appearance.
• Arrays: Arrays are visualized as sequences of
connected elements, which can be styled in var-
ious formats such as bar charts or card layouts.
This flexible representation helps in understand-
ing array structure and the effects of operations.
Figures 4 and 5 demonstrate two different visual-
ization styles for arrays.
The following code listing demonstrates how
D3.js updates scalar variable displays using smooth
transitions:
1 // Upd ate sc ala r v ar iab le s : set
po sit io n and u p da t e d is pl a ye d
val ues
2 const sc ala r = me rge d . fil ter (( d ) = >
!d . is Arr ay );
3 s cal ar . s e lec t ( ’ . shape - c on ta i ne r ’)
4 . t ra ns it i on ( t )
5 . at t r ( ’ t ra nsf or m ’ , ( d) = >
tr ans la te (${d . x} , ${ d. y }) )
6 . s t yle ( ’ fil l ’ , (d ) = > d . n ame ===
up da ted Va r ? ’# ff 6 666 ’ : ’ #
ccc ccc ’ );
7 s cal ar . s e lec t ( ’ t e xt ’)
8 . t ra ns it i on ( t )
9 . s t yle ( ’ font - s ize ’ , g et Fon tS iz e ()
)
10 . t w een ( ’ tex t ’ , function(d ) {
11 const t ex tEl em = d3 . se l ect (
this) ;
12 return () = > {
13 const v alS tr = d . v alu e
=== u nd e fi ne d ? ’
un def in ed ’ : d . va lue ;
14 te xtE le m . t ext ( ‘${ d. name }
= ${ v alS tr } ‘) ;
15 };
16 }) ;
Listing 1: D3.js code snippet for updating scalar variable
visualization.
The following listing shows how array visualiza-
tion is implemented, with element widths adjusted
based on the array length:
1 // Upd ate ar ray vi su al iz at io n :
adj ust el em ent wi d th b ased on
CSEDU 2025 - 17th International Conference on Computer Supported Education
568
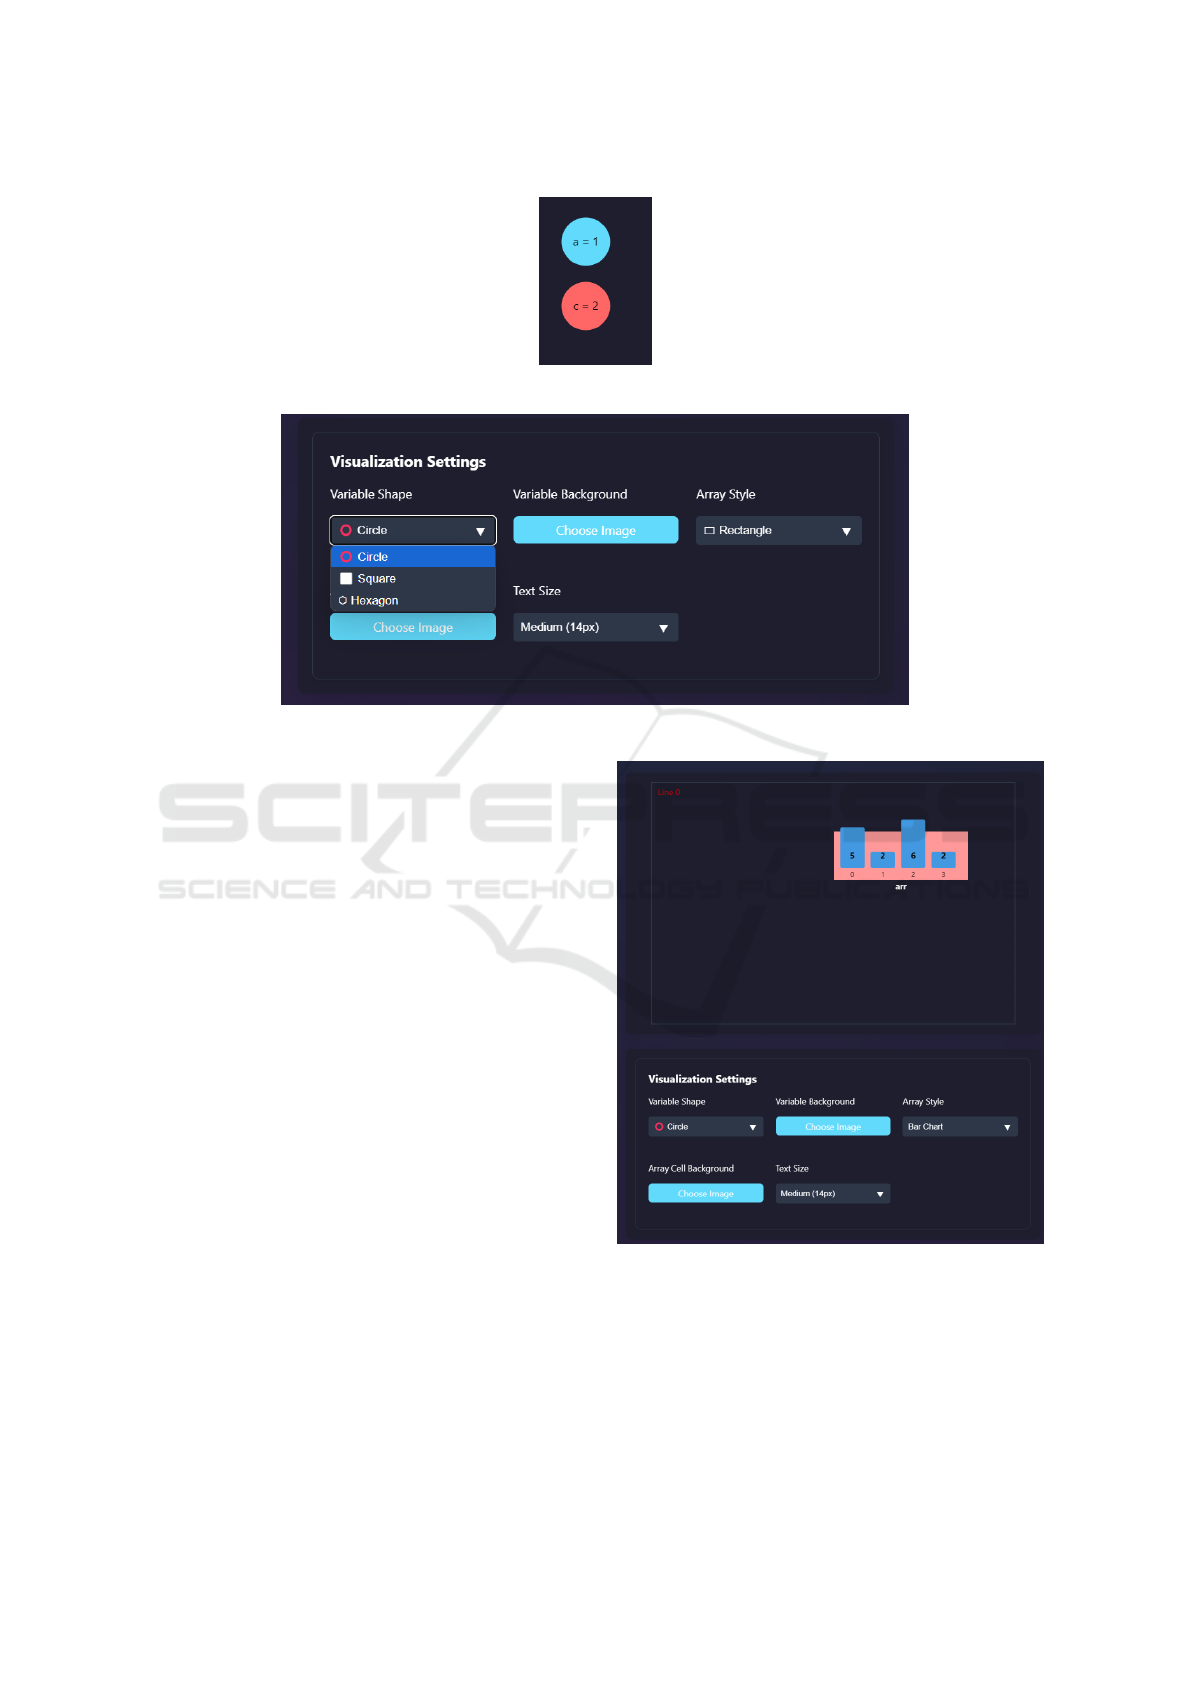
Figure 2: Example of scalar variable visualization using circles.
Figure 3: Control panel interface for customizing scalar variable visualizations.
arr ay l eng th
2 const ar ray s = me rge d . fil ter (( d ) = >
d. i sAr ray ) ;
3 a rra ys . s e lec t ( ’ re ct . array - bkg ’)
4 . t ra ns it i on ( t )
5 . at t r ( ’ wi dth ’ , ( d ) => {
6 const arr = d . val ue || [] ;
7 return arr . l e ngt h * 50 + 20;
8 })
9 . s t yle ( ’ fil l ’ , (d ) = > d . n ame ===
up da ted Va r ? ’# ff 9 999 ’ : ’ #
ccc ccc ’ );
Listing 2: D3.js code for array visualization.
4.1.2 Real-Time Array Operations and
Animations
Array modifications are animated to illustrate dy-
namic changes clearly. For example, when an ele-
ment moves during a sorting operation, the system
creates a cloning effect that emphasizes the transition.
This animation provides enhanced clarity during state
changes.
4.1.3 Algorithm-Agnostic Simulation and
Real-Time Execution Tracing
CodeMotion is designed to be algorithm-agnostic. Its
modular architecture allows it to simulate and visual-
ize a wide variety of algorithms without hardcoding
logic for each one. The system interprets algorithm
Figure 4: Array visualization using a bar chart style for
[5,2,6,2].
steps through state updates that are directly mapped
to visual transitions.
CodeMotion simulates code execution similarly
to a compiler, processing each line sequentially and
highlighting the current line in real time. This syn-
chronized highlighting, along with dynamic updates
Visual Intelligence for Program Animation
569
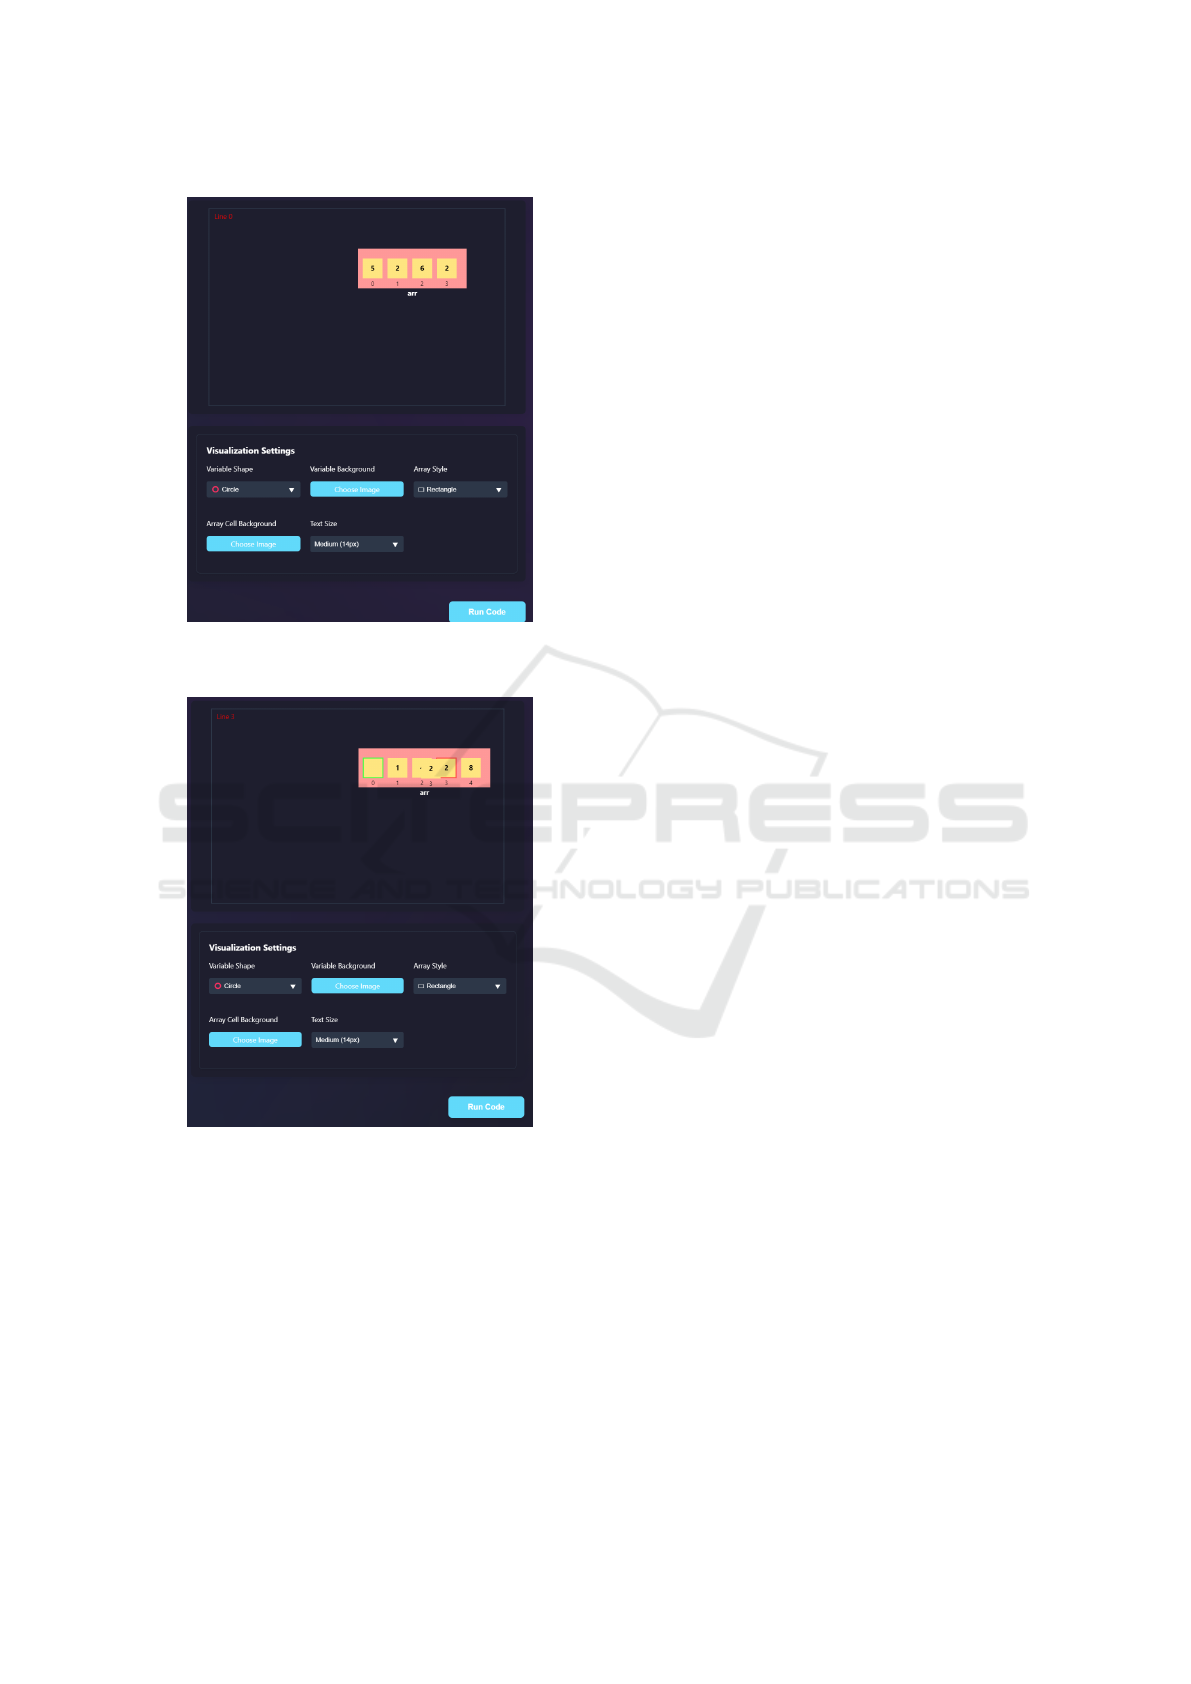
Figure 5: Array visualization using card styling for
[5,2,6,2].
Figure 6: Animation during element transition showing a
cloning effect for arr[0]=arr[3].
to the program state, enables users to trace algorithm
execution and monitor changes in variables, arrays,
and control flow. Figure 7 illustrates a sorting algo-
rithm simulation showing element swaps and compar-
isons.
Dynamic State Management. The integration of
D3.js with React ensures that any change in the pro-
gram state is immediately reflected in the visualiza-
tion. This real-time synchronization guarantees that
users receive continuous, interactive feedback as the
algorithm progresses.
4.1.4 Animation and Transitions
To enhance user engagement, CodeMotion imple-
ments smooth transition effects for all state changes.
These include:
• Variable Updates: Fade and transform animations
when variable values change.
• Array Modifications: Sliding and reordering ani-
mations for array elements.
• Shape Changes: Smooth morphing effects when
variable representations change shape.
• Color Transitions: Gradual color shifts to empha-
size updates.
These effects provide immediate visual feedback
and contribute to an intuitive understanding of the un-
derlying code behavior. Overall, the combination of
D3.js’s visualization capabilities with React’s respon-
sive component model creates an engaging environ-
ment for exploring and tracing algorithm execution.
5 EMPIRICAL TESTING
This section presents the evaluation of CodeMotion’s
usability and educational impact using both quantita-
tive and qualitative measures.
5.1 Evaluation Procedure and
Participants
A group of 29 computer science students from The
German International University (GIU) participated
in the evaluation. The sample included both freshmen
undergraduates and senior graduate students, ensur-
ing a diverse range of programming experience and
algorithmic knowledge. Prior to testing, participants
were briefed on CodeMotion’s purpose and operation.
They then explored two scenarios—a sorting algo-
rithm and a conditional logic case—to interact with
the interface and assess the clarity of the visualiza-
tions.
5.2 Usability Assessment with SUS
The System Usability Scale (SUS) questionnaire was
administered after the tasks. The SUS is a widely
recognized instrument that yields an overall usability
score on a 100-point scale.
CSEDU 2025 - 17th International Conference on Computer Supported Education
570
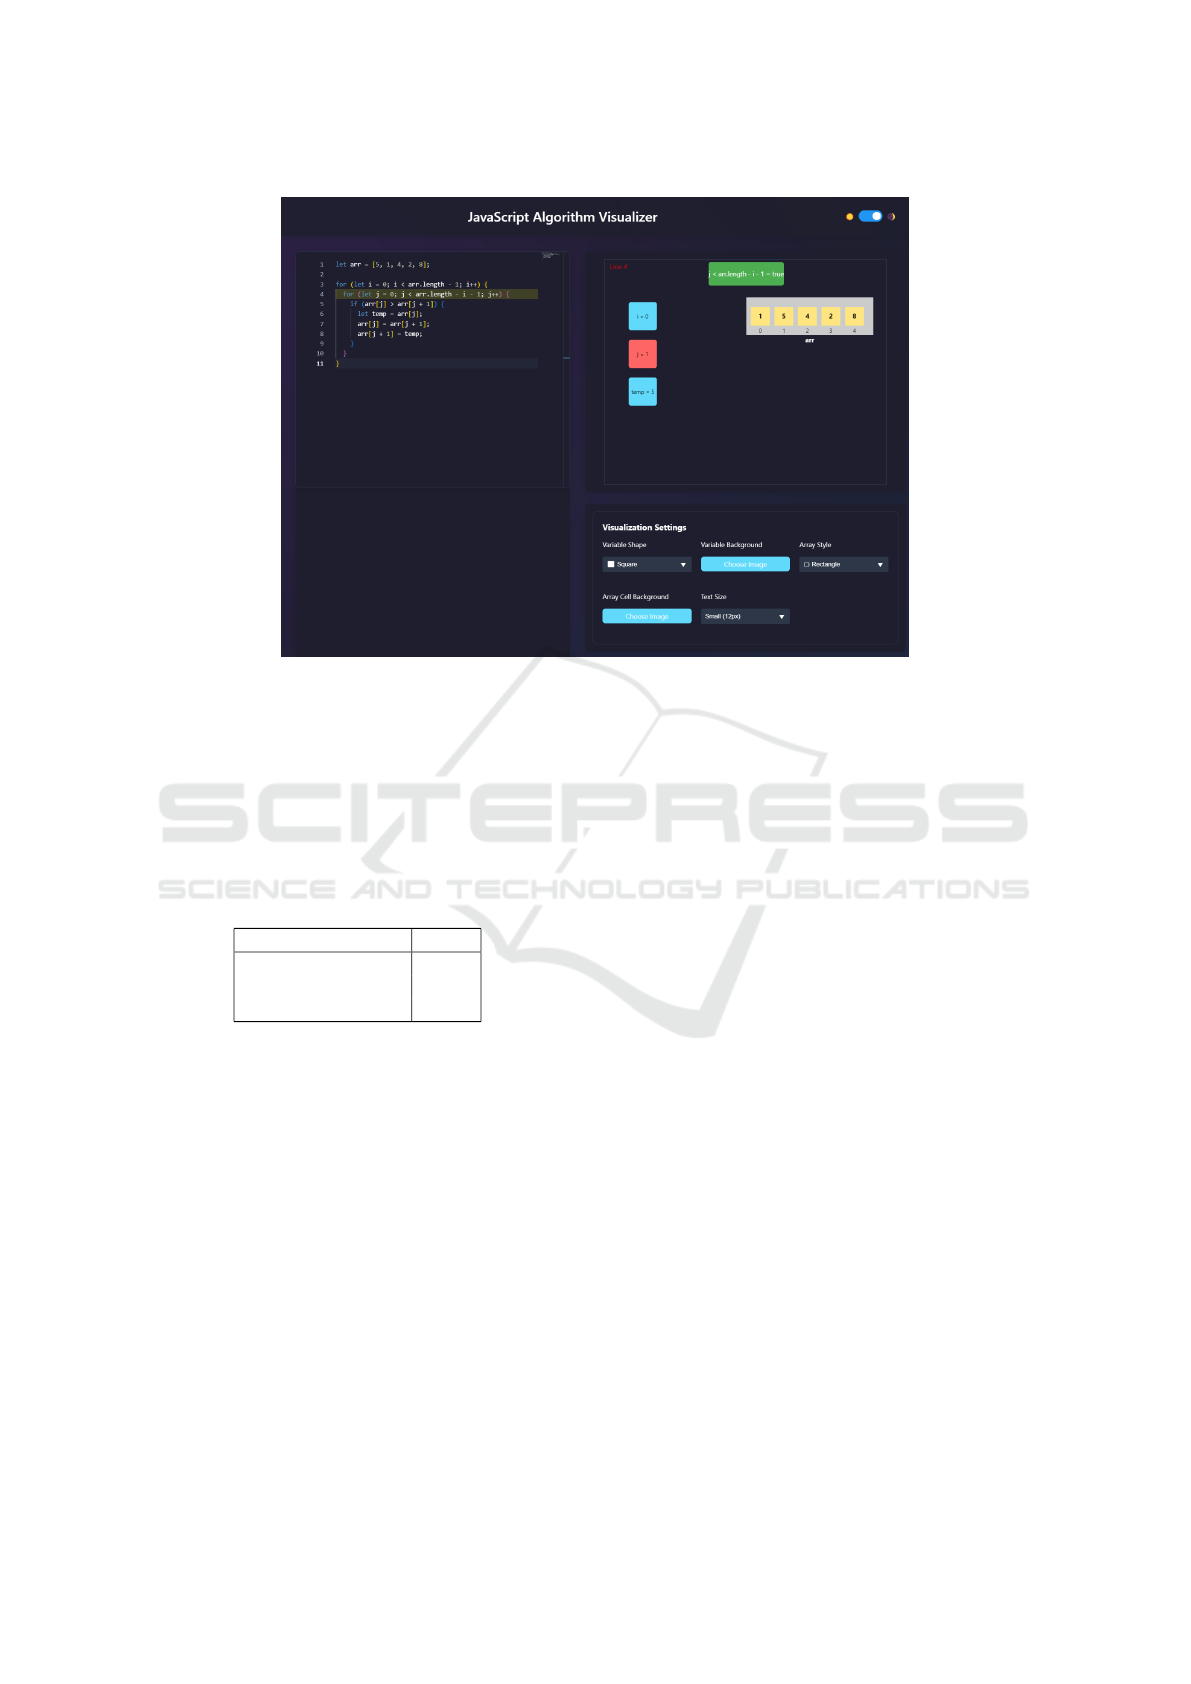
Figure 7: Sorting algorithm simulation with visualized swaps and comparisons.
5.3 SUS Results and Analysis
The SUS analysis yielded a mean score of 76.98, a
median of 80, and a standard deviation of 15.35, in-
dicating that CodeMotion is generally well-received
and considered to have “good” usability.
Table 1: Summary of SUS Scores.
Statistic Value
Mean 76.98
Median 80
Standard Deviation 15.35
5.4 Insights and Qualitative Feedback
Participants found CodeMotion easy to learn. On av-
erage, they werr able to become comfortable with its
features within 10-15 minutes. Users expressed how
the system could encourage experimentation with var-
ious algorithms. Users also highlighted that the in-
teractive visuals explained the complex algorithmic
processes. One user noted, ”The interactive visu-
als helped me understand the logic behind sorting.
I could clearly see each comparison and swap.” An-
other added, ”It felt like I was ‘watching’ the algo-
rithm think, which made it easier to understand why
certain steps happened.”
6 CONCLUSION AND FUTURE
WORK
CodeMotion allows users to trace and debug their pro-
grams interactively, providing a dynamic alternative
to static pre-defined algorithms. Its real-time simula-
tion highlights active code, mimicking compiler be-
havior and enhancing understanding through clear vi-
sual feedback. Tested with 29 computer science stu-
dents at The German International University, Code-
Motion was found to be intuitive and engaging, scor-
ing a mean SUS of 76.98. It effectively clarifies algo-
rithmic concepts and allows for customization. How-
ever, improvements are needed in scalability, device
compatibility, and adaptive guidance to accommodate
users of varying expertise levels.
Future updates to CodeMotion should focus on
supporting diverse data structures. Real-time code
editing and debugging should be also added to en-
hance interactivity. Adaptive difficulty levels and per-
sonalized guidance for users are also being consid-
ered.
REFERENCES
Abdennadher, S. and Sharaf, N. (2012a). Visualization
of chr through source-to-source transformation. In
Technical Communications of the 28th International
Conference on Logic Programming (ICLP’12)(2012).
Schloss-Dagstuhl-Leibniz Zentrum f
¨
ur Informatik.
Visual Intelligence for Program Animation
571

Abdennadher, S. and Sharaf, N. (2012b). Visualization of
CHR through Source-to-Source Transformation. In
Dovier, A. and Costa, V. S., editors, ICLP (Technical
Communications), volume 17 of LIPIcs, pages 109–
118. Schloss Dagstuhl - Leibniz-Zentrum fuer Infor-
matik.
Cornelissen, B., Zaidman, A., and van Deursen, A. (2010).
A controlled experiment for program comprehension
through trace visualization. IEEE Transactions on
Software Engineering, 37(3):341–355.
de Marneffe, P. (1998). The problem of examination ques-
tions in algorithmics. In Davies, G. and
´
OHigeartaigh,
M., editors, Proceedings of the 6th Annual Conference
on the Teaching of Computing and the 3rd Annual
SIGCSE Conference on Innovation and Technology in
Computer Science Education, ITiCSE 1998, Dublin
City Univ., Ireland, 18-21 August 1998, pages 74–76.
ACM.
Fırat, E. E. and Laramee, R. S. (2018). Towards a survey
of interactive visualization for education. Computer
Graphics and Visual Computing, CGVC 2018, pages
91–101.
Fortner, B. (1995). The data handbook - a guide to under-
standing the organization and visualization of techni-
cal data (2. ed.). Springer.
Hundhausen, C., Douglas, S., and Stasko, J. (2002).
A Meta-Study of Algorithm Visualization Effective-
ness. Journal of Visual Languages & Computing,
13(3):259–290.
Keller, P. R. and Keller, M. M. (1993). Visual cues - practi-
cal data visualization. IEEE.
Kerren, A. and Stasko, J. (2002). Chapter 1 Algorithm An-
imation. In Diehl, S., editor, Software Visualization,
volume 2269 of Lecture Notes in Computer Science,
pages 1–15. Springer Berlin / Heidelberg.
Lewis, J. R. (2018). The system usability scale: past,
present, and future. International Journal of Human–
Computer Interaction, 34(7):577–590.
Mulvey, M. (2015). Effects of visualization on algorithm
comprehension. Master’s thesis, The University of
Wisconsin-Milwaukee.
Naps, T. L., Eagan, J., and Norton, L. L. (2000). Jhav
´
e - an
environment to actively engage students in web-based
algorithm visualizations. In Cassel, L. B., Dale, N. B.,
Walker, H. M., and Haller, S. M., editors, Proceedings
of the 31st SIGCSE Technical Symposium on Com-
puter Science Education, 2000, Austin, Texas, USA,
March 7-12, 2000, pages 109–113. ACM.
Rajala, T., Laakso, M.-J., Kaila, E., and Salakoski, T.
(2008). Effectiveness of program visualization: A
case study with the ville tool. Journal of Information
Technology Education. Innovations in Practice, 7:15.
Repenning, A. and Sumner, T. (1995). Agentsheets:
A medium for creating domain-oriented languages.
IEEE Computer, 28(3):17–25.
Roshdy, A., Sharaf, N., Saad, M., and Abdennadher, S.
(2018). Generic data visualization platform. In
Banissi, E., Francese, R., Bannatyne, M. W. M.,
Wyeld, T. G., Sarfraz, M., Pires, J. M., Ursyn,
A., Bouali, F., Datia, N., Venturini, G., Polese, G.,
Deufemia, V., Mascio, T. D., Temperini, M., Sciar-
rone, F., Malandrino, D., Zaccagnino, R., D
´
ıaz, P.,
Papadopoulo, F., Anta, A. F., Cuzzocrea, A., Risi,
M., Erra, U., and Rossano, V., editors, 22nd Interna-
tional Conference Information Visualisation, IV 2018,
Fisciano, Italy, July 10-13, 2018, pages 56–57. IEEE
Computer Society.
Saltan, F. (2017). The impact of online algorithm visual-
ization on ict students’ achievements in introduction
to programming course. Journal of Education and
Learning, 6(1):184–192.
Saraiya, P., Shaffer, C. A., McCrickard, D. S., and North, C.
(2004). Effective features of algorithm visualizations.
In Joyce, D. T., Knox, D., Dann, W., and Naps, T. L.,
editors, Proceedings of the 35th SIGCSE Technical
Symposium on Computer Science Education, SIGCSE
2004, Norfolk, Virginia, USA, March 3-7, 2004, pages
382–386. ACM.
Sharaf, N., Abdennadher, S., and Fr
¨
uhwirth, T. (2014a).
Chranimation: An animation tool for constraint han-
dling rules. In International Symposium on Logic-
Based Program Synthesis and Transformation, pages
92–110. Springer.
Sharaf, N., Abdennadher, S., and Fr
¨
uhwirth, T. (2014b). Vi-
sualization of constraint handling rules. arXiv preprint
arXiv:1405.3793.
Stasko, J. T., Badre, A. N., and Lewis, C. (1993). Do algo-
rithm animations assist learning?: an empirical study
and analysis. In Arnold, B., van der Veer, G. C., and
White, T. N., editors, Human-Computer Interaction,
INTERACT ’93, IFIP TC13 International Conference
on Human-Computer Interaction, 24-29 April 1993,
Amsterdam, The Netherlands, jointly organised with
ACM Conference on Human Aspects in Computing
Systems CHI’93, pages 61–66. ACM.
CSEDU 2025 - 17th International Conference on Computer Supported Education
572
