
Modeling and Simulating of Combat: An Empirical Application
Konstantina Founta
Department of Economics, University of Thessaly, Volos, Greece
Keywords: Combat Modeling, Combat Simulation, Decision-Making, Decision Support, Optimization,
Strategic Behavior.
Abstract: This paper proposes a combat model to predict the expected optimal strategic behavior of two participants
engaged in battle, focusing on their interactions throughout the conflict. The model enables the construction
of detailed scenarios, predictions, and analyses of battle outcomes, including potential shifts in the balance of
power. To demonstrate the applicability and effectiveness of the model, three case studies are studied: a naval
battle (Case 1), an island seizure battle (Case 2), and a ground battle (Case 3). This work aims to enhance
strategic planning and provide actionable insights for decision-makers and strategic analysis, guiding their
future decisions.
1 INTRODUCTION
Combat modeling and simulation have become
integral tools for military planning, training, and
decision-making. They leverage advanced
methodologies to simulate complex scenarios, predict
outcomes, and optimize strategies. A wide range of
historical battles can be analyzed with these
methodologies. Analysts use simulations to
investigate system operation, identify critical factors,
and try to isolate time periods in development where
the process could have changed direction (Washburn
& Kress, 2009).
The applications of combat simulation models
emphasize enhanced efficiency, quality, reduce
complexity and cost in model development, while
enabling agile construction of simulation
applications. These models include simulating
human, social, cultural, and behavioral interactions
within complex environments, supporting military
training, operational planning, and decision-making
processes. The models also address core processes
such as movement, communication, and engagement,
providing deeper insights into complex combat
scenarios (Tolk, 2012). The true value of modeling
and simulation lies in their ability to simplify
complex decision-making processes, illustrating how
key operational parameters impact implementation
and final results.
Many researchers use or extend Lanchester’s
equations to represent combat dynamics and
interactions between opposing forces (Taylor (1974),
Protopopescu et al. (1989), Keane (2011), Kress et al.
(2018), Zhang, (2023), Cangiotti et al. (2023)). These
works have significantly shaped the theoretical and
practical understanding of warfare modeling, and
their influence remains evident in modern combat
simulations. In contrast, some researchers advocate
the discrete form of Lanchester’s combat models. Fox
(2010) underscores the difference between
continuous and discrete models in representing
combat interactions. Discrete models offer a more
granular analysis of combat scenarios compared to
the fluid, continuous nature of traditional models.
Furthermore, discrete models reflect situations where
one player’s decisions directly influence the actions
of others, treating decision-making as a game with
multiple equilibria. This approach allows for the
identification of marginal effects arising from both
individual and collective decisions.
Moreover, several studies explore key aspects of
combat through diverse analytical approaches. Peng,
Zhai, and Levitin (2016) examine a strategic game
between an attacker and a defender, incorporating the
use of false targets to deceive the adversary.
Similarly, Zhai et al. (2017) address infrastructure
protection in a two-player zero-sum game context,
offering valuable insights into defensive strategies.
Other research focuses on critical factors
influencing combat outcomes. Jiang et al. (2020)
introduce the Whale Army Optimization Algorithm
(WAOA), an advanced iteration of the Whale
166
Founta and K.
Modeling and Simulating of Combat: An Empirical Application.
DOI: 10.5220/0013430600003970
In Proceedings of the 15th Inter national Conference on Simulation and Modeling Methodologies, Technologies and Applications (SIMULTECH 2025), pages 166-174
ISBN: 978-989-758-759-7; ISSN: 2184-2841
Copyright © 2025 by Paper published under CC license (CC BY-NC-ND 4.0)

Optimization Algorithm (WOA) developed by
Mirjalili and Lewis (2016). This method leverages
strategic adjustments to solve optimization problems
effectively and proposes an armed force program
based on collective and coordinated battlefield
strategies.
The studies discussed above primarily concentrate
on the factors that influence combat outcomes, while
the evaluation of those outcomes remains a
challenging research problem for analysts. Lee et al.
(2021) emphasize that the battlefield itself should be
considered a critical factor in modeling, as it can
significantly alter the outcome of a battle. They
propose combat winner predictor models that
leverage both battlefield and troop data, alongside a
framework designed to optimize military resources
under constraints.
In addition, the NATO Net-enabled Capability
Command and Control Maturity Model (N2C2M2),
as described by Alberts, Huber, and Moffat (2010),
has been pivotal in shaping discussions on command-
and-control maturity in combat scenarios. The latest
research by Koehler, et al. (2024) explores the
application of complex adaptive systems to combat
simulations of the generation-after-next. Their study
underscores the growing need for dynamic and
adaptive strategies in military decision-making,
further advancing the field of combat modeling and
simulation.
Despite the advancements around combat
modeling and simulation, challenges persist in
formulating optimal strategies and refining the
approaches used to develop them.
In comparison to existing studies, our work aims
to provide a structured mathematical framework that
integrates strategic decision-making within a
dynamical system. Unlike traditional Lanchester-
based models that often assume deterministic
interactions, our approach introduces a game-
theoretic perspective to represent strategic
adaptability. We provide a novel contribution that
blends classical combat modeling with modern
decision-theoretic approaches.
Our contribution focuses on analyzing the
players’ effective strategic behavior during combat,
exploring how these behaviors inform decision-
making processes. Additionally, we aim to predict
both combat outcomes and potential reversals,
providing deeper insights into the dynamics of
strategic interactions on the battlefield.
Combat models are indispensable for simulating
battles and determining the optimal strategic behavior
between two opposing forces. This paper introduces
a methodology to address a pivotal question: What
strategic behavior should a player (state entity) adopt
when external forces threaten its survival as an
autonomous entity?
The proposed model identifies the most critical
factors influencing battle outcomes and predicts the
optimal strategic behavior for each player engaged in
armed conflict. Additionally, the model facilitates the
prediction of battle outcomes by framing the conflict
as a war game. This is achieved through a comparison
of the dynamical system's solution with the Nash
equilibrium of the “Hawk–Dove” game (Smith, and
Price, 1973).
To demonstrate the model's practical application,
we test three case studies, each representing a
different type of battlefield. Case Study 1 examines
a naval battle, Case Study 2 explores an island
seizure battle, and Case Study 3 investigates a
ground battle. These case studies illustrate the
versatility and effectiveness of the model in diverse
combat scenarios.
2 MODEL PRESENTATION
Over the years, numerous simulations have been
developed using a wide variety of modeling
methodologies. This section presents an extended
version of the model developed by Founta and
Zachilas (2021; 2023), which is validated with
historical battle data, enhancing its credibility for
military decision-making. This model captures the
strategic behavior of two opposing forces through a
dynamical system. It reflects the inherent non-
linearity present in real-world combat scenarios. The
model is applicable to any state entities engaged in
interstate conflicts.
In contrast to traditional Lanchester-based
models, we introduce a game-theoretic perspective to
represent strategic adaptability in combat. The
proposed model not only evaluates combat outcomes
but also predicts strategic reversals, identifying
critical turning points where a weaker player could
potentially gain an advantage. Our approach allows
for a more realistic and flexible analysis of battlefield
interactions, capturing the evolution of strategic
behavior over time.
The core of the model lies in its ability to relate
key combat parameters through a system of
equations. These equations express the dynamic
interactions and evolving relationships between the
two opponents over time, providing a comprehensive
framework for analyzing combat scenarios and
strategic decision-making.
Modeling and Simulating of Combat: An Empirical Application
167

The expected optimal strategic behavior of each
player is expressed as:
⎩
⎪
⎨
⎪
⎧
𝑥
=4∙𝑥
∙
1−𝑥
∙𝑃
+𝑇𝑁
+𝑇𝐴
+𝑇𝐿
+𝑇𝐼
−𝐺∙ 𝐷
+𝐸
∙2∙𝑦
∙
1−𝑦
𝑦
=4∙𝑦
∙
1−𝑦
∙𝑃
+𝑇𝑁
+𝑇𝐴
+𝑇𝐿
+𝑇𝐼
−
1−𝐺
∙𝐷
+𝐸
∙2∙𝑥
∙
1−𝑥
(1)
where:
𝑥
: The strategic behavior of the player x at the time
t.
𝑦
: The strategic behavior of the player y at the time
t.
𝑥
: The expected strategic behavior of the player x
at the time t+1.
𝑦
: The expected strategic behavior of the player y
at the time t+1.
We set 𝑥
,𝑦
,𝑥
,𝑦
[0,1]. The value of the
variables is defined as entirely aggressive strategic
behavior for each player, if the value of 𝑥
(or 𝑦
,
respectively) equals to 1. While we define the entirely
defensive strategic behavior, when the value of 𝑥
(or 𝑦
, respectively) equals to 0.
Table 1: Definitions of the parameters in Eq. (1).
Parameter Definition
𝑃
Military forces (quantity)
T
Technological capability (quality) in:
Army: 𝑇𝐿
Navy: TN
Air Force: TA
Intelli
g
ence: TI
𝐺
The difficulty of Geographical terrain of
the armament conflict / Battlefiel
d
D
Estimated damage that one player brings
to another during the battle
E
Expected military expenditures (from
available financial resources
)
for a battle
In Eq. (1), each parameter has an indicator that shows
the player (x or y) we are referring to. We assume that
the parameters (in Table 1) are defined in the closed
interval [0,1].
Explanation of Values of the Parameters
P: If the value is close to 1, the players have
powerful manpower.
If the value is close to 0, the players have
weak manpower.
T: If the value is close to 1, the players have
high technological capabilities,
If the value is close to 0, the players have
low technological capabilities.
G: If the value is close to 1, the geophysical
terrain of the area is difficult,
If the value is close to 0, the geophysical
terrain of the area is favorable.
(The part G (and 1 – G) provides a
battlefield advantage or disadvantage
affecting the players’ estimated strategic
behavior during a battle.)
D: If the value is close to 1, the player causes
huge damage to its opponent. If the value is
close to 0, the player causes less damage to
its opponent.
E: If the value is close to 1, the players have
huge military expenditures for the
impending battle. If the value is close to 0,
the players have less military expenditure
for the impending battle.
The terms 4∙𝑥
∙
1−𝑥
and 2∙𝑦
∙
1−𝑦
expresses that the next move of a player depends not
only on how its opponent acts but also the player itself
at the time t. The constant in front of each logistic
equation is defined in [0, 4], and we chose a suitable
value to achieve a smooth behavior of the model.
3 METHODOLOGY
In this section, we outline the step-by-step
methodology used to simulate and analyze combat
scenarios. First, we create a battle scenario by setting
initial conditions. These conditions are then used to
parametrize the data and solve the system of
equations (Eq. (1)). Among the various fixed points,
we consider only those within the interval [0,1]. Each
fixed point represents a strategic combination of the
two players.
Based on the ‘‘Hawk-Dove” game (Smith and
Price, 1973), we conceive that each player one can
behave aggressively (Hawk) or defensively (Dove).
Thus, we assume that if the value of the fixed point is
close to 1, the player has aggressive behavior (Hawk),
while if the value is close to 0, then the player has
defensive behavior (Dove).
Next, we perform stability analysis by evaluating
the Jacobian matrix at each fixed point. A fixed point
is stable if all eigenvalues' absolute values are below
1, otherwise it's unstable (Scheinerman, 2012).
To gain deeper insights, we analyze players'
decision-making processes, particularly focusing on
how battle outcomes can be overturned and
identifying strategic mistakes made during the
conflict. Methodologically, we explore alternative
scenarios by varying a single parameter in each
simulation. These variations represent different
potential battle narratives, with each scenario yielding
SIMULTECH 2025 - 15th International Conference on Simulation and Modeling Methodologies, Technologies and Applications
168

distinct results due to the sensitivity of initial
conditions.
Sensitivity is a hallmark of chaotic systems, where
small changes in initial values can lead to significant
differences in system dynamics (Guckenheimer,
1979). This characteristic highlights the inherent
complexity and unpredictability of combat scenarios,
emphasizing the critical need for accurate modeling
and thorough scenario analysis.
4 NUMERICAL RESULTS – 2D
MODEL
We investigate three case studies, describing different
locations (geographical terrain of battlefield) First,
we examine a naval battle (Case 1), where we set that
the players x and y have any advantage from the
geophysical terrain. Secondly, the two opponents
fight to capture an island (Case 2), where we set that
player x has the advantage in this geographical
location. The last scenario (Case 3) concerns a ground
battle, where we set that player y has the advantage in
this geophysical terrain.
Figure 1: Fiction map with the three case studies (Case 1–
Naval battle, Case 2– Island seizure battle and Case 3–
Ground battle).
Mathematically, battlefield is expressed by
parameter G, and we present below the three case
studies:
G = 0.5 (Case 1 – Naval Battle),
G = 0.3 (Case 2 – Island Seizure Battle), and
G = 0.7 (Case 3 – Ground Battle).
We examine the cases separately.
4.1 Case 1: Naval Battle
In case 1, we explore the strategic behavior of the two
opponents, when the battle is taking place in the
middle of the sea (G = 0.5). We assume no
geographical advantage for each player. Regarding
initial values, we determine the military forces of
each player as 𝑃
=0.4, 𝑃
=0.6, respectively.
Concerning the technological military capabilities of
each one, as follows:
player x: 𝑇𝐿
=0, 𝑇𝑁
=0.06, 𝑇𝐴
=0.07 and
𝑇𝐼
=0.06
player y: 𝑇𝐿
=0, 𝑇𝑁
=0.04, 𝑇𝐴
=0.04 and
𝑇𝐼
=0.04
In addition, the estimated damage caused by x to
y is equal to 𝐷
=0.06, and the estimated damage y
brings to x equals 𝐷
=0.03. Furthermore, the
expected military expenses for the impending battle
for each player are set 𝐸
=0.03, 𝐸
=0.08.
Regarding these initial values, we solve Eq. (1),
and the real equilibrium points, which belong to
closed interval [0, 1], are:
𝑓𝑝
∶
𝑥
∗
=0.0126,𝑦
∗
=0.6322
Saddle
point
𝑓𝑝
∶𝒙
∗
=𝟎.𝟓𝟏𝟖𝟔,𝒚
∗
=𝟎.𝟔𝟏𝟐𝟐 Stable
(node)
𝑓𝑝
∶𝑥
∗
=0.5304,𝑦
∗
=0.0201 Saddle
point
𝑓𝑝
∶
𝑥
∗
=0,𝑦
∗
=0
trivial
We analyze the stability of the solutions, and we
present the method for 𝑓𝑝
. The Jacobian matrix is
used for stability analysis. Also, a fixed point is called
stable, as the discriminant (Δ) > 0, if and only if the
determinant of Jacobian matrix (det (J
fp
)) > 0 and the
trace (tr (J
fp
)) < 0 (Robinson, 2012).
We calculate the Jacobian matrix:
𝐽
=
2.131 − 𝑥 − 2.13𝑥 0.06𝑦 − 0.061 −𝑦
0.14𝑥 −0.141 − 𝑥 2.721 − 𝑦 − 2.72𝑦
(2)
and substitute the 𝑓𝑝
in Jacobian matrix, as follows:
𝐽
=
2.0806 0.01586
−0.1364 −0.7209
(3)
We calculate the determinant of matrix 𝐽
, the trace
and the discriminant:
det𝐽
=−1.4977 0 ,
𝑡𝑟𝐽
=1.359 0 ,
𝛥=7.8398 0.
According to the sign of the value, the 𝑓𝑝
is
saddle point (Robinson, 2012). We analyzed the
stability of the other fixed points following the same
analysis process.
Furthermore, interpreting the equilibrium points,
the 𝑓𝑝
is rejected because it is trivial and has no
interest. 𝑓𝑝
, 𝑓𝑝
and 𝑓𝑝
could determine the
strategic behavior of the two opponents, but the 𝑓𝑝
Modeling and Simulating of Combat: An Empirical Application
169

expresses it more realistic than the other two fixed
points. Thus, we focus on 𝑓𝑝
and its interpretation.
In 𝑓𝑝
∶𝑥
∗
=0.5186,𝑦
∗
=0.6122, the values
of 𝑥
∗
is slightly lower than 𝑦
∗
. On the one hand, it
means that the players have similar behavior during
the battle, because there is no significant divergence
between the values. On the other hand, since the value
of 𝑦
∗
is higher than the value of 𝑥
∗
, we suppose that
y wins the battle, and the victory depends on some key
– moves that y would have done. In addition, we
consider this as a war game and based on the idea of
the game “Hawk – Dove”, we could say that player y
has aggressive behavior (Hawk), because the value of
𝑦
∗
is close to 1, and thus wins the battle.
4.2 Case 2: Island Seizure Battle
In this case, we examine the scenario of fighting to
capture an island (G = 0.3). Also, we set the 𝑇𝐿
=
0.05 because player x has a supporting army on the
island for protection. The remaining parameters are
constant. Thus, we solve the Eq. (1) again, and there
are four real solutions:
𝑓𝑝
∶𝑥
∗∗
=0.0063,𝑦
∗∗
=0.6324
Saddle point
𝑓𝑝
∶𝒙
∗∗
=𝟎.𝟓𝟔𝟓𝟏,𝒚
∗∗
=𝟎.𝟔𝟎𝟑𝟗
Stable (node)
𝑓𝑝
∶𝑥
∗∗
=0.5708,𝑦
∗∗
=0.0291
Saddle point
𝑓𝑝
∶𝑥
∗∗
=0,𝑦
∗∗
=0 trivial
We perform stability analysis with the process
shown on the previous section (Section 4.1). The
most realistic solution is 𝑓𝑝
∶𝑥
∗∗
=0.5651,𝑦
∗∗
=
0.6039. Interpreting the 𝑓𝑝
, we observe that the
players have similar behavior with Case 1 (Section
4.1). Specifically, there is a slight difference between
the values of 𝑥
∗∗
and 𝑦
∗∗
, and the value of 𝑦
∗∗
is
higher than the value of 𝑥
∗∗
. It means that y wins this
battle through key – moves, as they adopt a mild
strategic behavior.
4.3 Case 3: Ground Battle
In the last case, we explore a ground battle scenario
(G = 0.7). Modeling this case, we change, also, the
value of parameter 𝑇𝐿
=0.07 and retain the other
values of parameters constant.
Summarizing the profile of the two players:
Player x has higher Navy, Air Force, and Intelligence
capabilities, while y has a great Army and a
geographical advantage.
With these specific initial values, we solve again
the Eq. (1) and the real solutions, that belong to [0,1],
are:
𝑓𝑝
∶
𝑥
∗∗∗
=0.0143,𝑦
∗∗∗
=0.6667
Saddle point
𝑓𝑝
∶𝑥
∗∗∗
=𝟎.𝟓𝟓𝟕𝟏,𝒚
∗∗∗
=𝟎.𝟔𝟓𝟔𝟖
Stable (node)
𝑓𝑝
∶𝑥
∗∗∗
=0.571,𝑦
∗∗∗
=0.0104
Saddle point
𝑓𝑝
∶𝑥
∗∗∗
=0,𝑦
∗∗∗
=0 trivial
Studying these equilibrium points, we observe
that 𝑓𝑝
is more realistic than the other. Interpreting
𝑓𝑝
, we see that the value of 𝑦
∗∗∗
is slightly higher
than the value of 𝑥
∗∗∗
. It means both have a mild
strategic behavior during the battle and player y wins
this battle, because its value is greater than 𝑥
∗∗∗
.
The following figures show the expected strategic
behavior of each player throughout time (we set that
the time is expressed by days) as well as, the
endurance of each one during the battle. Furthermore,
bifurcation diagrams are presented, indicating how
they behave strategically, as the difficulty of the
battlefield changes (G).
Figure 2: Timeseries diagrams for Cases 1, 2 and 3.
In Fig. 2, the strategic behaviors of x (blue line)
and y (red line) are presented during the battle in each
case. The lines express the expected strategic
behavior of the player, and their oscillation shows the
duration of the battle (in days). Moreover, the
distance of each oscillation represents the endurance
in time. In a nutshell, we observe that in each case the
red line is above the blue, which means that player y
has more aggressive behavior and wins on each
battlefield. In cases 1 and 2, the win comes in a few
days, but in case 3 lasts a month approximately.
SIMULTECH 2025 - 15th International Conference on Simulation and Modeling Methodologies, Technologies and Applications
170

Figure 3: Bifurcation diagrams for Cases 1, 2 and 3. x – blue
line, y – red line.
Fig. 3 illustrates the Bifurcation diagrams for
Cases 1, 2, and 3. In each case, parameter G
represents the difficulty of the battlefield and includes
the weather phenomena (or features) that may affect
each battle. We observe that in each case, the red line
is above the blue (in all plots), which means that y has
aggressive behavior.
5 NUMERICAL RESULTS – 3D
MODEL
Regarding the analysis presented above and
summarizing the results, we observe that player x is
unable to withstand the enemy’s attacks, and player
y emerges victoriously on each battlefield. Thus, the
question is: How could participant x overturn the
outcome of the battle?
Founta and Zachilas (2021) argued that certain
crucial factors (parameters) of the model could
overturn the outcome of the battle. While their
argument is valid, it has limitations. Simply altering a
parameter may not be sufficient to reverse the
outcome. Instead, it is essential to introduce new
actions to achieve a decisive overturn. To address
this, we propose the inclusion of an ally to support
player x in the battle. Thus, we extend Eq. (1) into a
system of three equations, as presented below:
⎩
⎪
⎨
⎪
⎧
𝑥
=4∙𝑥
∙
1−𝑥
∙𝑃
+𝑇𝑁
+𝑇𝐴
+𝑇𝐿
+𝑇𝐼
+𝑎𝑙𝑐∙4∙𝑧
∙
1−𝑧
−𝐺∙𝐷
+𝐸
∙2∙𝑦
∙1−𝑦
𝑦
=4∙𝑦
∙
1−𝑦
∙𝑃
+𝑇𝑁
+𝑇𝐴
+𝑇𝐿
+𝑇𝐼
−1 − 𝐺 ∙[1 − 𝑎𝑙𝑐 + 𝐷
+𝐷
+𝐸
] ∙ 2𝑥
∙1−𝑥
𝑧
=𝑃
+𝑇
∙𝑧
∙1−𝑧
−𝐷
+𝐸
∙𝑦
∙1−𝑦
(4)
where:
𝑧
: The expected strategic behavior of the
player (ally) z at the time t+1.
𝑧
: The strategic behavior of the player (ally) z at the
time t.
𝑃
: represents the military forces (quantity) of
ally z.
𝑇
: indicates the sum of the ally’s technological
military capabilities (quality).
𝑎𝑙𝑐: describes the influence that the ally (z) exerts,
either positively or negatively, on each player. We
describe ally’s intervention through diplomacy,
providing technology, or offering human resources.
𝐷
: represents the estimated damage that z causes to
y.
𝐸
: describes the expected military expenditures of
ally z to support the player x for the impending battle.
The third equation in Eq. (2) represents the expected
strategic behavior of player z and includes the factors
(parameters) that influence the ally’s behavior.
Regarding the initial values, we retain the
previous values constant and set: 𝑃
=0.5,𝑇
=
0.7,𝐷
=0.03 and 𝐸
=0.015.
This implies that the ally has moderate military
forces and significant technological capabilities
(since the value is close to 1). Additionally, we
assume that player y inflicts minimal damage on z,
and player z allocates 1.5% of their military
expenditures to support.
The parameter 𝑎𝑙𝑐 is analyzed under three
scenarios for each Case:
𝑎𝑙𝑐=0.3, representing the ally’s
intervention through diplomacy.
𝑎𝑙𝑐=0.5, indicating that the ally provides
technological support.
𝑎𝑙𝑐=0.7, which shows that the ally offers
human resources to player x.
Through the analysis, we observed that the ally’s
military forces should satisfy 𝑃
0.5. Based on our
findings, if the value of 𝑃
is lower than 0.5, the
model fails to produce rational solutions that align
with reality. Thus, the minimum military force
required from the ally is 0.5, which serves as a
necessary and sufficient condition for the model and
its analysis.
Further, we revisit the examined cases (different
battlefields) and repeat the analysis process to
observe the differences when the ally intervenes.
Once more we solve the system of equations (Eq.
2) and examine the stability of each equilibrium point.
Additionally, we predict the outcome of the battle and
their expected optimal strategic behavior. For each
case, we present three scenarios, illustrating different
forms of the ally’s intervention during the battle.
The following table summarizes these scenarios.
Modeling and Simulating of Combat: An Empirical Application
171

Table 2: Case 1, 2 and 3 - Initial values and equilibrium
points of each scenario.
Case 1
Ally 𝒂𝒍𝒄 Equilibrium Points
𝑃
=0.5
0.3
𝑓𝑝
∶𝒙
∗
=𝟎.𝟔𝟐𝟓𝟕,𝒚
∗
=𝟎.𝟏𝟓𝟔𝟗,𝒛
∗
=
𝟎.𝟏𝟐𝟕𝟗
𝑓𝑝
∶
𝑥
∗
=0.5648,𝑦
∗
=0.1689,𝑧
∗
=
0.0423
𝑓𝑝
∶𝑥
∗
=0,𝑦
∗
=0,𝑧
∗
=0
0.5
𝑓𝑝
∶
𝒙
∗
=𝟎.𝟔𝟗𝟒𝟏,𝒚
∗
=𝟎.𝟎𝟗𝟕𝟒,𝒛
∗
=
𝟎.𝟏𝟒𝟑𝟕
𝑓𝑝
∶
𝒙
∗
=𝟎.𝟓𝟕𝟎𝟖,𝒚
∗
=𝟎.𝟏𝟏𝟔𝟓,𝒛
∗
=
𝟎.𝟎𝟐𝟕𝟖
𝑓𝑝
∶𝑥
∗
=0,𝑦
∗
=0,𝑧
∗
=0
0.7
𝑓𝑝
∶𝒙
∗
=𝟎.𝟕𝟓𝟓𝟕,𝒚
∗
=𝟎.𝟎𝟓𝟓,𝒛
∗
=
𝟎.𝟏𝟓𝟒
𝑓𝑝
∶𝑥
∗
=0.5681,𝑦
∗
=0.0759,𝑧
∗
=
0.0176
𝑓𝑝
∶𝑥
∗
=0,𝑦
∗
=0,𝑧
∗
=0
Case 2
Ally 𝒂𝒍𝒄
Equilibrium Points
𝑃
=0.55
0.3
𝑓𝑝
∶𝑥
∗∗
=0.6659,𝑦
∗∗
=
0.2872,𝑧
∗∗
=0.1513
𝑓𝑝
∶
𝒙
∗∗
=𝟎.𝟕𝟎𝟓,𝒚
∗∗
=
𝟎.𝟒𝟎𝟐𝟐,𝒛
∗∗
=𝟎.𝟐𝟓𝟓𝟒
𝑓𝑝
∶𝑥
∗∗
=0,𝑦
∗∗
=0,𝑧
∗∗
=0
𝑃
=0.5
0.5
𝑓𝑝
∶
𝒙
∗∗
=𝟎.𝟕𝟎𝟔𝟕,𝒚
∗∗
=
𝟎.𝟏𝟒𝟔𝟓,𝒛
∗∗
=𝟎.𝟏𝟑𝟎𝟖
𝑓𝑝
∶
𝑥
∗∗
=0.6263,𝑦
∗∗
=
0.1762,𝑧
∗∗
=0.0446
𝑓𝑝
∶𝑥
∗∗
=0,𝑦
∗∗
=0,𝑧
∗∗
=0
0.7
𝑓𝑝
∶𝒙
∗∗
=𝟎.𝟕𝟔𝟕𝟗,𝒚
∗∗
=
𝟎.𝟎𝟕𝟕𝟒,𝒛
∗∗
=𝟎.𝟏𝟒𝟖𝟔
𝑓𝑝
∶𝒙
∗∗
=𝟎.𝟔𝟏𝟕𝟗,𝒚
∗∗
=
𝟎.𝟏𝟎𝟖𝟔,𝒛
∗∗
=𝟎.𝟎𝟐𝟓𝟕
𝑓
𝑝
∶
𝑥
∗∗
=0,𝑦
∗∗
=0,𝑧
∗∗
=0
Case 3
Ally
𝒂𝒍𝒄
Equilibrium Points
𝑃
=0.5
0.3
𝑓𝑝
∶𝒙
∗∗∗
=𝟎.𝟔𝟔𝟕𝟔,𝒚
∗∗∗
=
𝟎.𝟎𝟎𝟔𝟒,𝒛
∗∗∗
=𝟎.𝟏𝟓𝟏𝟗
𝑓𝑝
∶𝑥
∗∗∗
=0,𝒚
∗∗∗
=0,𝒛
∗∗∗
=0
0.5
𝑓𝑝
∶
𝒙
∗∗∗
=𝟎.𝟕𝟐𝟓𝟖,𝒚
∗∗∗
=
𝟎.𝟎𝟒𝟐𝟔,𝒛
∗∗∗
=𝟎.𝟏𝟓𝟔𝟗
𝑓𝑝
∶
𝒙
∗∗∗
=0.5861,𝒚
∗∗∗
=
0.053,𝒛
∗∗∗
=0.012
𝑓
𝑝
∶
𝒙
∗∗∗
=0,𝒚
∗∗∗
=0,𝑧
∗
=0
0.7
𝑓𝑝
∶𝒙
∗∗∗
=𝟎.𝟕𝟕𝟖𝟓,𝒚
∗∗∗
=
𝟎.𝟎𝟐𝟓,𝒛
∗
=𝟎.𝟏𝟔𝟎𝟗
𝑓𝑝
∶𝒙
∗∗∗
=0.5861,𝒚
∗∗∗
=
0.036,𝒛
∗∗∗
=0.0082
𝑓
𝑝
∶
𝒙
∗∗∗
=0,𝒚
∗∗∗
=0,𝒛
∗∗∗
=0
Analysing the stability of fixed points, we find
that all are saddle points (with 𝑓𝑝
omitted as trivial),
reflecting the system's complexity. The bolded
solutions represent the most realistic strategic
behaviour. In Case 1 (𝑎𝑙𝑐=0.5), the ally supports x
through either independent technology use (indirect)
or supervised assistance (direct). As ally intervention
increases, x adopts a more aggressive stance while y
becomes defensive, highlighting the ally’s crucial
role in shifting the outcome. In Case 2 – Island seizure
battle (G = 0.3), player x wins the battle, as the 𝑎𝑙𝑐
varies. Furthermore, when 𝑎𝑙𝑐=0.7 there are two
expected optimal strategic behaviors. This suggests
that the ally can contribute either directly or
indirectly. Specifically, the ally could provide troops
to support the battle (direct approach) or assist player
x in decision making (indirect approach). In the last
case, we analyze a ground battle (G = 0.7), where
player y holds a geographical advantage. The
minimum required ally’s military force (𝑃
=0.5) is
also determined as 𝑎𝑙𝑐 varies. Moreover, we observe
a significant difference between the values of 𝑥
∗∗∗
and
𝑦
∗∗∗
in each scenario. This suggests that this battle
could be a total destruction for player y, regardless of
the support provided by the ally.
The following time-series diagrams illustrate the
duration of the battle in cases 1, 2, and 3, as well as
the endurance of players x and y during the battle.
Figure 4: Case 1 – Time-series diagrams for sub-scenarios:
alc=0.3, alc= 0.5, alc=0.7. x – blue line, y – red line.
Fig. 4 illustrates the strategic behaviour of x (blue
line) and y (red line) during the naval battle (G = 0.5)
over time (days). In all cases, x adopts an aggressive
(Hawk) strategy, while y remains defensive (Dove),
with the red line following a linear pattern. At 𝑎𝑙𝑐=
0.3, a gap exists due to ally’s support, converging
around 𝑡 35 days, marking a critical turning point.
Similar trends appear for (𝑎𝑙𝑐=0.5 and 𝑎𝑙𝑐=0.7)
confirming x’s endurance advantage.
SIMULTECH 2025 - 15th International Conference on Simulation and Modeling Methodologies, Technologies and Applications
172
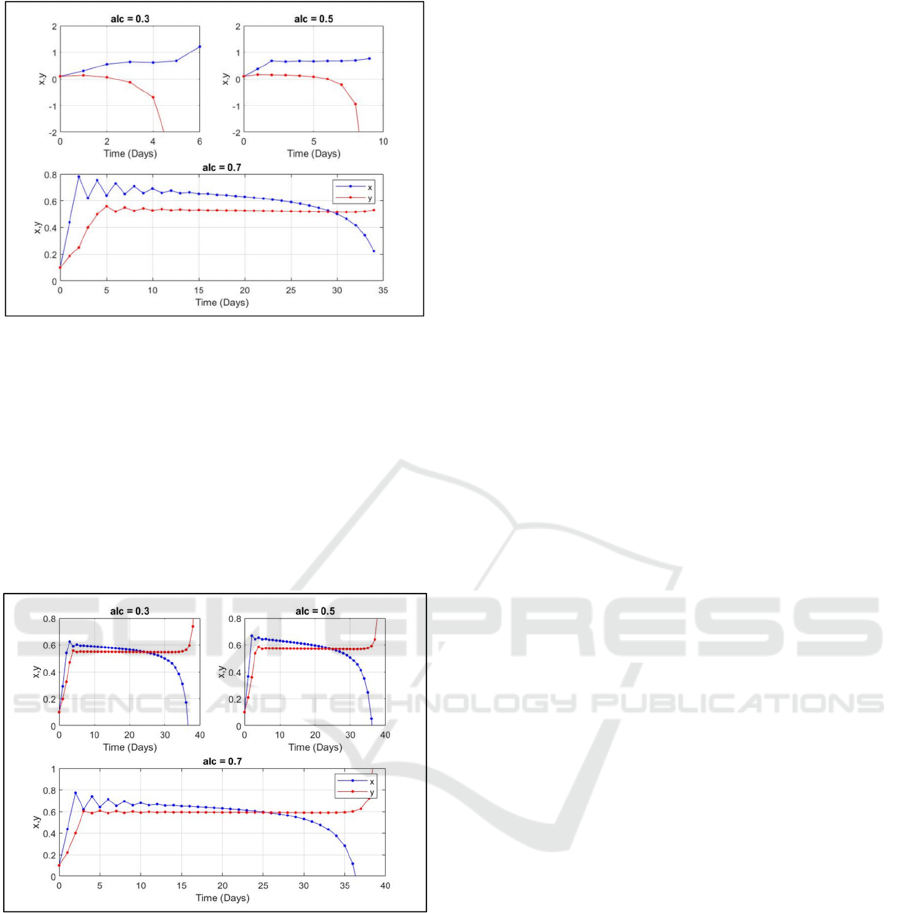
Figure 5: Case 2– Timeseries diagrams for sub-scenarios:
alc=0.3, alc= 0.5, alc=0.7. x – blue line, y – red line.
Fig. 5 shows the strategic behavior of x and y
during the island seizure battle (G = 0.3). In all cases,
x follows an aggressive (Hawk) strategy, while y
remains defensive (Dove). At 𝑎𝑙𝑐=0.3, the battle
lasts 6 days, increasing to 10 days at 𝑎𝑙𝑐=0.5. In the
final scenario (𝑎𝑙𝑐=0.7), initial oscillations lead to
a turning point at 𝑡 28 days, with the battle lasting
34 days. Across all cases, x maintains superiority.
Figure 6: Case 3– Timeseries diagrams for sub-scenarios:
alc=0.3, alc= 0.5, alc=0.7. x – blue line, y – red line.
Regarding Fig. 6, the maximum duration of
ground battle is approximately 𝑡 40 days, with a
critical point at 𝑡 25 days. In all plots, the blue line
is consistently above the red, indicating that player x
adopts aggressive behavior (Hawk) while player y
takes on more defensive strategic behavior (Dove).
In summary, Fig. 6, demonstrates that in all
scenarios, player x maintains a dominant position
until the critical point ( 𝑡 25 days), where the
outcome overturns.
6 CONCLUSIONS
We propose a decision-making combat model to
study the expected optimal strategic behavior of two
players during a battle. Additionally, we analyze the
kind of players’ strategic behavior and provide
predictions concerning the outcome of the battle.
Through the analysis of two-dimensional (2D)
model, we identify the most critical factors
influencing the players' strategic behavior during the
battle. We examined three case studies: a naval battle
(Case 1), an island seizure battle (Case 2), and a
ground battle (Case 3).
Adopting the “Hawk–Dove” game, we
endeavored to interpret the players' strategic behavior
and predict the outcome of the combat. The solutions
derived from the model (in each case study) describe
the Nash equilibria of this game.
According to our findings, player y wins in all
battlefields (case studies). Even if the parameters of
the model are crucial and influence the outcome of
the battle, we observe limitations in their impact. To
tackle this issue, we introduced a new player (player-
z) who acts as ally to player x. We extend the model
(Eq. (1)) into a system of three equations (Eq. (2)) and
re-analyzed the same case studies.
We incorporated three forms of intervention by
the ally: diplomacy, provision of technology, and
human resources. At this stage, we identified the
minimum military forces required from the ally in
each case. Furthermore, we detailed both the direct
and indirect methods of intervention employed by the
ally across all scenarios. Furthermore, we detailed
both the direct and indirect methods of intervention
employed by the ally across all scenarios x.
Consequently, player x won in all battlefields (case
studies) overturning the initial outcomes.
While our model predicts optimal strategic
behaviour and battle outcomes, it is based on certain
assumptions that may limit its applicability in highly
dynamic, multi-player combat environments. One
key limitation is the assumption of deterministic
strategic interactions between players, which does not
account for unpredictable elements such as battlefield
intelligence, morale shifts, or external
reinforcements.
As further research, we could explore the
implications of reducing the parameter space even
further, potentially consolidating the variables into
just two or three dimensions. Another promising
avenue is the application of machine learning
techniques to classify different combat scenarios and
predict strategic outcomes more effectively based on
reduced parameter sets. These approaches could
Modeling and Simulating of Combat: An Empirical Application
173

enhance decision-support systems and improve the
adaptability of combat models to modern, complex
warfare scenarios.
REFERENCES
Anderson, A.D., Bryan, P., Cannon, C., Day, B., Jeffrey, J.
(1972). An Experiment in Combat Simulation: The
Battle of Cambrai, 1917. The Journal of
Interdisciplinary History. The MIT Press, 2(3), 229–47.
https://doi.org/10.2307/202286.
Alberts, D. S., Huber, R. K., & Moffat, J. (2010). The
NATO net enabled capability command and control
maturity model. Technical report, Office of the
Assistant Secretary of Defense, Command and Control
Research Program, Washington, DC.
Tolk, A. (2012). Engineering Principles of Combat
Modeling and Distributed Simulation, Willey, 1–22.
DOI:10.1002/9781118180310
Taylor, J. G. (1974). Lanchester‐type models of warfare and
optimal control. Naval Research Logistics
Quarterly, 21(1), 79-106. https://doi.org/10.1002/
nav.3800210107
Cangiotti, N., Capolli, M., & Sensi, M. (2023). A
generalization of unaimed fire Lanchester’s model in
multi-battle warfare. Operational Research, 23(2), 38.
https://doi.org/10.1007/s12351-023-00776-8
Keane., T. (2011). Combat modelling with partial
differential equations. Applied Mathematical
Modelling, DOI: 10.1016/J.APM.2010.11.057
Kress, M., Caulkins, J.P., Feichtinger, G., Grass, D., Seidl,
A. (2018). Lanchester model for three-way combat,
European Journal of Operational Research,
https://doi.org/10.1016/j.ejor.2017.07.026 .
Founta K., Zachilas L. (2023). Mathematical modeling of
strategic behavior: the Battle of Midway, 1942. The
Journal of Defense Modeling and Simulation. 0(0).
doi:10.1177/15485129231160182
Fox, W. P. (2010). Discrete Combat Models. International
Journal of Operations Research and Information
Systems, 1(1), 16–34. doi:10.4018/joris.2010101302
Guckenheimer, J., (1979). Sensitive dependence to initial
conditions for one dimensional maps.Communications
in Mathematical Physics, 70(2), 133-160.
Jiang, R., Yang, M., Wang, S., Chao, T. (2020). An
improved whale optimization algorithm with armed
force program and strategic adjustment, Applied
Mathematical Modelling. https://doi.org/10.1016/
j.apm.2020.01.002.
Koehler, M. T., Bricio-Neto, J. L., Page, E. H., & Tolk, A.
(2024). Applying complex adaptive systems research
results to combat simulations of the generation-after-
next. The Journal of Defense Modeling and Simulation.
https://doi.org/10.1177/15485129241233608
Lee, D., Kim, M.J., Ahn, C.W. (2021) Predicting combat
outcomes and optimizing armies in StarCraft II by deep
learning, Expert Systems with Applications.
https://doi.org/10.1016/j.eswa.2021.115592.
Mirjalili, S., Lewis, A. (2016). The whale optimization
algorithm, Advances in Engineering Software.
https://doi.org/10.1016/j.advengsoft.2016.01.008.
Founta, K. and Zachilas, L. (2021). Dynamical Systems
Theory Compared to Game Theory: The Case of the
Salamis’s Battle. Applied Mathematics, 12, 882-899.
https://doi.org/10.4236/am.2021.1210058
Peng, R., Zhai, Q., Levitin, G. (2016). Defending a single
object against an attacker trying to detect a subset of
false targets. Reliability Engineering & System Safety,
https://doi.org/10.1016/j.ejor.2016.06.059
Protopopescu., V, Santoro., R.T., Dockery, J. (1989).
Combat modeling with partial differential equations.
European Journal of Operational Research, DOI:
10.1016/0377-2217(89)90102-1
Smith, M.J., Price, G.R. (1973). The Logic of Animal
Conflict. Nature, 246, 15-18. https://doi.org/10.
1038/246015a0
Scheinerman, E. R. (2012). Invitation to dynamical systems.
Dover Publications. ISBN: 978-0486485942.
Robinson, R. C. (2012). An introduction to dynamical
systems: Continuous and Discrete. American
Mathematical Society, 2
nd
Edition, Vol.19, ISBN: 978-
0-8218-9135-3.
Zhai, Q., Ye, Z.-S., Peng, R., Wang, W. (2017). Defense
and attack of performance-sharing common bus
systems. European Journal of Operational Research,
DOI: 10.1016/j.ejor.2016.06.059
Zhang, L. (2023). Combat modelling using Lanchester
equations. International Journal of Mathematical
Education in Science and Technology, 55(2), 224–234.
https://doi.org/10.1080/0020739X.2023.2242863.
SIMULTECH 2025 - 15th International Conference on Simulation and Modeling Methodologies, Technologies and Applications
174
