
Coverage Path Planning Using a Group of UAVs
Bouras Abdelwahhab
1 a
, Bouzid Yasser
2 b
, Cherifi Youcef
2
and Guiatni Mohamed
2 c
1
Ecole Sup
´
erieure Ali Chabati, Reghaia, Algiers, Algeria
2
Ecole Militaire Polytechnique, Bordj El Bahri, Algiers, Algeria
fi
Keywords:
Coverage Path Planning, Unmanned Aerial Vehicles, Traveling Salesman Problem, Genetic Algorithms.
Abstract:
This article introduces a novel methodology of path planning within a group of Unmanned Aerial Vehicles
(UAVs) for aerial detection. The primary aim of this method is to ensure comprehensive coverage of a desig-
nated Region of Interest (RoI) while taking measurements from the entire region. The proposed methodology
operates through a structured yet adaptive three-phase process. First, the RoI is transformed into a discrete
representation using a meshing algorithm, ensuring a well-defined and homogeneous spatial structure for sub-
sequent planning. This discretized space is then well partitioned into subregions via the K-means clustering
algorithm, optimizing workload distribution among UAVs while preserving spatial coherence. Finally, the
path of each UAV is formulated as a Traveling Salesman Problem (TSP) and solved using an enhanced Ge-
netic Algorithm (GA). Specifically, this GA is tailored to accelerate convergence and yield optimized paths.
The principal advantages of the proposed method, as demonstrated through simulation experiments, are its
optimization capabilities, flexibility and reduction in computational time.
1 INTRODUCTION
Over the past two decades, the rapid advancement
in sensor technology and embedded systems for Un-
manned Aerial Vehicles (UAVs) has markedly ex-
panded their applicability across a range of domains,
both civilian and military. These applications include
surveillance, photogrammetry, the Internet of Things
(IoT), search and rescue operations, and agricultural
tasks, etc (see Fig. 1a and Fig. 1b). Additionally, the
deployment of UAV fleets mitigates the limitations in-
herent in single UAV operations, enhancing overall
efficiency. This has numerous advantages, particu-
larly in scenarios that pose significant risks to human
operators (refer to Fig. 1c), such as reducing exe-
cution time and minimizing human resource involve-
ment. Nonetheless, each application presents its tech-
nical challenges, with control, optimization and path
planning being critical areas requiring advancement.
This paper focuses on coverage path planning
(CPP) (Choset, 2001) using a UAV group (Cabreira
et al., 2019) (Bouras et al., 2022) (Kumar and Kumar,
2023) (Chen et al., 2024). Each UAV must systemat-
ically measure a predefined set of points to gather in-
a
https://orcid.org/0000-0003-3518-6821
b
https://orcid.org/0000-0002-8400-9912
c
https://orcid.org/0000-0002-5899-6862
formation essential for achieving comprehensive cov-
erage while circumventing obstacles. This necessi-
tates the employment of spatial division techniques,
the generation of Points of Interest (PoI), and the op-
timization of planned routes. Moreover, optimizing
these procedures in terms of energy and time (Yu and
Lee, 2024) is crucial.
Typically, research addressing the Multi-Coverage
Path Planning (mCPP) problem within a Region of In-
terest (RoI) follows a four-step process (Bouras et al.,
2019): 1) discretizing the spatial domain; 2) distribut-
ing the workload among UAVs based on their flight
autonomy; 3) employing a planning algorithm to de-
fine the paths; and 4) smoothing the resultant routes.
In reference (Kapoutsis et al., 2017), the authors
tackle the coverage problem by discretizing the space
into small square cells and establishing rules to en-
sure equitable distribution of the RoI, thereby avoid-
ing redundancy and ensuring comprehensive cover-
age. The paths, determined by the Spanning Tree
Coverage (STC) algorithm, navigate around obsta-
cles such as trees. While effective, the STC algo-
rithm’s speed decreases with more UAVs, increasing
memory demands and causing suboptimal paths due
to frequent turns. This issue was addressed in (Gao
et al., 2018) through optimization via Ant Colony Op-
timization (ACO), which improved path efficiency.
Abdelwahhab, B., Yasser, B., Youcef, C., Mohamed and G.
Coverage Path Planning Using a Group of UAVs.
DOI: 10.5220/0013421200003970
In Proceedings of the 15th International Conference on Simulation and Modeling Methodologies, Technologies and Applications (SIMULTECH 2025), pages 159-165
ISBN: 978-989-758-759-7; ISSN: 2184-2841
Copyright © 2025 by Paper published under CC license (CC BY-NC-ND 4.0)
159
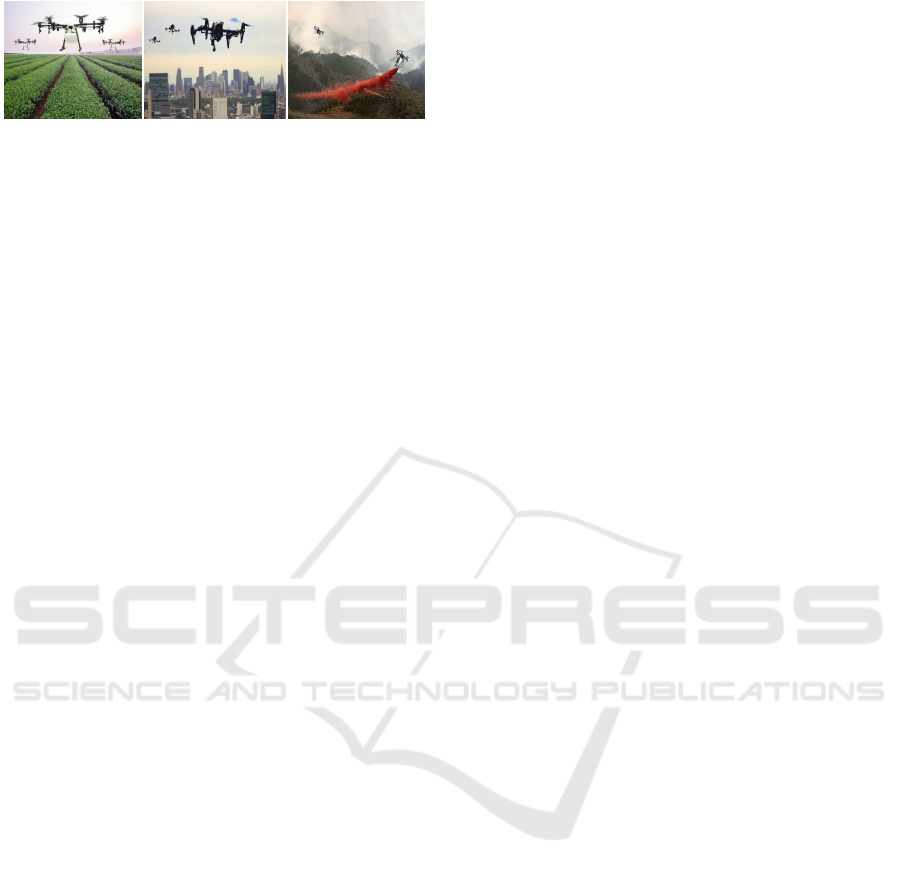
(a) (b) (c)
Figure 1: Examples of UAV fleet applications: (a) Agricul-
tural uses, (b) Internet of Things (IoT), (c) Fire forest uses.
In the work by H. Azp
´
urua et al. (Azp
´
urua et al.,
2018), the RoI is partitioned into hexagonal cells, of-
fering greater connectivity to adjacent cells and min-
imizing inter-cell distances, thus reducing the Total
Path Length (TPL). The planning is modeled as a
Traveling Salesman Problem (TSP), the results illus-
trate the impact of UAV involved and coverage line
distance on mission execution time. However, the op-
timization remains requires improvements due to the
non-exact discretization of the RoI.
Another study (Balampanis et al., 2017) employs
triangulation to mesh the RoI, aligning the triangles
with the sensor’s footprint. UAVs are assigned sub-
regions based on their flight autonomy using two
proposed algorithms: Wave Front Propagation and
Reverse Watershed Scheme (AWP & RWS). This
approach also incorporates a Dead Lock Handling
(DLH) algorithm to prevent no-fly zones. However,
the analysis does not address the number of turns or
the energy consumption associated with these paths.
This work introduces a novel three-phase method-
ology that enhances the efficiency of multi-UAV path
planning while addressing the limitations of exist-
ing scenario-specific approaches. Unlike traditional
methods with restricted applicability, our approach
offers greater flexibility in discretization, sensor se-
lection, and path optimization. A key contribution
is the precise discretization of the RoI, overcoming
the approximations common in prior techniques. This
structured representation enables optimized task al-
location via K-means clustering. Additionally, an
enhanced Genetic Algorithm (GA) with problem-
specific mutation operators accelerates convergence
and improves solution quality. These advancements
collectively lead to faster convergence, greater scala-
bility, superior path optimization, and increased com-
putational efficiency compared to standard GA-based
methods.
The structure of this article is organized as fol-
lows: Section II and Section III delineate the method-
ology and provide a detailed description of the algo-
rithms employed. Section IV is devoted to presenting
the results obtained from the simulations. Finally,
Section V concludes the paper with a discussion of
the results and outlines potential avenues for
future research.
2 METHODOLOGY
2.1 Preliminary
Coverage of the RoI using UAVs involves the gener-
ation of PoIs distributed over the surface of this RoI.
The quantity and spatial distribution of these points
are primarily influenced by the desired extent of cov-
erage (either full or partial) and the range of the on-
board sensors. Each UAV is allocated a finite set of
PoIs based on its flight capabilities. The objective is
to take measurements at each PoI by tracing an op-
timal path that connects these points. The mission
begins at an initial point, denoted as ”Start”, and con-
cludes at a ”Goal” point, with the caveat that each
UAV ultimately returns to the starting point, effec-
tively considering them as confused, in other words,
each UAV ends the coverage mission by returning to
the starting point.
To achieve this, we model the problem represent-
ing our RoI as a closed region delineated by polyg-
onal segments, which may be either convex or non-
convex. Obstacles are present only in the area outside
the RoI but within the operational workspace. The
configuration of the RoI’s shape and the number of
UAVs are user-defined parameters, and each UAV’s
flight autonomy must be sufficient to accomplish the
assigned mission.
The UAVs employed are considered rotary-wing
aircraft, specifically quadcopters. Their inherent ma-
neuverability, hovering capability, and ease of control
make them well-suited for such missions, particularly
when equipped with various types of embedded sen-
sors (as illustrated in Fig. 2).
2.2 Mathematical Formulation
Let P ⊆ R
2
represent the workspace designated for
coverage, with dimensions [l × w], where l and w de-
note the length and width of P , respectively.
Define A ⊆ R
2
as the RoI characterized by a list
of n segments S =
{
s
1
,s
2
,...,s
n
}
, and A ⊆ P , O ⊆ R
2
and O ⊆ P /A is the non-fly zone or O =
∑
z
i=0
o
i
, such
that o
i
represents the i
th
from z small obstacles located
between A and P .
Let c
i
∈ A denote the set of PoIs, where c
i
=
(x
i
,y
i
) for i ∈
{
0,...,r
}
and r is the number of the
PoIs. Specifically, c
0
= (x
0
,y
0
) represents the initial
position of the UAVs’ parking platform, with coordi-
nates x
0
,y
0
. Let u ⊆ N
∗
denote the number of UAVs,
SIMULTECH 2025 - 15th International Conference on Simulation and Modeling Methodologies, Technologies and Applications
160
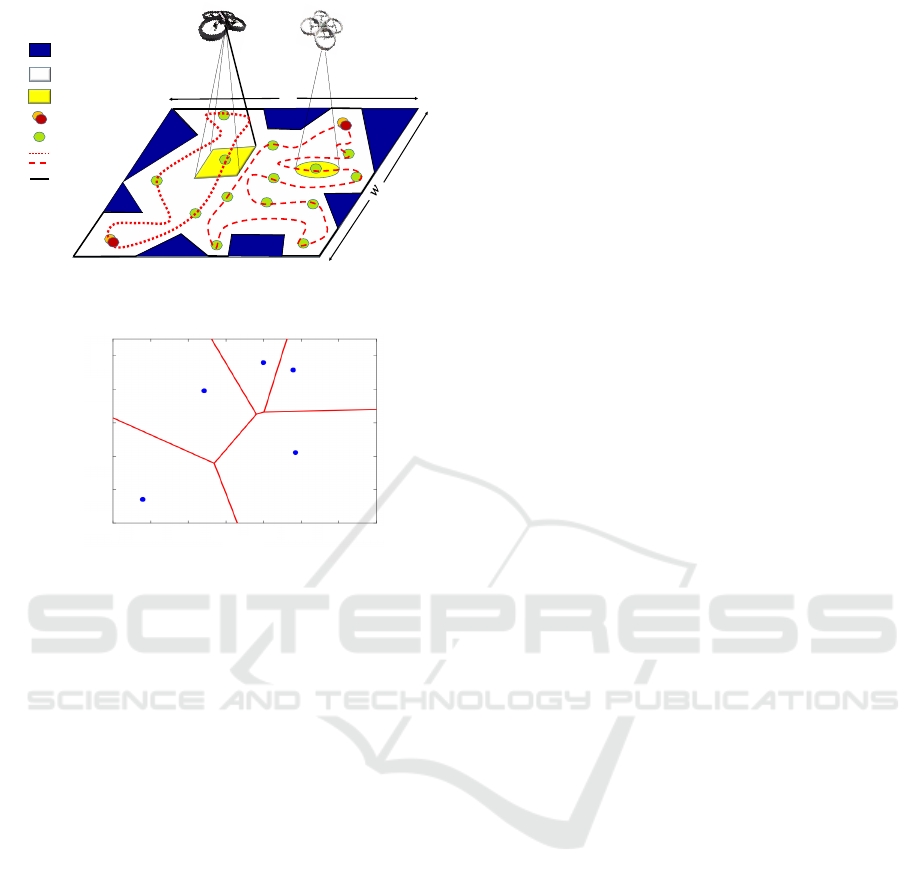
2D workspace
Obstacles
Vertices
𝑙
PoIs
Sensor footprint
RoI
Paths
Start & Goal points
Figure 2: Coverage using a group of UAVs.
1
0.8
0.6
Y [m]
0.4
0.2
0
0
0.2
0.4
1
1.2
1.4
X [m]
0.6
0.8
Figure 3: Voronoi diagram.
and let R
s f
signify the radius of the sensor footprint,
which may take the form of either a square [l
s f
× l
s f
]
or a rectangle [l
s f
× w
s f
], where l
s f
and w
s f
represent
the length and width of the sensor footprint, respec-
tively.
In the initial phase, following the selection of P ,
A and r, we proceed to generate the PoIs within the
RoI A. This generation process utilizes the Voronoi
diagram, defined as follows:
V =
y ∈ Ω | d(y, x
i
) ≤ d(y, x
j
), f or j ̸= i
(1)
This function partitions the space into sub-regions
(referred to as cells when dealing with a large number
of r), such that all points p
i
: p
i
∈ Ω within each cell
are closer to x
i
than to x
j
for j ̸= i. Additionally, the
grid that delineates the r cells consists of the bisectors
of the line segments [x
i
,x
j
] (Fig. 3).
The computation of the Voronoi diagram for an ar-
bitrary set X =
{
x
i
| i = 0,...,r
}
, followed by the in-
tegration of each resulting cell and the determination
of its centers, constitutes a version of Voronoi Tessel-
lation known as the Lloyd algorithm (Du et al., 1999).
These centers represent our PoIs, with their quantity
being chosen according to the coverage requirements
and the type of sensors employed. A comprehensive
description of this algorithm is provided in the subse-
quent section (Algorithm 1).
The second step involves distributing these PoIs
among UAVs. It is crucial to achieve a homogeneous
distribution that considers the UAVs’ autonomies and
ensures an appropriate grouping of these points to
prevent collisions and balance the loads. This step
is facilitated by the K-means algorithm.
In the third step, we aim to determine the opti-
mal sequence of PoIs C =
n
c
1
,c
2
,...,c
i
,...,c
r
u
i
o
for
each UAV, which minimizes the TPL. Here, r
u
i
rep-
resents the number of points assigned to the i
th
UAV
u
i
. Given the flexibility in selecting the number and
distribution of PoIs, it is assumed that the TPLs are
within the operational range of the UAVs. Therefore,
the objective is to minimize the following function:
T PL
min
=
r
u
i
−1
∑
i=1
d(N
i
, N
i+1
) + d
N
r
u
i
, N
1
(2)
where d(N
i
, N
i+1
) is the distance between points N
i
and N
i+1
. The optimization of these paths is ensured
by adapting it as a TSP and solving it using a GA,
whose details are provided in Algorithm 2.
3 ALGORITHMS DESCRIPTION
The primary focus of this section is to develop the
previously outlined steps in the form of algorithms.
To generate PoIs, the RoI is partitioned into r cells
using an adapted Meshing algorithm (Algorithm 1).
Unlike traditional meshing techniques, this approach
iteratively refines the spatial subdivision to enhance
uniformity and adaptability. After initializing the in-
put data, the algorithm constructs an initial Voronoi
tessellation and determines the set x
i
| i = 0,...,r. At
each iteration, the centroids c
j
of the Voronoi cells are
computed and reallocated as new distribution points
for x
i
, triggering a re-computation of the tessellation.
This process continues until a predefined convergence
criterion is met or the maximum number of iterations
is reached. As a result, the algorithm progressively
produces more uniform cells, ultimately approximat-
ing a structured grid while preserving adaptability to
the underlying spatial constraints.
The second stage consists of assigning the final
cell centers c
j
| j = 0,...,r to the UAVs by cluster-
ing them into m
u
subgroups (Clusters), each contain-
ing r
u
i
points, while minimizing the intra-cluster dis-
tances. This ensures an efficient workload distribution
among UAVs. To achieve this, we employ K-means
clustering algorithm, which optimally partitions the
PoIs by minimizing the distance between each cluster
Coverage Path Planning Using a Group of UAVs
161

Let Ω be the working field, σ a density function on Ω, and r the number of generators. The initial set of
generators is denoted as x
i
| i = 0,...,r. The Meshing algorithm is defined as follows:
Input: l,w,S,r,X ,numIter,x
0
,y
0
.
Function: [v
r
, order of v
r
, x
c
j
, y
c
j
] = MeshingAlgorithm (x
i
,y
i
,S,numIter, r) % v
r
and its order
represent the Voronoi cell borders and their arrangement, while x
c
j
, y
c
j
denote cell centroids.
Initialization: Generate an initial set of r points x
i
| i = 0,...,r.
while the iteration count numIter is not reached do
Voronoi Tessellation: Compute the Voronoi diagram of Ω using the generator set x
i
| i = 0,...,r.
Centroid Computation: Determine the centroids c
j
| j = 0,...,r of the Voronoi cells.
Update: Set x
i
| i = 0,...,r ← c
j
| j = 0,...,r % Replace the set x
i
with the computed centroids c
j
.
end
Output: [v
r
, order of v
r
,x
c
j
,y
c
j
]
Algorithm 1: Meshing Algorithm.
center and its assigned points, as expressed by:
argmin
M
=
m
u
∑
i=1
∑
c
j
∈M
i
c
j
− µ
i
2
(3)
where µ
i
represents the centroid of cluster M
i
.
The clustering process follows an iterative two-
step refinement:
1. Cluster assignment: Each point c
j
is assigned to
the closest cluster center µ
i
based on a Voronoi
partitioning:
M
(t)
i
= {c
j
:∥ c
j
− µ
(t)
i
∥≤ ∥ c
j
− µ
(t)
i
∗
∥∀i
∗
= 1, . . . , m
u
}
(4)
2. Centroid update: The cluster centers are recom-
puted as the mean of the assigned points:
µ
(t+1)
i
= (M
(t)
i
)
−1
∑
c
j
∈M
t
i
c
j
(5)
This iterative process ensures convergence by pro-
gressively reducing the cost function. Given the finite
number of possible partitions, the algorithm is guar-
anteed to reach a stable solution, making it well-suited
for UAV task allocation in large-scale environments.
The final stage involves determining the optimal
sequence of points within each set M
i
to minimize
the total travel distance (Equation (2)) and establish
the optimal paths R
i
=
n
c
0
,...,c
r
u
i
o
. Given the com-
binatorial nature of this NP-hard problem, it is for-
mulated as a TSP and efficiently solved using an en-
hanced GA. For instance, even a modest set of 10
points leads to 181 440 and 362 880 possible arrange-
ments in symmetric and asymmetric TSPs, respec-
tively, highlighting the necessity of an adapted opti-
mization approach.
In this context, GA optimization involves evolving
a population of chromosomes C h
i
=
n
H
1
,...,H
r
u
i
o
,
where each chromosome represents a candidate route
R
i
. The fitness function evaluates each solution based
on the total traveled path length (TPL):
f (C) =
r
u
i
−1
∑
i=1
d(H
i
, H
i+1
) + d
H
r
u
i
, H
1
(6)
where r
u
i
denotes the number of waypoints as-
signed to a single UAV.
To efficiently explore the (n − 1)! possible per-
mutations, we introduce swap operations (flip, slide,
and swap) (Pham et al., 2017), which significantly ac-
celerate convergence, reduce computational complex-
ity, and ensure feasible solutions even for large popu-
lations. Without these adaptive operators, the algo-
rithm struggles to handle populations exceeding 16
elements, resulting in computation times exceeding
( > 2000 sec) seconds.
Algorithm 2 summarizes the third step of our so-
lution. Generating an initial population is necessary,
where each chromosome is assigned a value f
i
calcu-
lated by the fitness function. We then perform a selec-
tion within this population. Subsequently, new indi-
viduals in the population are created using crossover
and mutation. Finally, we repeat the process.
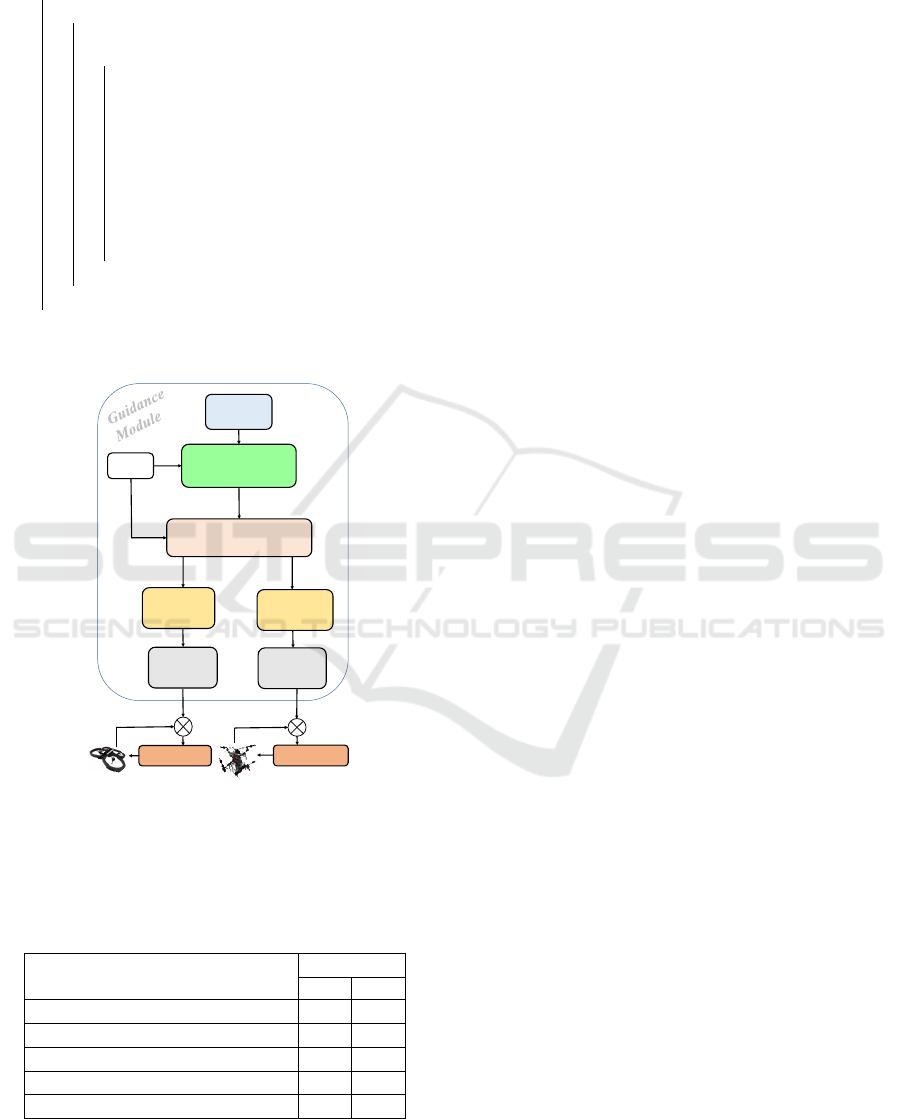
The entire proposed technique and its algorithm
sequence are summarized in Fig. 4. A detailed dis-
cussion of each step, based on the simulation results,
is provided in the next section.
4 SIMULATION RESULTS AND
DISCUSSION
In this section, we tested the effectiveness of the
algorithms presented in the previous section using
two scenarios. We selected a study region, which is
polygon-shaped and located within a square space of
dimensions [3 × 2] Km. In this region, we generated
the PoIs, distributed evenly across the surface to be
studied. The base station is positioned at p
0
(x
0
,y
0
) =
SIMULTECH 2025 - 15th International Conference on Simulation and Modeling Methodologies, Technologies and Applications
162
Data: population size (r
u
i
), Number of generations (n
g
), Number of cities = size (N
p
), Global min = Inf,
i ← 1 (i is the current iterations), Pop(t) ← (r
u
i
) chromosomes Pop
i
(t).
while not terminating condition do
while i ≤ r
u
i
do
f
i
← f (Pop
i
(t)) % f is the fitness function
while i ≤ r
u
i
do
NewPop
i
(t + 1) ←rand choose Pop
i
(t) from Pop(t)
CrossPop(t + 1) ←recombine (NewPop(t +1)) with P
c
% P
c
is the crossover probability
MutPop(t + 1) ←mutate (CrossPop(t +1)) with P
m
% P
m
is the mutation probability
Switch
case 1 mutate by flipping,
case 2 mutate by swapping,
case 3 mutate by sliding.
Pop(t + 1) ←MutPop(t + 1)
i ← i + 1
end
end
end
Algorithm 2: Solving TSP-GA.
Map
definition
Map
decomposition
Solving
TSP-GA
Optimal
route
User
UAV N
Controller
Optimal
route
UAV 01
Controller
Quadrotor 01
Quadrotor N
. . .
. . .
. . .
K-means
Solving
TSP-GA
Figure 4: Summary of the technique proposed in this work.
(1 Km,1 Km). The parameters of the simulation tests
are illustrated in Table 1.
Table 1: Simulation data.
Scenario
Parametres 1 2
Number of UAVs (u) 01 04
Number of iterations (numIter) 80 180
Number of cities (N
p
) 20 80
Population size (r
u
i
) 20 80
Number of generations (n
g
) 100 150
In the first scenario, we generated 20 measure-
ment PoIs. The Meshing algorithm required 80 it-
erations to establish the distribution of PoIs. Figure
5 (a) illustrates the outcome of this step, where lines
extend from the base station to each cell center, repre-
senting the path during the execution of the Meshing
algorithm. The final coordinates of the cell’s centers
obtained from this process are used in the subsequent
step. However, their deployment paths are not consid-
ered in this study.
A single UAV is utilized to provide coverage,
equipped with a circular sensor of radius R
s
= 200 m.
The path optimized by the TSP-GA (blue line) and
the resulting footprint coverage (red circles) are pre-
sented in Figure 5 (b). The optimization of the TPL
with TSP-GA across generations is shown in Figure 5
(c).
From this first test, it appears that:
• The number of iterations is directly related to
the number of PoIs generated. The number of
PoIs depends on the type of application, the on-
board sensor used, and the desired coverage qual-
ity (with or without overlaps).
• The TSP-GA is a crucial step for optimizing the
TPL. Theoretically, there are 19! possible ways to
connect the 20 PoIs and return to the initial point.
Using TSP-GA, this is efficiently calculated, re-
sulting in an overall distance of 7.7236 Km.
In the second scenario, 80 measurement points
were generated for four UAVs over the same region.
This setup provides a concrete demonstration of the
advantages of using a group of UAVs in terms of cov-
erage quality. Additionally, it allows us to test the ef-
fectiveness of the proposed algorithms in more com-
plex situations compared to a single UAV.
Such a distribution of the PoIs, as shown in Figure
Coverage Path Planning Using a Group of UAVs
163
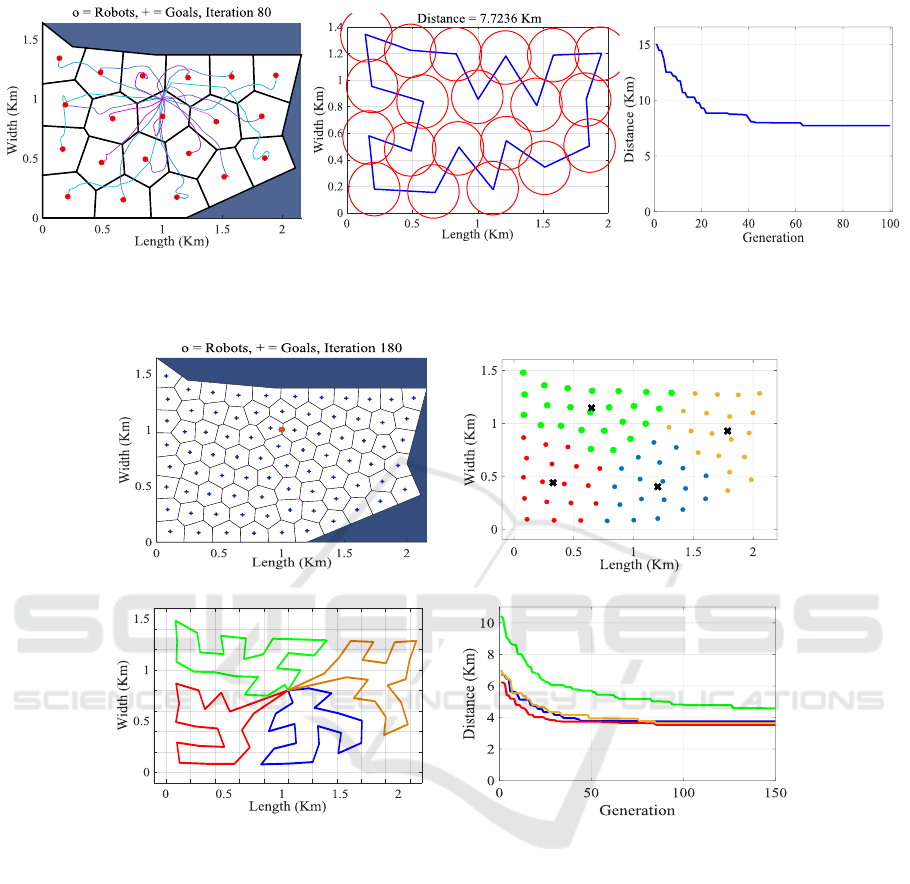
(a)
(b)
(c)
Figure 5: Area division and CPP (Scenario 1): (a) Area discretization, (b) Planned path and coverage results with circular
sensor footprint, (c) TPL according to generation.
(a) (b)
(c) (d)
Figure 6: Area division and CPP (Scenario 2): (a) Area discretization with Meshing algorithm, (b) K-means clusters, (c)
Planned paths solving TSP-GA, (d) TPLs according to generation.
6 (a), required 180 iterations. The result of grouping
the PoIs for each UAV using the K-means algorithm
is illustrated in Figure 6 (b), where the black crosses
represent the centroids of each cluster. Figure 6 (c)
presents the final planned paths for the UAVs, gener-
ated from the optimization step using TSP-GA. The
TLPs according to generation during optimization are
shown in Figure 6 (d). The results of this scenario
lead us to summarize the following conclusions:
• C1: The Meshing algorithm requires more iter-
ations as the number of PoIs increases, which is
manageable with the number of PoIs.
• C2: A homogeneous distribution of clustered PoIs
by the K-means algorithm has a beneficial effect
on TPLs (Table 2). This clustering also results in
isolated paths relative to each other, which helps
to avoid collisions between UAVs flying at the
same altitude.
• C3: The set of planned paths are optimal in
terms of TPL (and/or energy consumption), feasi-
ble, and ensure passage through all PoIs, thereby
achieving overall coverage of the RoI.
Moreover, from C1 and C2, the choice of the num-
ber of PoIs and the number of UAVs provides another
degree of freedom to accommodate the flight capabil-
ities of UAVs. Additionally, there is the possibility
of implementing sensors of various shapes (circular,
square, rectangular, etc.), which offers a generic solu-
SIMULTECH 2025 - 15th International Conference on Simulation and Modeling Methodologies, Technologies and Applications
164
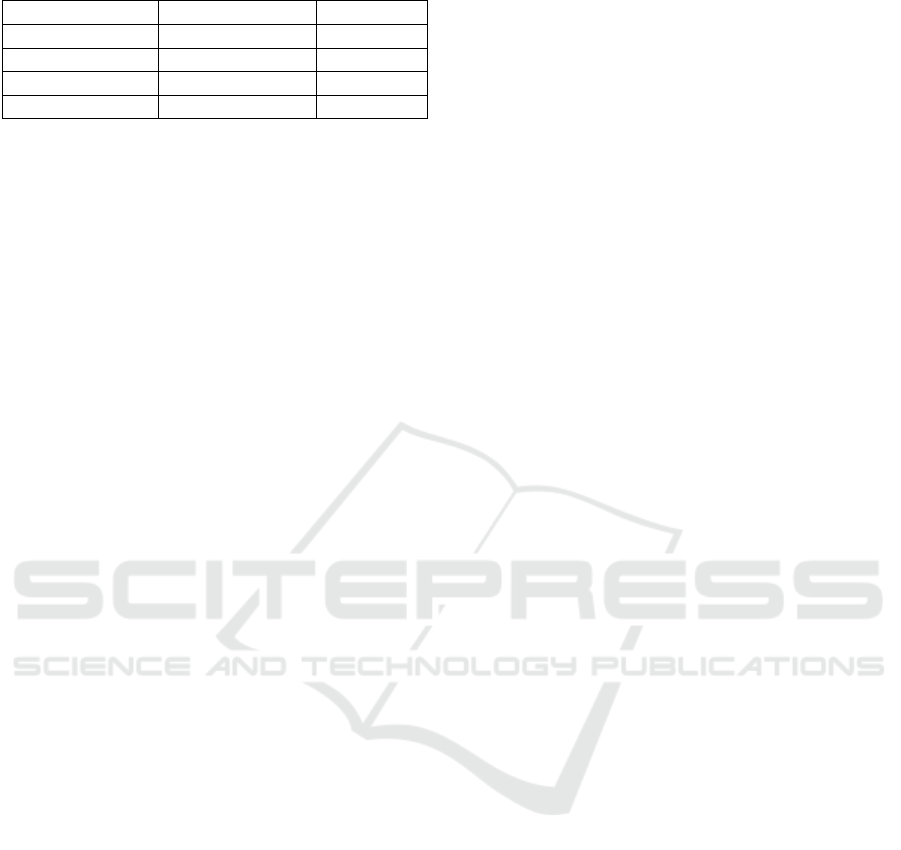
Table 2: PoIs and TPLs.
Path Number of PoIs TPL (Km)
Green path (R
1
) 24 4.5744
Red path (R
2
) 18 3.5241
Blue path (R
3
) 19 3.7513
Brown path (R
4
) 19 3.6438
tion for a wide range of applications.
5 CONCLUSION
Our work addresses UAV group path planning for
aerial detection applications (coverage). The primary
objectives are the automation of setup for crossing
points and planning optimized paths for UAVs. The
global approach is structured into three steps: the gen-
eration of PoIs, the clustering of these PoIs, and the
optimal connection of all these points to ensure com-
prehensive coverage of the studied map. Addresses
the limitations of scenario-specific approaches by
proposing a more flexible methodology that integrates
diverse discretization techniques, sensor types, and
path optimization strategies.
The precise spatial discretization using the Mesh-
ing algorithm ensures comprehensive coverage of the
global RoI, while the K-means clustering method en-
ables balanced task allocation, contributing to colli-
sion avoidance and optimized path planning. The fi-
nal optimization phase formulates the problem as a
TSP, solved using an enhanced GA with modifica-
tions that significantly accelerate convergence. These
improvements lead to more efficient path planning,
reduced energy consumption, and overall enhanced
UAV performance, as demonstrated by the simulation
results.
While the proposed method improves UAV path
planning, several limitations remain. Scalability is-
sues may arise with larger UAV fleets due to the com-
putational cost of GA optimization. The approach
also assumes a static environment, lacking adapt-
ability to dynamic obstacles, and does not explicitly
account for UAV constraints, communication limits,
or collision avoidance. To overcome these limita-
tions, future work will focus on adaptive clustering for
improved task allocation and coordination, real-time
obstacle avoidance using Rapidly-exploring Random
Tree (RRT) and RRT*, and trajectory generation to
refine UAV motion planning before real-world de-
ployment.
REFERENCES
Azp
´
urua, H., Freitas, G. M., Macharet, D. G., and Campos,
M. F. (2018). Multi-robot coverage path planning us-
ing hexagonal segmentation for geophysical surveys.
Robotica, 36(8):1144–1166.
Balampanis, F., Maza, I., and Ollero, A. (2017). Coastal
areas division and coverage with multiple uavs for re-
mote sensing. Sensors, 17(4):808.
Bouras, A., Bouzid, Y., and Guiatni, M. (2019). Multi-uavs
coverage path planning. In International Conference
on Electrical Engineering and Control Applications,
pages 23–36. Springer.
Bouras, A., Bouzid, Y., and Guiatni, M. (2022). Multi-uav
coverage path planning for gas distribution map appli-
cations. Unmanned Systems, 10(03):289–306.
Cabreira, T. M., Brisolara, L. B., and Paulo R, F. J. (2019).
Survey on coverage path planning with unmanned
aerial vehicles. Drones, 3(1):4.
Chen, Y., Mou, Z., Lin, B., Zhang, T., and Gao, F. (2024).
Complete coverage path planning for data collection
with multiple uavs. In 2024 IEEE Wireless Commu-
nications and Networking Conference (WCNC), pages
01–06. IEEE.
Choset, H. (2001). Coverage for robotics–a survey of recent
results. Annals of mathematics and artificial intelli-
gence, 31:113–126.
Du, Q., Faber, V., and Gunzburger, M. (1999). Centroidal
voronoi tessellations: Applications and algorithms.
SIAM review, 41(4):637–676.
Gao, C., Kou, Y., Li, Z., Xu, A., Li, Y., and Chang, Y.
(2018). Optimal multirobot coverage path planning:
Ideal-shaped spanning tree. Mathematical Problems
in Engineering, 2018(1):3436429.
Kapoutsis, A. C., Chatzichristofis, S. A., and Kosmatopou-
los, E. B. (2017). Darp: Divide areas algorithm for
optimal multi-robot coverage path planning. Journal
of Intelligent & Robotic Systems, 86:663–680.
Kumar, K. and Kumar, N. (2023). Region coverage-aware
path planning for unmanned aerial vehicles: A sys-
tematic review. Physical Communication, 59:102073.
Pham, T. H., Bestaoui, Y., and Mammar, S. (2017). Aerial
robot coverage path planning approach with concave
obstacles in precision agriculture. In 2017 Work-
shop on Research, Education and Development of
Unmanned Aerial Systems (RED-UAS), pages 43–48.
IEEE.
Yu, Y. and Lee, S. (2024). Multi-uav coverage path as-
signment algorithm considering flight time and energy
consumption. IEEE Access, 12:26150–26162.
Coverage Path Planning Using a Group of UAVs
165
