
The Effects of Digital Twins Development on System’s Long-Term
Performance, Potential Capabilities, and Possible Benefits
Ahmed Habib
a
and Michael W. Grenn
Department of Engineering Management and Systems Engineering,
The George Washington University, Washington, District of Columbia, U.S.A.
Keywords:
Digital Twin, Systems Architecture, Hastings-Metropolis, Markov-Chain, Monte-Carlo Algorithm, Systems
Engineering.
Abstract:
Practitioners who are working in Digital Engineering applications and especially the applications involving
Digital Twins are concerned with maintaining the twinning state between the cyber and physical entities
throughout the system’s life cycle. Although this level of granularity during the operation mode is required
to maintain the state of the Digital Twin, in many cases, it negatively impacts the emergent behavior of the
system in the long run. This effort explores the benefits of the architecture interfaces of the system, assuming
the preservation of the twinning state, to uncover the convergence of the latent system in behavior which can
offer insights to systems engineers and decision makers to guide current twinning arrangements toward the
desired system behavior in the long run. The effort will explore Hastings-Metropolis, Markov-Chain, Monte-
Carlo Algorithm at interface sampling level and discuss the expansion potential beyond systems’ interfaces
architecture through empirical analysis example and discussing future research potentials.
1 INTRODUCTION
In recent years, Digital Twins (DT) have grown in
popularity among researchers and practitioners who
operate in domains such as digital engineering, sys-
tems engineering, and Cyber-Physical Systems (CPS)
(Zhang et al., 2022; Rathore et al., 2021). The lit-
erature exhibits many examples of the potential of
DTs and the integration possibility that covers a wide
range of applications (Zhang et al., 2022; Peladarinos
et al., 2023), together with instances of direct imple-
mentation in production (Lauer-Schmaltz et al., 2024;
Othman and Yang, 2023). Industries started to pay at-
tention to the importance of DTs. For instance, the
International Council on Systems Engineering (IN-
COSE) has added in its 2035 vision the goals for
integrating DTs into the discipline of Systems Engi-
neering (INCOSE, 2023). Other types of authorita-
tive bodies started initiatives, policies that encourage
the development and implementation of digital prac-
tices in various aspects of their entities, like the Dig-
ital Platform Commission Act of 2023 in the United
States, new GDPR-like regulations state-level, such
as the California Privacy Rights Act and the Utah
Consumer Privacy Act, and the Cybersecurity Law of
a
https://orcid.org/0000-0002-0504-7698
the People’s Republic of China, to name a few (Pfeif-
fer et al., 2024; DoD, 2023).
The broad potential utility that DT technology can
bring to a wide range of applications drew the at-
tention of policy makers and recognized its impor-
tance, where many policy artifacts and instructions
were made to guide the evolution of DTs (DoD, 2023;
Sch
¨
oppenthau et al., 2023; Pfeiffer et al., 2024).
At the industry level, authoritative bodies re-
sponded positively to the calls of governments and
policy makers and began to embed into their abroad
guides, procedures, standards, and visions the impor-
tance of DTs to insight the relative communities or re-
search and practice of the importance of DTs (Rocha-
j
´
acome et al., 2021; Fraga-Lamas et al., 2022; IN-
COSE, 2023).
As a consequence, there is an increase in activity
in the research and development of DTs across many
domains (Fuller et al., 2020; Lauer-Schmaltz et al.,
2024).
1.1 Brief Background of DTs
The literature offers many definitions for DTs, for in-
stance, (Barbie and Hasselbring, 2024) shared a col-
lection of definitions for DTs and its internal com-
300
Habib, A. and Grenn, M. W.
The Effects of Digital Twins Development on System’s Long-Term Performance, Potential Capabilities, and Possible Benefits.
DOI: 10.5220/0013406300003929
In Proceedings of the 27th International Conference on Enterprise Information Systems (ICEIS 2025) - Volume 2, pages 300-307
ISBN: 978-989-758-749-8; ISSN: 2184-4992
Copyright © 2025 by Paper published under CC license (CC BY-NC-ND 4.0)

ponents in their literature review; however, the au-
thors desired to focus on definitions that hinges on
the twinning state for its relevance to this work: ”... A
change in state of the physical object directly leads
to a change in state of the digital object and vice
versa.” (Kritzinger et al., 2018) From the definition
above, realizing and sustaining the state of DT is a
difficult task, due to the nature of dynamic systems
overtime, especially with cases in which the systems
are complex, have human-input dependency (non-
automated processes and triggers), or may have un-
certain components due to the nature of reality. The
difficult task of maintaining the twinning state of the
DT may force engineers to lose focus on appreciat-
ing the long-term operations, or system’s emergent
behaviors (Saad et al., 2020).
1.2 Possible Challenges
DT environments can be described as heterogeneous
systems, as in many cases, being connected to other
elements, systems, and networks. It’s important for
DT designers to gain a deeper understanding of the
environment and how the systems may interact with
its environment (Fuller et al., 2020). The understand-
ing should be extended to cover the human-aspect,
connected systems, and even the enterprise environ-
ment.
There are many instances in the literature where
DT designers were able to develop and integrate DTs
into systems or applications; however, the focus in
the bulk of the work was on establishing the DT as
the product, that is, prioritizing the immediate com-
pliance of the system to maintain the DT state (Saad
et al., 2020). Rightfully so, establishing and maintain-
ing the twinning state is a very important aspect and
shouldn’t be neglected; nevertheless, this may cause
the designers to overlook the long-running behavior
of the system. For those reasons, this paper is set to
address two main questions:
(1) What is the percentage of time spent at a system’s
interfaces for a DT given its architecture interface
network?
(2) Given the architecture interfaces of a DT system,
what is the percentage of resources utilized by the
system in the long-run?
This effort attempts to address posed questions by
introducing the Hastings-Metropolis, Markov-Chain,
Monte-Carlo (Hastings-Metropolis MCMC) Algo-
rithm (Ross, 2013), a technique widely used in the
Discrete-Events Simulations field.
Paper Organization: Section 2 provides general
background information on the proposed methodol-
ogy. Sections 3 provide a simple numerical example
that motivates the methodology. Section 4 communi-
cates the findings, offer a brief discussion followed by
communicating possible limitations. Section 5 Con-
vey the conclusions of the paper and highlight propo-
sitions for future work.
2 METHODOLOGY
2.1 Uncovering Latent Behaviors of
Systems
The main motivation from this work is to encourage
practitioners and researchers to expand the scope of
the desired outcomes beyond the conventional imple-
mentation of DT’s, and to include the long-term per-
formance of the system that may uncover inefficien-
cies. The idea is that if DTs were developed and de-
ployed, there is a need to learn how the system will
behave beyond the immediate concerns of maintain-
ing the twinning state and to extend the learning to
cover the systems resources and organizational plan-
ning. There are cases where the DT is developed and
deployed, and gaining insights about the system’s per-
formance is a matter of analyzing the historical data,
logs , and system’s artifacts over an extended period
of time; however, making changes to the system at
that latent state is costly. The purpose is to learn as
much as possible about the system at an earlier stage
in development.
2.2 Hastings-Metropolis MCMC
Algorithm
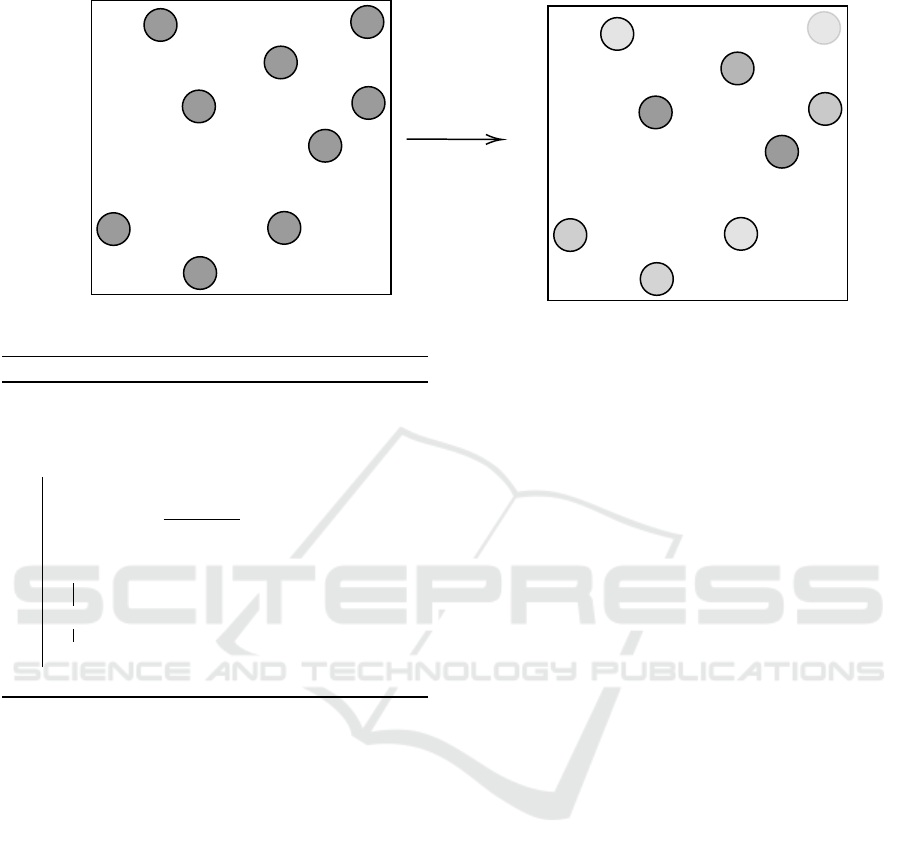
Consider the system interface architecture diagram
illustrated in Figure 1 (left), where the upper trian-
gular matrix represents the feedforward interfaces,
the lower triangular matrix represents the feedback
interfaces, and the diagonal entries represent the
self-loop interfaces, if any. The interfaces represent
the flow of information, or messages, etc., from a
component in the system to another corresponding
component, column and row labels. The interfaces in
Figure 1 are represented in a gray circular shape.
Assumption 1. Digital Twins implementation in
the system existed in this work.
Starting with expressing the Hastings-Metropolis
MCMC Algorithm, in terms of a pseudocode rep-
resented in Algorithm 1, motivated by a conceptual
example, then walk through the requirements, con-
straints, and comment on the process.
The Effects of Digital Twins Development on System’s Long-Term Performance, Potential Capabilities, and Possible Benefits
301
G
F
E
D
C
B
A
GFEDCBA
G
F
E
D
C
B
A
GFEDCBA
Figure 1: Abstract adjacency matrix represents system’s interfaces, pre-processing (left), post-processing (right).
Algorithm 1: Hastings-Metropolis, MCMC Algorithm.
Data: P,π,q(x), T
Result: π
T
initialization: x
0
,t
1
;
for t = 1 to T do
Sample x
′
∼ q(x
′
|x
t
);
α = min
Ä
1,
π(x
′
)q(x
t
|x
′
)
π(x
t
)q(x
′
|x
t
)
ä
;
Sample u ∼ U(0, 1);
if u < α then
x
t+1
← x
′
;
else
x
t+1
← x
t
end
end
where: P the adjacency matrix, π(x) the target dis-
tribution, q(x) proposal distribution (user defined), T
the maximum number of iterations, and α is the ac-
ceptance ratio. In addition:
• P, π ∈ R
(N×N)
,
P
i, j
,π
i, j
= P
j,i
,π
j,i
,
dim(P) = dim (π) ;
• t ∈ T,T = {t : t ∈ 1 ≤ T }, ∀t,T ∈ N
+
.
The matrix P needs to conform to Markov-Chain Er-
godic requirements (Ross, 2013), where:
• p
i j
= (t) > 0 ⇒ t = ×k (Aperiodic), k ∈ T being
the period count;
• π
i
P
i, j
= π
j
P
j,i
(Irreducible), π the steady-state of
the system;
•
∑
n
p
ii
(n) = ∞ (Recurrent).
The process starts with sampling from the adja-
cency matrix P
x
0
at time t
1
subject to the sampling
from the user-supplied target distribution q(x), the ra-
tio of the sample from q(x
′
) in the next state over the
sample from the previous state q(x), i.e. the Bayesian
posterior, being compared with the value of 1, that
value α is the acceptance/rejection criteria, which is
part of the Hastings-Metropolis part of the algorithm .
Taking the minimum value to be assigned to the vari-
able of α. The next step in the process is to draw a
sample u from a Uniform distribution U(0,1). If the
sample u is less than the acceptance ratio α, then ad-
vance the clock, t, and the next state will get x
′
; other-
wise, advance the clock and the next state will get x,
that is, the next state will carry the value of the current
state. The process will continue until it reaches the
maximum number of iterations, T , which is a value
provided by the user.
In terms of the overall performance of Algorithm
1, since Markov-Chains are being implemented, the
process is considered memory-less, that is, the fu-
ture is independent of the past, given the present.
This property can be beneficial in reducing the space-
complexity, where the main information is stored in P
while updating the values in π when iterating through
t. In terms of time-complexity for the algorithm, the
Monte-Carlo aspect of the algorithm will be the main
contributor with estimation of O(1/n) (Ross, 2013).
At t = T , the algorithm will stop and the steady-
state π matrix is reached as illustrated in Figure 1,
post-processing (right). The difference in gradient of
the gray-color represents the tendency of the archi-
tecture interfaces to be utilized by the system in the
long-run. The next section will implement the algo-
rithm using a simplified example.
3 EVALUATION
To demonstrate the proposed methodology expressed
in Section 2, a small sample was collected from a
network that represents the topology of the Western
States Power Grid of the United States (Watts and
ICEIS 2025 - 27th International Conference on Enterprise Information Systems
302
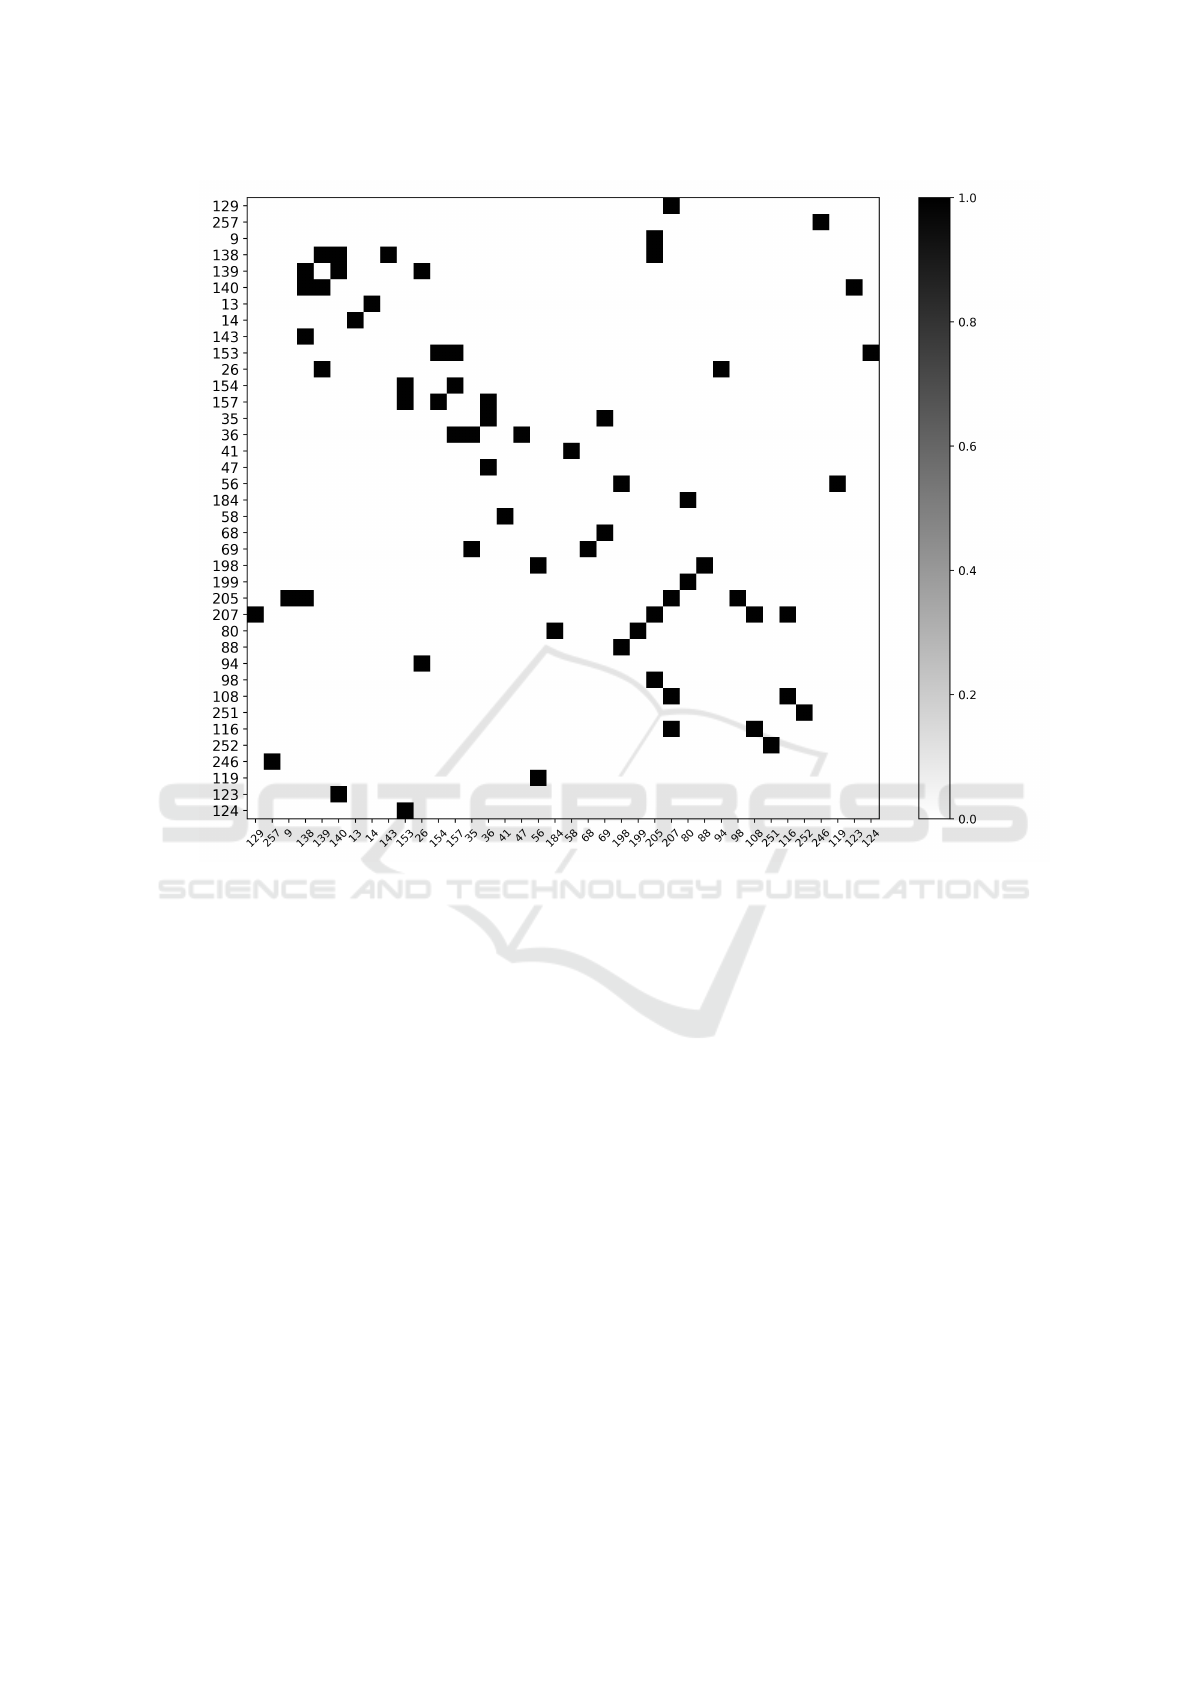
Figure 2: Adjacency matrix represents system’s interfaces, pre-processing. where, system labels represents the index in the
data set.
Strogatz, 1998). The sample size is 38 nodes out
of 4, 940 nodes from the original data set, undirected
and unweighted. The graphical representation illus-
trated in Figure 2. The selection of the interfaces was
based on Markov-Chain ergodic requirements listed
in Section 2. The number of iterations used was set
to T = 50000. For reproducibility, the labeling of the
selected nodes carries the indices of the node from the
original data set. Figure 2, is the visual illustration of
the selected data, where the black squares represent an
interface between two nodes, 0 for white otherwise.
Applying Algorithm 1, on the selected adjacency
matrix data illustrated in Figure 2, along with the
mentioned specifications, the output can be seen in
Figure 3.
4 DISCUSSION
4.1 Analysis of Systems Behavior
Applying the methodology specified in Section 2, en-
gineers can have a preview of how the system may be-
have in the long-run. From Figure 2, the darker gray
color the interface is, the more time is being spent
at. This observation answers the first posed question
(1), in other words, which interface is more impor-
tant? The gained knowledge is useful in many cases
if the system, or components of it, are being hosted
in the cloud. By learning which interface the system
would spend most of the time on, infrastructure and
resources provisioning can be made to accommodate
for such expected activity, hence, identifying the sys-
tem’s architecture flow bottlenecks. Other potential
benefits such as by increasing the learning about the
most used interfaces will better inform the process of
failure mode analysis, and reliability analysis to name
a few.
The Effects of Digital Twins Development on System’s Long-Term Performance, Potential Capabilities, and Possible Benefits
303
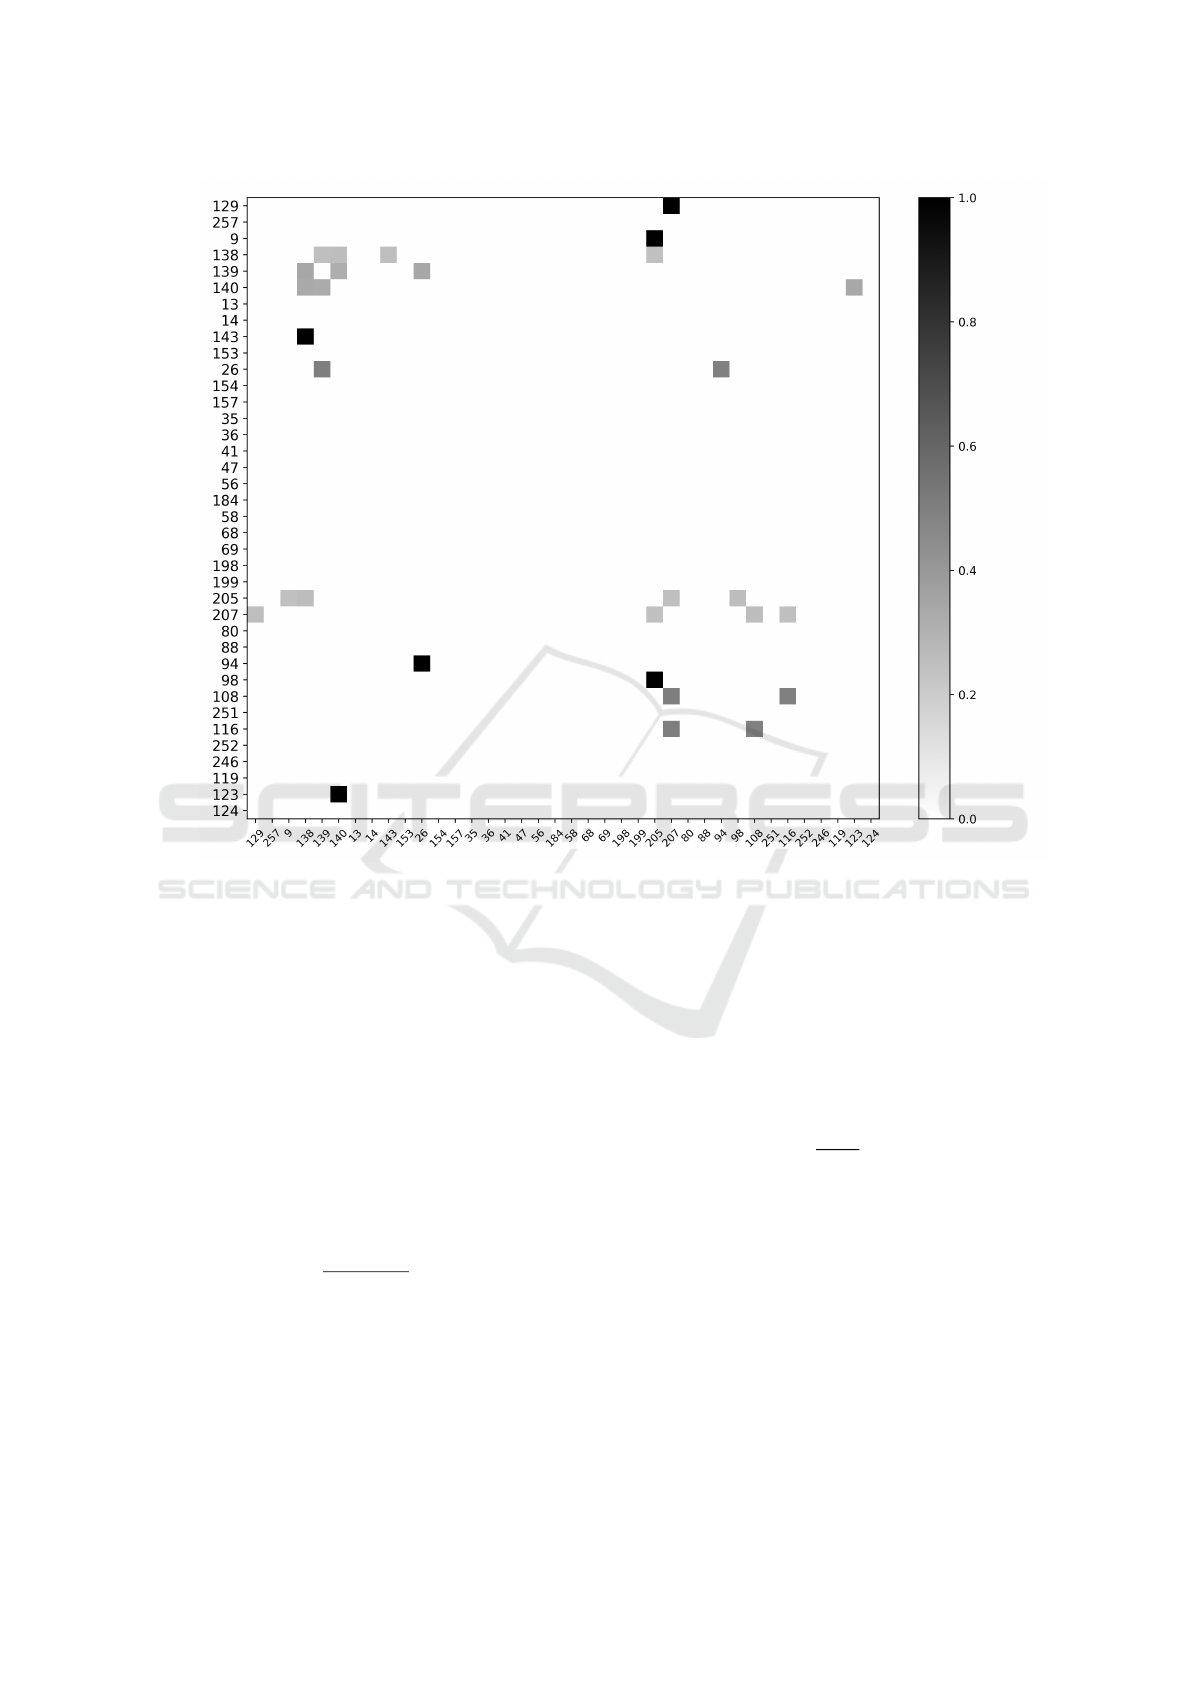
Figure 3: Adjacency matrix represents system’s interfaces, post-processing. where, system labels represents the index in the
data set.
4.2 Potential System Utilization
The other way that increases the learning about the
proposed DT architecture is that Algorithm 1 helps
uncovering the expected utilization at element-level,
over the long-run. Figure 4 (bottom), underscores the
nodes, elements, and their relative utilization with re-
spect to the entire system. To deliver a relative com-
parison between the pre-process and post-process,
the authors sought to compute the percentage degree
against percentage state-frequency.
Figure 4 (top) represents the node degrees of the
adjacency matrix, computed by:
PD
x
i
=
π(x
i
)
∑
N
j=1
π(x
j
)
× 100 (1)
where (1) represents the Percentage Degree, PD, that
communicates the degree π(x
i
) = deg(x
i
) relative to
the total degree of all nodes N, the denominator.
The graphical output for (1) is illustrated in Figure 4
(top). To produce Figure 4 (bottom), the following
was used:
V (x
i
) =
T
∑
i=1
1
x
t
=x
i
x
i
(2)
where V (x
i
) is the number of visits to state x
i
, T is
the total number of iterations, x
t
, the state of Markov-
Chain at time t, 1
x
t
=x
i
an indicator function that
equates to 1 if x
t
= x
i
; 0, otherwise. Applying (2)
into (3):
f (x
i
) =
V (x
i
)
T
× 100 (3)
where f (x
i
) is the state frequency, which was used
in producing Figure 4 (bottom). The visual examina-
tion of Figure 4 can help DT designers to gain under-
standing on how system’s internal components may
behave. Components with labels 138, 205, and 207
are in agreement in terms of the most percentage in
both cases; however, components 139 and 140 are the
second highest percentage in terms of state-frequency
analysis and clearly was not the case when compared
with its counterpart in the percentage degree analy-
sis. The information gained from Figure 4 helped in
addressing the question posed in 1.2.
ICEIS 2025 - 27th International Conference on Enterprise Information Systems
304

To optimize key variables such as cost, availabil-
ity, and organizational efficiency, this methodology
provides valuable insights into the utilization of the
human component within the system beyond the DT.
For instance, as shown in Figure 4 (bottom), it is
recommended to analyze system elements based on
their relative percentage utilization against available
resources, mainly when human interaction with DTs
is a critical to the process. This method aims to deter-
mine whether the relative state-frequencies of com-
ponent utilization are feasible given the dedicated hu-
man resources for the tasks. For example, the state-
frequency percentages of elements 138, 205, and 207
(Figure 4, bottom) ought to be compared to the cor-
responding human resources assigned to handle asso-
ciated tasks. On the other hand, elements 153, 157,
and 36 show high percentage utilization yet low state-
frequency, signifying a different trend worth inves-
tigating. In both cases, DT designers can leverage
this analysis to evaluate other system’s aspects. This
analysis could also support organizational talent ac-
quisition by empowering planning for better talent
alignment and determining the appropriate quantity
of personnel required for the system given DT im-
plementation. Additionally, this method extends be-
yond the human aspect to any process or sub-process
influenced by delays or queue dependencies. For in-
stance, elements 138, 205, and 207 may warrant re-
view for potentially low usage frequency, which could
indicate underutilized human resources dedicated to
those tasks. Implementing DTs into existed organi-
zations may warrant decision makers to rethink how
organizations can accommodate DTs.
4.3 As-Is vs. To-Be DT Architecture
Based on the analysis presented in Sections 4.1
and 4.2, the next logical step for DT architects is to
consider whether the proposed system interface archi-
tecture is in alignment with the expected performance.
This question prompts DT architects to evaluate the
system’s feasibility in delivering the desired capabili-
ties over the long-run. Additionally, it encourages the
consideration of specific objectives the system must
achieve within the system’s lifecycle to arrive at the
To-Be architecture. This methodology serves as a
valuable tool to support DT designers during the early
stages of DT development.
4.4 Challenges and Possible Limitations
The purpose of selecting a sample for the numerical
implementation with symmetry in the interfaces from
the dataset is to conform to Markov-Chain ergodic re-
quirements; however, in reality many systems do not
enjoy such conditions. Many interface networks have
self-directing edges, e.g., going from node A to node
A, which implies a perfect correlation in this edge
case.
Many interface network architectures have associ-
ated weights, and in many cases, those weights are not
balanced, which may need designer’s interventions to
allow the sampling in the next iteration to be less re-
stricted.
Other cases where networks by design are gov-
erned by processes that require events to not be re-
current, for instance, the case of user-to-platform ac-
cess with the event of user inputting incorrect access
credentials like wrong password or username. The
access to the system’s network must be denied, and
only interfaces that are involved with this activity are
needed. What the authors are trying to communicate
is that the Hastings-Metropolis MCMC algorithm is a
powerful tool, and its utility was demonstrated in this
section and there is a potential to investigate ways to
overcome the mentioned limitations.
5 CONCLUSIONS
In this paper, we introduced the Hasting-Metropolis
MCMC algorithm and showed how to apply it on an
interface architecture matrix for a DT system. Then
followed by an empirical analysis to answer the two
main posed questions stated in Section 1. Gained in-
sights from the analysis and expanded on how it can
help with enhancing the understanding of the system.
Followed by a discussion about the attributes and pos-
sible limitations of the method. The objective of this
work is to encourage DT architects to think outside
the scope of the implementations of systems and of-
fer a valuable tool to learn about the design and how
it may behave in the long-run.
5.1 Future Research Outlook
The results are promising and calls for further re-
search to enhance the algorithm’s inclusivity, en-
abling it to address a wider range of complex applica-
tions, as briefly discussed in Section 4.4. Moreover,
there are instances in the literature advocating for the
expansion of DTs to operate at higher levels of ab-
straction.
For instance, there is a proposition of the DT-
base Automation Pyramid (AP) model for a complete
company application. They require that all AP levels
must be integrated with the DT, in an attempt to gain
improvements at manufacturing system as illustrated
The Effects of Digital Twins Development on System’s Long-Term Performance, Potential Capabilities, and Possible Benefits
305
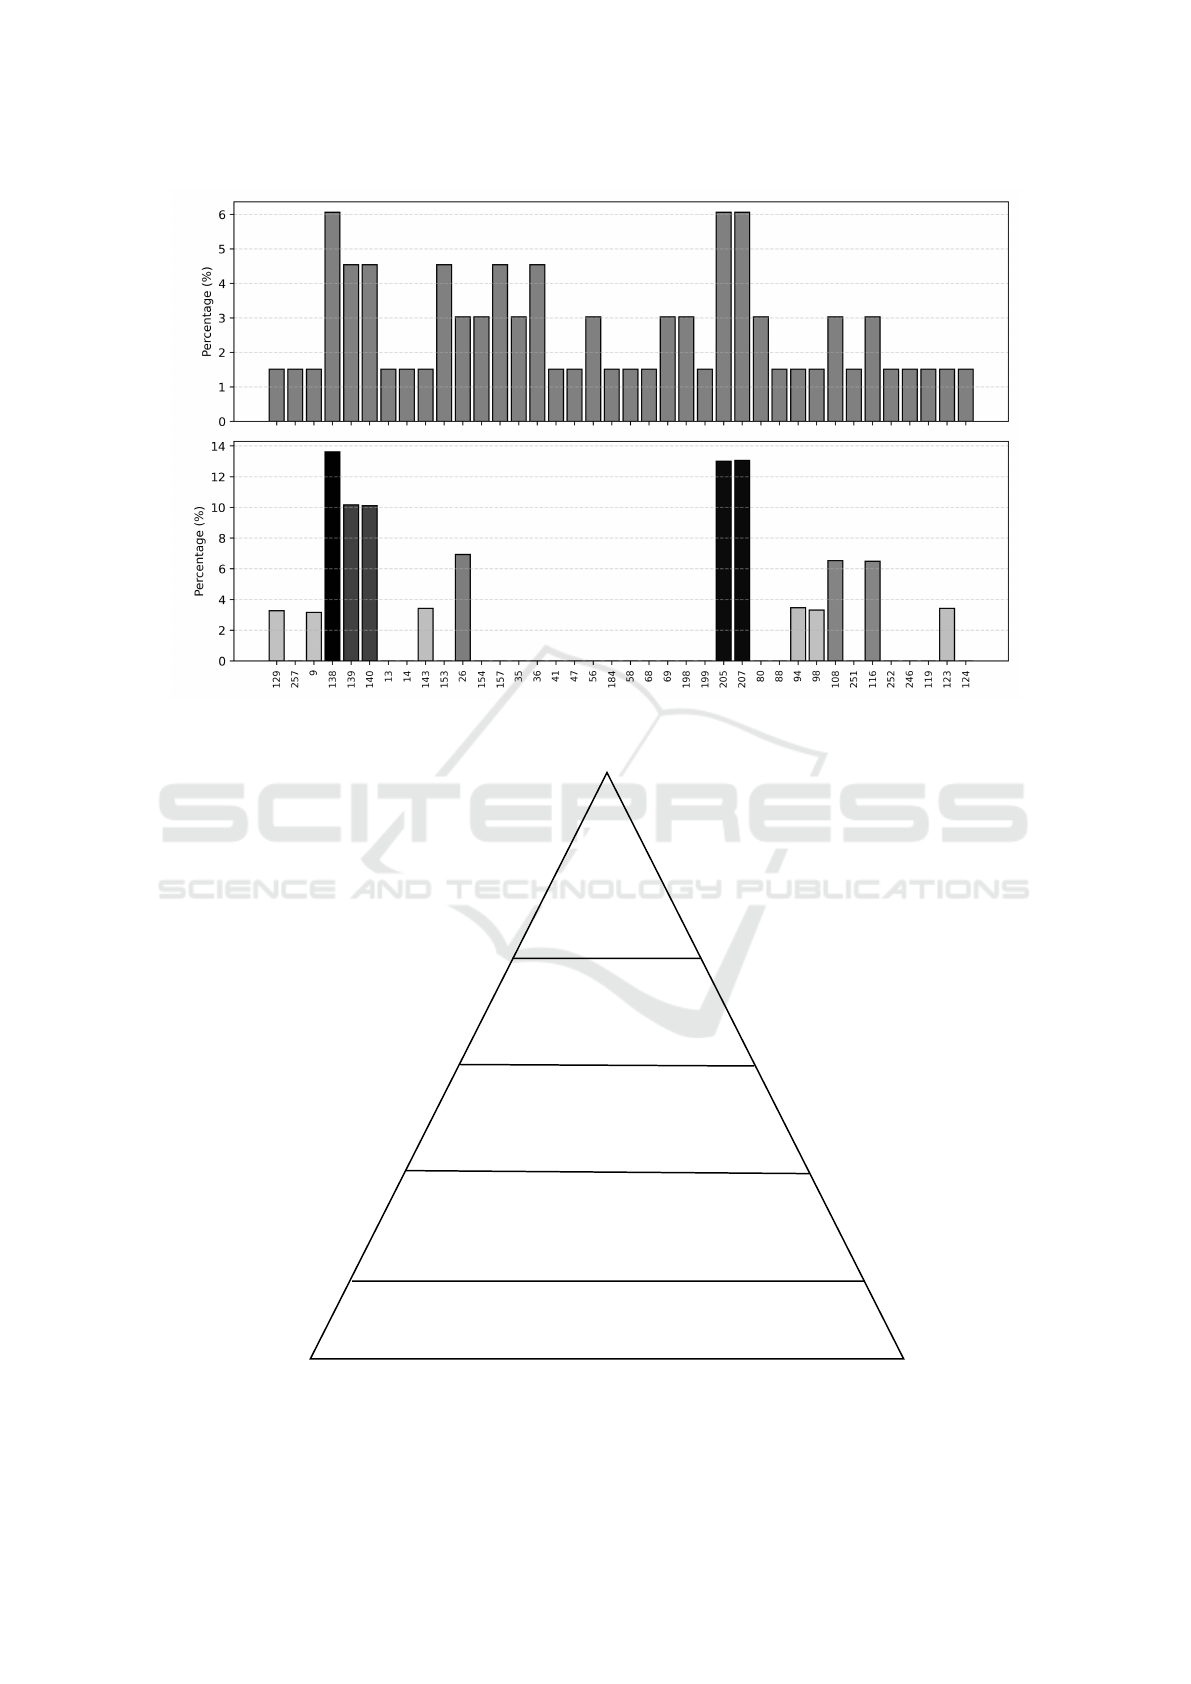
Figure 4: System’s percentage degree analysis in a comparative evaluation, pre-processing (Top), System’s percentage state-
frequency analysis, post-processing (Bottom).
PLCs
SCADA, HMI
MES
ERP
Management Level
Planning Level
Supervisory Level
Control Level
Field Level
Level 4:
Business &
Logistics
Level 3: Manufacturing
Operation Planning
Level 2: Monitoring &
Supervising
Machinery,
Sensors, etc.
Level 1: Sensing & Manipulating the
Production Process
Level 0: Physical Production Process
Figure 5: Automation Pyramid Drivers, adopted from ANSI/ISA 95 Standard.
ICEIS 2025 - 27th International Conference on Enterprise Information Systems
306

on Figure 5, (Martinez et al., 2021). The proposed
settings were adopted by the authors from standard
ANSI/ISA 95, the logical placement of DTs can be
found at the Control level, i.e., Level 1 where Sensing
and manipulating the product process.
There is another approach that can be used in as-
sessing DT systems, inspired by the work of (Wei
et al., 2024). They offered a guideline for the
construction of a multi-domain, and multi-level ST
model. The proposition is more like a reference ar-
chitecture which is composed of hierarchical multi-
model constructs such as part, component, assembly
unit, and system equipment models, and within there
are additional models at the subsystem level. Explor-
ing the application of Hastings-Metropolis MCMC
Algorithm on the domain-level, and at the model-
level can be a future research venue.
REFERENCES
Barbie, A. and Hasselbring, W. (2024). From digital twins
to digital twin prototypes: Concepts, formalization,
and applications. IEEE access, 12:75337–75365.
DoD (2023). Dod instruction 5000.97 digital engineering.
Fraga-Lamas, P., Barros, D., Lopes, S. I., and Fern
´
andez-
Caram
´
es, T. M. (2022). Mist and edge computing
cyber-physical human-centered systems for industry
5.0: A cost-effective iot thermal imaging safety sys-
tem. Sensors (Basel, Switzerland), 22(21):8500–.
Fuller, A., Fan, Z., Day, C., and Barlow, C. (2020). Digi-
tal twin: Enabling technologies, challenges and open
research. IEEE access, 8:108952–108971.
INCOSE (2023). INCOSE Systems Engineering Handbook,
5th Edition. Wiley.
Kritzinger, W., Karner, M., Traar, G., Henjes, J., and Sihn,
W. (2018). Digital twin in manufacturing: A cat-
egorical literature review and classification. IFAC-
PapersOnLine, 51(11):1016–1022. 16th IFAC Sym-
posium on Information Control Problems in Manufac-
turing INCOM 2018.
Lauer-Schmaltz, M. W., Cash, P., and Rivera, D. G. T.
(2024). Ethica: Designing human digital twins-a sys-
tematic review and proposed methodology. IEEE ac-
cess, 12:86947–86973.
Martinez, E. M., Ponce, P., Macias, I., and Molina, A.
(2021). Automation pyramid as constructor for a
complete digital twin, case study: A didactic man-
ufacturing system. Sensors (Basel, Switzerland),
21(14):4656–.
Othman, U. and Yang, E. (2023). Human–robot collab-
orations in smart manufacturing environments: Re-
view and outlook. Sensors (Basel, Switzerland),
23(12):5663–.
Peladarinos, N., Piromalis, D., Cheimaras, V., Tserepas,
E., Munteanu, R. A., and Papageorgas, P. (2023).
Enhancing smart agriculture by implementing digi-
tal twins: A comprehensive review. Sensors (Basel,
Switzerland), 23(16):7128–.
Pfeiffer, J., Lachenmaier, J. F., Hinz, O., and van der Aalst,
W. (2024). New laws and regulation: Opportunities
for bise research. Business & information systems en-
gineering.
Rathore, M. M., Shah, S. A., Shukla, D., Bentafat, E., and
Bakiras, S. (2021). The role of ai, machine learning,
and big data in digital twinning: A systematic litera-
ture review, challenges, and opportunities. IEEE ac-
cess, 9:32030–32052.
Rocha-j
´
acome, C., Carvajal, R. G., Chavero, F. M.,
Guevara-cabezas, E., and Fort, E. H. (2021). Indus-
try 4.0: A proposal of paradigm organization schemes
from a systematic literature review. Sensors (Basel,
Switzerland), 22(1):66–.
Ross, S. M. (2013). Simulation (5th Edition). Elsevier, San
Diego, fifth edition. edition.
Saad, A., Faddel, S., and Mohammed, O. (2020). Iot-based
digital twin for energy cyber-physical systems: design
and implementation. Energies (Basel), 13(18):4762–.
Sch
¨
oppenthau, F., Patzer, F., Schnebel, B., Watson, K.,
Baryschnikov, N., Obst, B., Chauhan, Y., Kaever, D.,
Usl
¨
ander, T., and Kulkarni, P. (2023). Building a digi-
tal manufacturing as a service ecosystem for catena-x.
Sensors (Basel, Switzerland), 23(17):7396–.
Watts, D. J. and Strogatz, S. H. (1998). Collective dy-
namics of ’small-world’ networks. Nature (London),
393(6684):440–442.
Wei, Y., Hu, T., Yue, P., Luo, W., and Ma, S. (2024).
Study on the construction theory of digital twin mech-
anism model for mechatronics equipment. Interna-
tional journal of advanced manufacturing technology,
131(11):5383–5401.
Zhang, R., Wang, F., Cai, J., Wang, Y., Guo, H., and Zheng,
J. (2022). Digital twin and its applications: A sur-
vey. International journal of advanced manufacturing
technology, 123(11-12):4123–4136.
The Effects of Digital Twins Development on System’s Long-Term Performance, Potential Capabilities, and Possible Benefits
307
