
Exploring Efficiency of Machine Learning in Profiling of Internet of
Things Devices for Malicious Activity Detection
Daniil Legkodymov
1 a
and Dmitry Levshun
2 b
1
Bonch-Bruevich St. Petersburg State University of Telecommunications,
Bolshevikov prospect 22, 193232, St. Petersburg, Russia
2
St. Petersburg Federal Research Center of the Russian Academy of Sciences,
14th Line V.O. 39, 199178, St. Petersburg, Russia
Keywords:
Information Security, Internet of Things, Device Profiling, Artifical Intelligence, Machine Learning, Network
Security, Attack Detection, Anomaly Detection.
Abstract:
Security of Internet of Things devices is becoming an increasingly important task. The number of devices
connected to the network is constantly growing, as is the threat of cyberattacks. One of the key solutions
for this issue is profiling of such devices to improve the protection of systems they are used in. This work
presents an approach for profiling of Internet of Things devices to detect malicious activity. Using machine
learning, this approach allows identifying network events that may indicate cyberattacks. We describe all the
main steps of the developed approach, including the processes of collecting and preprocessing data, selecting
and training models, as well as testing and evaluating the effectiveness of the proposed solution. The results
obtained demonstrate the applicability of our solution to ensure the security of systems with Internet of Things
devices, as well as to reduce the security risks associated with such devices.
1 INTRODUCTION
Internet of Things (IoT) is actively developing, and
the number of connected devices is increasing daily,
creating new opportunities to improve comfort and
efficiency in various areas of vital activity (Levshun
et al., 2019). According to experts, by 2025, the num-
ber of IoT devices will exceed 30 000 million (Eric-
sson, 2024). At the same time, the risks associated
with cyberthreats are also increasing. IoT devices are
vulnerable to attacks due to limited resources, the va-
riety of device types, and the difficulty of updating
their software in a timely manner (Levshun et al.,
2018). To ensure the security of such devices, it
is necessary to develop new solutions that take into
account the features of IoT devices (Levshun et al.,
2017). One such approach is the use of profiling sys-
tems based on machine learning (ML) methods (Sli-
mane et al., 2024). Profiling in the context of this pa-
per is the process of selecting and preprocessing net-
work traffic of IoT devices to create a characteristic
behavioral profile, which is used to detect anomalies
and malicious activity using ML models.
a
https://orcid.org/0009-0002-2874-6632
b
https://orcid.org/0000-0003-1898-6624
The main drawback of existing solutions in IoT
device profiling is their focus on the task of device
type identification, while the task of malicious activ-
ity detection is not given enough attention. The main
contributions of the paper are as follows:
• We developed an approach for IoT devices pro-
filing. It works with the network activity of de-
vices and analyses their behavior with ML meth-
ods. The output of ML models is used to detect
anomalous behavior and detect cyberattacks.
• We improved and extended the CIC IoT 2022
dataset (Dadkhah et al., 2022). We parsed raw
PCAP files with benign and malicious scenarios
and added new features. Moreover, we used syn-
thetic data to solve the data imbalance issue for
the underrepresented classes of each device.
• We divided the detection task into two main parts
– anomaly and attack detection. The reconstruc-
tion models are trained only on benign network
traffic of each device (its normal behavior profile),
and are used to predict anomalies.
• The classification models for each device were in-
dividually trained in both benign and malicious
traffic (its overall behavior profile). Their task
276
Legkodymov, D. and Levshun, D.
Exploring Efficiency of Machine Learning in Profiling of Internet of Things Devices for Malicious Activity Detection.
DOI: 10.5220/0013389100003899
In Proceedings of the 11th International Conference on Information Systems Security and Privacy (ICISSP 2025) - Volume 2, pages 276-283
ISBN: 978-989-758-735-1; ISSN: 2184-4356
Copyright © 2025 by Paper published under CC license (CC BY-NC-ND 4.0)

is to classify what kind of benign (type of device
scenario) and malicious (type of the attack on de-
vice) behavior is represented by such traffic.
• In total, we created profiles of 26 IoT devices. For
each device, where malicious behavior traffic is
available, 1 reconstructor and 1 classifier were se-
lected based on the models’ efficiency analysis.
For other devices, only 1 classifier was selected.
• For each device, we compared the efficiency of
Random Forest (RF), XGBoost (XGB) and Cat-
Boost (CB) in the classification task, as well as
Isolation Forest (IF), Elliptic Envelope (EE) and
One Class Support Vector Machine (1-SVM) in
the reconstruction task.
These results are expected to be used to improve
the security of information systems with IoT devices.
In turn, it would allow for the reduction of the risks
associated with such cyberthreats, which determines
the practical significance of the work done.
The rest of the paper is organized as follows. In
Section 2 an analysis of existing works in the field of
IoT device profiling and security is provided. Sec-
tion 3 presents the proposed ML-based approach for
IoT devices profiling. The experimental evaluation
of the approach is presented in Section 4. Section 5
discusses the proposed approach and its results, pro-
viding additional insights on the efficiency of profil-
ing. Section 6 provides a brief conclusion on the work
done, outlining our future research plans.
2 RELATED WORK
According to the literature analysis, main research ar-
eas in the field of IoT devices profiling and security
include: application of ML methods to detect security
threats (Safi et al., 2022; Istiaque Ahmed et al., 2021);
profiling of devices in real-time (Safi et al., 2022);
improvement of authentication and access control
methods in IoT systems (Istiaque Ahmed et al.,
2021); ensuring privacy of IoT devices data (W
´
ojcicki
et al., 2022); application of the blockchain technol-
ogy (Safi et al., 2022); protection against distributed
denial of service (DDoS) and botnet attacks (Nguyen
et al., 2022); improvement of the security of de-
vices communication protocols and introduction of
new ones (Bansal and Priya, 2021). More precisely,
researchers solve the following tasks:
1. Device Type Identification – important to apply
appropriate security settings, for example, for a
camera and a temperature sensor.
2. Device Instance Identification – distinguishing
different instances is important for applying se-
curity mechanisms to a specific device.
3. New Device Detection – allows one to identify
new devices for which there are no data yet.
4. Anomalous Behavior Detection – applying behav-
ioral profiles of IoT devices to detect anomalies.
5. Attack Detection – applying behavioral profiles of
IoT devices to detect attacks (Rose et al., 2021;
Safi et al., 2021).
The field of IoT device profiling and security faces
a number of challenges:
• Device Diversity – it complicates the development
of unified security methods. Given the huge num-
ber of IoT devices, it is difficult to select the set
of features for their profiles (Safi et al., 2022;
Canavese et al., 2024; Slimane et al., 2024).
• Software Updates – IoT devices from small manu-
facturers usually have issues with regular software
updates, which entails the preservation of vulner-
abilities in their firmware (Safi et al., 2022).
• Training Data – collection of such data for pro-
filing should be carried out over a long period of
time. It creates multiple limitations for networks
where new devices are frequently connected (Sli-
mane et al., 2024).
• Dynamic Behavior of Devices – device updates
can lead to profiles becoming outdated (Safi et al.,
2022; Slimane et al., 2024).
• High Degree of Interconnectedness – devices in-
teract with each other and with other systems,
creating various dependencies (Canavese et al.,
2024).
• Limited Security Capabilities – IoT devices often
do not have basic security tools such as firewalls
or intrusion detection systems due to the limited
resources and scenarios of their use (Safi et al.,
2022; Canavese et al., 2024; Slimane et al., 2024).
Profiling and securing IoT devices is a complex
and multilayered task that requires consideration of
many factors. Modern approaches using ML show
high efficiency. However, in the field of ML-based
IoT security, there are still areas that require further
research and development.
3 PROPOSED APPROACH
In this Section, we present our approach for profil-
ing of IoT devices, which includes data collection
Exploring Efficiency of Machine Learning in Profiling of Internet of Things Devices for Malicious Activity Detection
277

Data collection
Capture traffic in
PCAP
Data preprocessing
Feature
extraction
Labeling Data formatting
Model training
Data
Splitting
Cross-validation
Hyperparameter
Optimization
Model
training
Model evaluation and testing
Performance
metrics
Confusion
matrix
Feature importance
rating
PCAP
CSV
Models
and CSV
Oversampling and
Undersampling
Figure 1: Approach for training of ML models for profiling of IoT devices.
and preprocessing, ML models training and evalua-
tion for anomaly detection and traffic classification.
The scheme of the approach is shown in Figure 1.
Stage 1. Data Collection. At this stage, the net-
work traffic of IoT devices is collected in the PCAP
format. This data provides a detailed view of the net-
work interaction. All packets transmitted through the
network are recorded, which allows one to get a com-
plete set of data on the network activity of devices.
Stage 2. Data Preprocessing. This stage consists
of four main steps – feature extraction, data format-
ting and labeling, and over- and under-sampling.
Step 2.1. Feature Extraction. During this step,
network traffic features are extracted from PCAP
files. At this step, we use original features from
the CIC IoT 2022 dataset and extended them with
the following 21 features: unique ip dst count and
unique ip src count – number of unique destination
and source IPs within the last 20 packets; L3 ip
– indicator for whether a packet uses the IP pro-
tocol; packet rate – the rate of packets transmitted
per second; number of servers – count of unique
server IPs among the last 20 packets; tcp window –
buffer size; tcp data offset – data offset; NTP, DNS,
is icmp, is eapol, wifi, and zigbee – boolean indi-
cators for the respective packet types; ntp interval,
dns interval – time between consecutive NTP and
DNS requests; icmp type, eapol type, wifi sub type,
and zigbee type: types of ICMP, EAPOL, Wi-Fi,
and ZigBee packets; tcp payload size – TCP payload
size; total length – total size of the packet, including
headers and data.
Step 2.2. Labeling. This step is devoted to assign-
ing labels to the data examples, indicating the device
name and the nature of the traffic (normal or mali-
cious). These labels are necessary for training and
evaluating ML models. The information for labeling
is taken from the original dataset.
Step 2.3. Data Formatting. In this step, the fea-
tures of the data examples and their labels are aggre-
gated and saved as CSV file. Each record contains a
full set of features, a device name label, and a traffic
type label. This format is convenient for subsequent
use in ML algorithms.
Step 2.4. Oversampling and Undersampling.
Those methods are used to balance the representa-
tion of the data classes. For the selected dataset,
we decided to increase the number of data exam-
ples in minority classes to 20000 using the ADASYN
method (Adaptive Synthetic Sampling). The number
of data examples in majority classes was decreased
using the RandomUnderSampler method: if the num-
ber of examples exceeded 400,000, it was reduced to
400,000; if more than 200,000 – to 200,000; if more
than 100,000 – to 100,000; if more than 75,000 – to
75,000; if more than 40,000 – to 40,000; classes with
the number of examples from 20,000 to 40,000 re-
mained unchanged. This approach allows one to par-
tially preserve the nature of the data, where some traf-
fic classes are more represented than others, while at
the same time reducing the gap between minor and
major classes, giving models the ability to identify
and detect them effectively.
Stage 3. Model Training. At this stage, arti-
ficial intelligence models are used. These models
are trained on the extracted features. The process
of model training consists of four main steps: sam-
ple formation, cross-validation, hyperparameter opti-
mization and direct model training.
Step 3.1. Data Splitting. This step starts with load-
ing data from the CSV files generated in the second
step. Separate models are created for each device,
which allows considering unique traffic characteris-
tics of each device individually.
Step 3.2. Cross-Validation. In this step, the dataset
is divided into several segments for cross-validation
(we used CV = 4). Specifically, 80% of the dataset
is split into training (60%) and validation (20%) sub-
sets, ensuring robust evaluation during model train-
ing, while 20% of the dataset is reserved for final test-
ing. This approach provides a reliable assessment of
models effectiveness and data homogeneity.
Step 3.3. Hyperparameter Optimization. Parame-
ters, such as the number of trees in RF or outliers in
ICISSP 2025 - 11th International Conference on Information Systems Security and Privacy
278

IF, are selected using the Random Search method.
Step 3.4. Model Training. In this step, the mod-
els are trained according to the best hyperparameter
values obtained in the previous step. In this case, the
following models are created for each device:
• Anomaly Detector is trained only on normal data
to identify abnormal device behavior based on its
differences from normal activity. For this task, we
tested IF, EE and 1-SVM.
• Attack Detector is used for traffic classification
and trained on labeled data to distinguish between
different scenarios of normal and abnormal be-
havior. For this task, we tested RF, XGB and CB.
Step 4. Model Evaluation and Testing. To evalu-
ate effectiveness of models, such metrics as accuracy,
recall, precision, and F-measure are used. In addi-
tion, classification reports and confusion matrices are
used to identify behavior scenarios, on which models
are underperforming, so it can be further analyzed by
the experts. To help the experts, we also use LIME
(Local Interpretable Model-agnostic Explanations) to
highlight the most important features.
4 EXPERIMENTAL EVALUATION
This section provides additional details on the dataset
used, obtained experimental results and their analysis.
4.1 Dataset
As was mentioned in Section 3, the improved version
of the CIC IoT 2022 dataset was used to profile IoT
devices and detect malicious activity. This dataset in-
cludes PCAP files containing records of attack traf-
fic on devices and normal device operation scenarios.
For this work, the data was balanced, as the original
dataset has a significant imbalance between normal
and abnormal traffic, see Table 2.
Balancing provides a better distribution of classes,
which helps to improve the quality of models and in-
crease their ability to distinguish between normal and
abnormal behavior in network traffic.
4.2 Setup
For each IoT device in the dataset, the performance of
six models was explored:
• Attack Detector: Random Forest (RF), XGBoost
(XGB) and CatBoost (CB);
• Anomaly Detector – Isolation Forest (IF), Ellip-
tic Envelope (EE) and One Class Support Vector
Machine (1-SVM).
The hyperparameters of all the models were opti-
mized using Random Search. The values of the ana-
lyzed hyperparameters are presented in Table 1.
Table 1: Analyzed values of models hyperparameters.
Model Parameter Values Description
IF n estimators 100, 200, 300, 400, 500 The number of base estimators in the ensemble.
max features 1.0, 0.9, 0.8, 0.7, 0.6, 0.5 The number of features to draw from X to train
each base estimator.
EE support fraction None, 0.1, 0.3, 0.5, 0.7, 0.9 The proportion of points to be included
in the support of the raw MCD estimate.
contamination 0.1, 0.2, 0.3, 0.4, 0.5 The amount of contamination of the data set.
1-SVM kernel linear, poly, rbf, sigmoid Specifies the kernel type to be used in the algorithm.
gamma scale, auto Kernel coefficient for rbf, poly and sigmoid.
nu 0.1, 0.2, 0.3, 0.4, 0.5 An upper bound on the fraction of training errors
and a lower bound of the fraction of support vectors.
RF n estimators 100, 200, 300, 400, 500 The number of trees in the forest.
criterion gini, entropy, log loss The function to measure the quality of a split.
max features sqrt, log2 The number of features to consider when looking
for the best split.
CB iterations 1000, 1500, 2000, 2500, 3000 Maximum number of trees.
learning rate 0.001, 0.03, 0.1 The learning rate.
grow policy SymmetricTree, Lossguide The tree growing policy.
XGB n estimators 100, 200, 300, 400, 500 Maximum number of trees.
learning rate 0.1, 0.01, 0.001 The learning rate.
booster gbtree, gblinear Which booster to use.
The hyperparameter optimization results show the
best parameter combinations for each model. We used
80% of data for training and validation and 20% for
testing. More details are provided in Section 3.
4.3 Results
The results obtained are presented in Table 4. Best
models are highlighted in bold. The anomaly detec-
tion task was done only for devices with attack traffic.
The metrics values are provided for the best hy-
perparameters of models, that were selected using F-
measure as a refit parameter. It can be noted that each
of the explored models showed the best performance
at least for one task of one device:
• Attack Detection: RF – 8, CB – 14, XGB – 4.
• Anomaly Detection: IF – 4, EE – 6, 1-SVM – 1.
Overall, the developed models have shown sig-
nificant potential, although further improvements and
testing remain necessary to adapt them to industrial
requirements. It is especially true for the anomaly de-
tection task, where it is should be possible to achieve
better results using deep learning (DL) models.
In our future experiments, we plan to explore the
efficiency of DL for the same task, with focus on those
models that are the best in network event forecasting
and anomaly detection in traffic.
5 DISCUSSION
For further investigation of the results obtained, we
considered one of the devices in more detail – Atomi
Coffee Maker. This device has 13 labeled scenarios,
3 of which are malicious, while other ones are repre-
senting normal activity (820005 traffic examples).
Exploring Efficiency of Machine Learning in Profiling of Internet of Things Devices for Malicious Activity Detection
279

Table 2: Description of the dataset used.
Device Scenarios
Examples
Total Percentage
Amazon Echo Dot LANVOLUMEOFF, LANVOLUMEON, LOCALVOLUMEOFF, LOCALVOLUMEON,
VOICEVOLUMEOFF, VOICEVOLUMEON, WANVOLUMEOFF, WANVOLUMEON
160000 1.6
Amazon Echo Spot LANVOLUMEOFF, LANVOLUMEON, LOCALVOLUMEOFF, LOCALVOLUMEON,
VOICEVOLUMEOFF, VOICEVOLUMEON, WANVOLUMEOFF, WANVOLUMEON
160000 1.6
Amazon Echo Studio LANVOLUMEOFF, LANVOLUMEON, LOCALVOLUMEOFF, LOCALVOLUMEON,
VOICEVOLUMEOFF, VOICEVOLUMEON, WANVOLUMEOFF, WANVOLUMEON
160000 1.6
Amazon Plug ALEXAOFF, ALEXAON, LANOFF, LANON, LOCALOFF, LOCALON,
WANOFF, WANON
160000 1.6
Amcrest Camera RTSP Brute Force Nmap, RTSP Brute Force Hydra, LANPHOTO,
LANRECORDING, LANWATCH
120003 1.2
Arlo Basestation Camera LANPHOTO, LANRECORDING, LANWATCH, WANPHOTO,
WANRECORDING,WANWATCH
120000 1.2
ArloQ Camera Flood
HTTP, Flood UDP, Flood TCP, LANPHOTO, LANRECORDING,
LANWATCH, WANPHOTO, WANRECORDING, WANWATCH
940006 9.4
Atomi Coffee Maker Flood UDP, Flood HTTP, Flood TCP, ALEXAOFF, ALEXAON, GOOGLEOFF,
GOOGLEON, LANOFF, LANON, LOCALOFF, LOCALON, WANOFF, WANON
820005 8.2
Borun Camera Flood UDP, LANPHOTO, LANRECORDING, LANWATCH, WANPHOTO,
WANRECORDING, WANWATCH
520000 5.2
DLink Camera LANPHOTO, LANRECORDING, LANWATCH 60000 0.6
Globe Lamp Flood UDP, Flood HTTP, Flood TCP, LANCOLORTEMP, WANOFF, WANCOLORTEMP,
WANCOLOR, LOCALON, LOCALOFF, LANON, LANOFF, GOOGLEON, LANCOLOR,
GOOGLEOFF, GOOGLECOLORTEMP, GOOGLECOLOR, ALEXAON, ALEXAOFF,
ALEXACOLORTEMP, ALEXACOLOR, WANON
855004 8.5
Google Nest Mini LANVOLUMEOFF, LANVOLUMEON, LOCALVOLUMEOFF, LOCALVOLUMEON,
VOICEVOLUMEOFF, VOICEVOLUMEON, WANVOLUMEOFF, WANVOLUMEON
160000 1.6
HeimVision Camera Flood UDP, Flood HTTP, Flood TCP, LANPHOTO, LANRECORDING, LANWATCH,
WANPHOTO, RTSP Brute Force Nmap
674980 6.7
HeimVision Lamp ALEXAALARMOFF, ALEXAALARMON, WANLIGHTOFF, WANALARMON,
WANALARMOFF, LOCALLIGHTON, LOCALLIGHTOFF, LOCALALARMON,
LOCALALARMOFF, LANLIGHTON, LANLIGHTOFF, LANALARMON,
LANALARMOFF, GOOGLELIGHTON, GOOGLELIGHTOFF, GOOGLEALARMON,
GOOGLEALARMOFF, ALEXALIGHTON, ALEXALIGHTOFF, WANLIGHTON
400000 4.0
Home Eye Camera LANPHOTO, LANRECORDING, LANWATCH, WANPHOTO,
WANRECORDING, WANWATCH
120000 1.2
Luohe Camera RTSP Brute Force Nmap, WANPHOTO, WANRECORDING, WANWATCH 92082 0.9
Nest Camera LANWATCH, WANWATCH 40000 0.4
Netatmo Camera Flood HTTP, Flood UDP, Flood TCP, LANWATCH, WANWATCH 1040000 10.4
Philips Hue Bridge Flood TCP, Flood UDP, ALEXAOFF, ALEXAON, GOOGLEOFF, GOOGLEON,
LANOFF, LANON, LOCALBUTTON, WANOFF, WANON
980000 9.8
Ring Basestation Flood UDP, Flood HTTP, Flood TCP, ALEXAARM, ALEXADISARM, LANARM,
LANDISARM, LOCALARM, LOCALDISARM, WANARM, WANDISARM
655005 6.5
Roomba Vacuum Flood TCP, Flood UDP, Flood HTTP, ALEXACLEAN, ALEXARETURN,
GOOGLECLEAN, GOOGLERETURN, LANCLEAN, LANEMPTY,
LANRETURN, WANCLEAN, WANEMPTY, WANRETURN
694949 6.9
SimCam Flood TCP, RTSP Brute Force Hydra, RTSP Brute Force Nmap,
LANPHOTO, LANRECORDING, LANWATCH
539173 5.4
Smart Board LOCALBACK, LOCALBROWSER, LOCALBROWSWER 60000 0.6
Sonos One Speaker ALEXAPLAY, ALEXASTOP, LANPLAY, LANSTOP 80000 0.8
Tekin Plug ALEXAOFF, ALEXAON, GOOGLEOFF, GOOGLEON, LANOFF, LANON,
LOCALOFF, LOCALON, WANOFF, WANON
200000 2.0
Yutron Plug ALEXAOFF, ALEXAON, GOOGLEOFF, GOOGLEON, LANOFF, LANON,
LOCALOFF, LOCALON, WANOFF, WANON
200000 2.0
All devices 10011207 100.0
We decided to consider only the best models for
each task during this experiment. According to the
Table 4, for Atomi Coffee Maker it is RF for classifi-
cation and EE for reconstruction.
The results received for each class of the Atomi
Coffee Maker traffic are presented in Table 3. It
is showing, that each class of the traffic is effi-
ciently classified – the lowest F-measure is 0.957 for
LANOFF. More over, FP and FN are mostly occur
between normal traffic scenarios, while there are only
5 malicious events, that were incorrectly interpreted.
The results of the feature importance analysis us-
ing Sklearn are presented in Figure 2. Among the
top 10 features, packet rate and tcp window are in-
troduced by us, while other features were available in
the initial version of the dataset.
Table 3: Atomi Coffee Maker: classification report for RF.
Class Precision Recall F-measure Support Accuracy
Flood HTTP 0,999 0,999 0,999 40000
0,994
Flood TCP 1,000 0,999 0,999 4001
Flood UDP 1,000 1,000 1,000 80000
ALEXAOFF 0,999 0,999 0,999 4000
ALEXAON 0,970 0,974 0,972 4000
GOOGLEOFF 0,987 0,956 0,971 4000
GOOGLEON 0,956 0,982 0,969 4000
LANOFF 0,953 0,961 0,957 4000
LANON 0,962 0,958 0,960 4000
LOCALOFF 0,973 0,971 0,972 4000
LOCALON 0,978 0,977 0,977 4000
WANOFF 0,984 0,987 0,986 4000
WANON 0,987 0,984 0,986 4000
macro avg 0,981 0,981 0,981 164001
weighted avg 0,994 0,994 0,994 164001
Table 5 shows the classification report for the EE
anomaly detection model. This model was trained on
all normal activity scenarios of the device, and we
ICISSP 2025 - 11th International Conference on Information Systems Security and Privacy
280
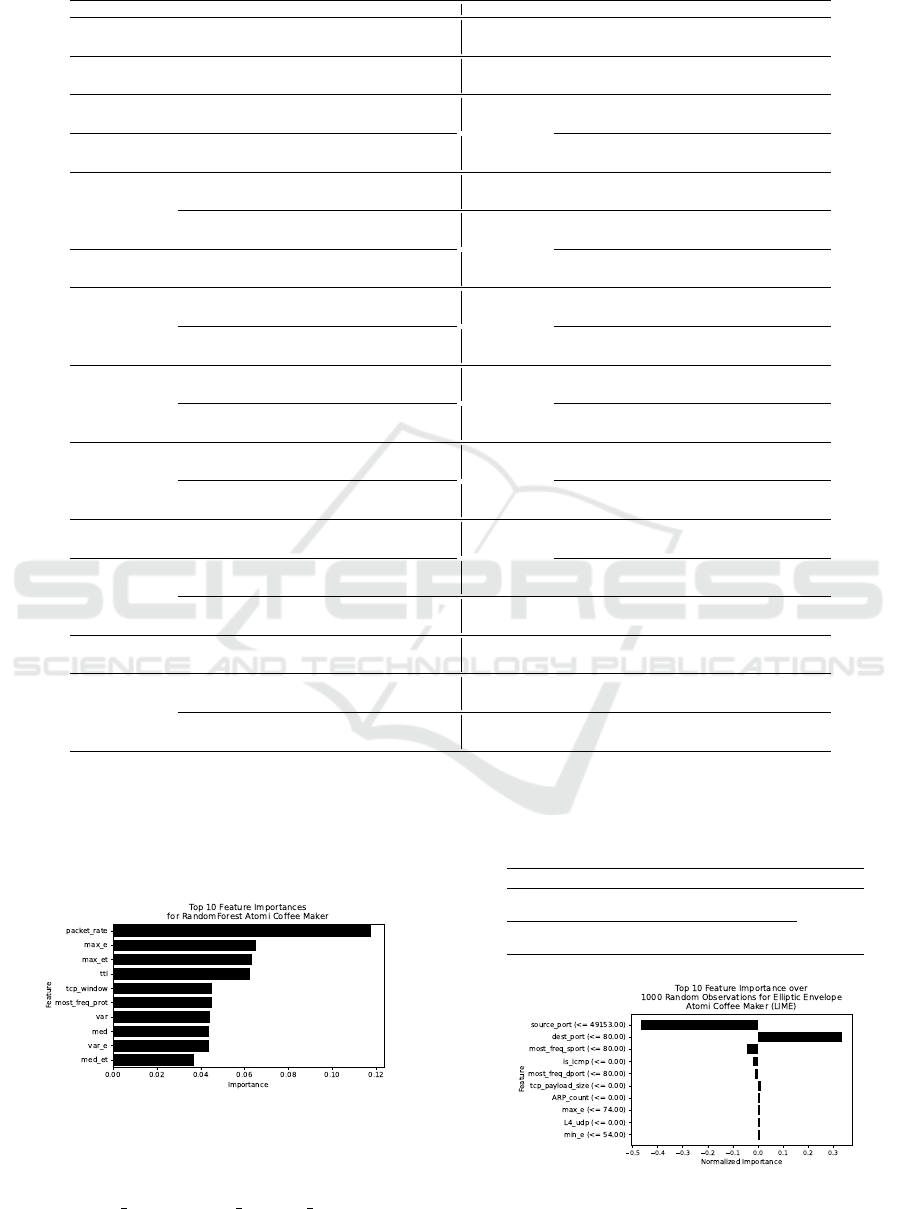
Table 4: Results of the experiments.
Device Scenarios Model Accuracy Precision Recall F-measure Device Scenarios Model Accuracy Precision Recall F-measure
Amazon Echo Dot 8
RF 0,985 0,985 0,985 0,985
HeimVision Lamp 20
RF 0,943 0,944 0,943 0,943
CB 0,981 0,981 0,981 0,981 CB 0,930 0,932 0,930 0,930
XGB 0,986 0,986 0,986 0,986 XGB 0,949 0,950 0,949 0,949
Amazon Echo Spot 8
RF 0,982 0,982 0,982 0,982
Home Eye Camera 6
RF 0,999 0,999 0,999 0,999
CB 0,979 0,979 0,979 0,979 CB 0,999 0,999 0,999 0,999
XGB 0,980 0,980 0,980 0,980 XGB 0,999 0,999 0,999 0,999
Amazon Echo Studio 8
RF 0,991 0,991 0,991 0,991
Luohe Camera
4
RF 0,999 0,999 0,999 0,999
CB 0,990 0,990 0,990 0,990 CB 0,999 0,999 0,999 0,999
XGB 0,989 0,989 0,989 0,989 XGB 0,999 0,999 0,999 0,999
Amazon Plug 8
RF 0,999 0,999 0,999 0,999
2
IF 0,944 0,952 0,944 0,945
CB 0,999 0,999 0,999 0,999 EE 0,935 0,946 0,935 0,936
XGB 0,999 0,999 0,999 0,999 1-SVM 0,936 0,946 0,936 0,937
Amcrest Camera
5
RF 0,999 0,999 0,999 0,999
Nest Camera 2
RF 0,922 0,922 0,922 0,922
CB 0,999 0,999 0,999 0,999 CB 0,927 0,927 0,927 0,927
XGB 0,999 0,999 0,999 0,999 XGB 0,881 0,881 0,881 0,881
2
IF 0,772 0,774 0,772 0,772
Netatmo Camera
5
RF 1,000 1,000 1,000 1,000
EE 0,639 0,689 0,639 0,613 CB 0,999 0,999 0,999 0,999
1-SVM 0,605 0,661 0,605 0,568 XGB 1,000 1,000 1,000 1,000
Arlo Basestation Camera 6
RF 0,996 0,996 0,996 0,996
2
IF 0,994 0,994 0,994 0,993
CB 0,997 0,997 0,997 0,997 EE 0,533 0,957 0,533 0,660
XGB 0,997 0,997 0,997 0,997 1-SVM 0,382 0,953 0,382 0,512
ArloQ Camera
9
RF 0,999 0,999 0,999 0,999
Philips Hue Bridge
11
RF 0,999 0,999 0,999 0,999
CB 0,999 0,999 0,999 0,999 CB 0,999 0,999 0,999 0,999
XGB 0,999 0,999 0,999 0,999 XGB 0,999 0,999 0,999 0,999
2
IF 0,977 0,978 0,977 0,976
2
IF 0,979 0,980 0,979 0,979
EE 0,704 0,892 0,704 0,753 EE 0,981 0,982 0,981 0,981
1-SVM 0,988 0,988 0,988 0,988 1-SVM 0,310 0,763 0,310 0,300
Atomi Coffee Maker
13
RF 0,994 0,994 0,994 0,994
Ring Basestation
11
RF 0,994 0,994 0,994 0,994
CB 0,993 0,993 0,993 0,993 CB 0,994 0,994 0,994 0,994
XGB 0,993 0,993 0,993 0,993 XGB 0,994 0,994 0,994 0,994
2
IF 0,960 0,962 0,960 0,959
2
IF 0,957 0,960 0,957 0,956
EE 0,976 0,977 0,976 0,976 EE 0,975 0,976 0,975 0,974
1-SVM 0,673 0,821 0,673 0,696 1-SVM 0,969 0,969 0,969 0,968
Borun Camera
7
RF 0,999 0,999 0,999 0,999
Roomba Vacuum
13
RF 0,997 0,997 0,997 0,997
CB 0,999 0,999 0,999 0,999
CB 0,996 0,996 0,996 0,996
XGB 0,999 0,999 0,999 0,999 XGB 0,996 0,996 0,996 0,996
2
IF 0,616 0,807 0,616 0,644
2
IF 0,961 0,963 0,961 0,960
EE 0,976 0,977 0,976 0,976 EE 0,971 0,972 0,971 0,971
1-SVM 0,193 0,046 0,193 0,075 1-SVM 0,833 0,866 0,833 0,840
DLink Camera 3
RF 1,000 1,000 1,000 1,000
SimCam
6
RF 0,999 0,999 0,999 0,999
CB 1,000 1,000 1,000 1,000 CB 0,999 0,999 0,999 0,999
XGB 1,000 1,000 1,000 1,000 XGB 0,999 0,999 0,999 0,999
Globe Lamp
21
RF 0,992 0,992 0,992 0,992
2
IF 0,977 0,978 0,977 0,976
CB 0,991 0,991 0,991 0,991 EE 0,988 0,988 0,988 0,988
XGB 0,992 0,993 0,992 0,992 1-SVM 0,253 0,792 0,253 0,293
2
IF 0,939 0,945 0,939 0,938
Smart Board 3
RF 1,000 1,000 1,000 1,000
EE 0,379 0,172 0,379 0,232 CB 0,999 0,999 0,999 0,999
1-SVM 0,346 0,211 0,346 0,229 XGB 0,999 0,999 0,999 0,999
Google Nest Mini 8
RF 0,998 0,998 0,998 0,998
Sonos One Speaker 4
RF 0,999 0,999 0,999 0,999
CB 0,997 0,997 0,997 0,997 CB 0,999 0,999 0,999 0,999
XGB 0,971 0,971 0,971 0,971 XGB 0,999 0,999 0,999 0,999
HeimVision Camera
8
RF 0,999 0,999 0,999 0,999
Tekin Plug 10
RF 0,957 0,957 0,957 0,957
CB 0,999 0,999 0,999 0,999 CB 0,952 0,953 0,952 0,952
XGB 0,999 0,999 0,999 0,999 XGB 0,825 0,834 0,825 0,824
2
IF 0,982 0,982 0,982 0,981
Yutron Plug 10
RF 0,926 0,926 0,926 0,926
EE 0,988 0,988 0,988 0,988 CB 0,908 0,910 0,908 0,908
1-SVM 0,876 0,913 0,876 0,888 XGB 0,918 0,920 0,918 0,918
investigated its efficiency in distinguishing legitimate
network events from malicious. It can be noted, that
all legitimate network events are identified without er-
rors. For malicious data, 3870 events were incorrectly
distinguished as legitimate.
Figure 2: Atomi Coffee Maker: top 10 features for RF.
The results of the feature importance analysis us-
ing LIME are presented in Figure 3. Among the top
10 features, is icmp and tcp payload size are intro-
duced by us, while other features were available in
the initial version of the dataset.
Table 5: Atomi Coffee Maker: classification report for EE.
Class Precision Recall F-measure Support Accuracy
normal 0,970 1,000 0,985 124001
0,976
abnormal 1,000 0,903 0,949 40000
macro avg 0,985 0,952 0,967 164001
weighted avg 0,977 0,976 0,976 164001
Figure 3: Atomi Coffee Maker: top 10 features for EE.
Exploring Efficiency of Machine Learning in Profiling of Internet of Things Devices for Malicious Activity Detection
281

Those examples confirm that the extension of the
dataset with such features can improve the quality of
IoT devices profiling. A comparison of our results
with the results obtained in related work is presented
in Table 6. It is important to note that it is not easy to
directly compare our results with the results, received
by other researchers, because we used a different ver-
sion of the dataset and worked on a different task.
The obtained results are not inferior to the results
of other studies, which confirms the applicability of
the developed approach to ensure the security of IoT
devices. Our advantages are as follows:
• Data preprocessing successfully solves feature ex-
traction and data normalization tasks, ensuring the
preparation of high-quality datasets.
• Model training in most cases demonstrated high
efficiency in traffic classification and anomaly de-
tection using selected models.
• The approach provides a visual presentation of re-
sults, including classification reports, confusion
matrices, feature importance graphs, and identi-
fication of performance metrics. This allows for
easy interpretation of information and informed
decisions on network security management.
As for the challenges to be solved, the following
can be mentioned: the efficiency of the models de-
pends on the quality and volume of the source data,
which may require additional efforts to collect and
preprocess the information; there is a need for fur-
ther optimization and testing to adapt the system to
industrial requirements and improve its performance.
6 CONCLUSION
In this work, an approach for profiling of IoT de-
vices to detect malicious activity is presented. This
approach works with the network activity of devices
and analyses their behavior with ML methods.
In total, we created profiles of 26 IoT devices.
For each device, we compared the efficiency of Ran-
dom Forest, XGBoost and CatBoost classifiers in the
atatck detection task, as well as Isolation Forest, El-
liptic Envelope and One Class Support Vector Ma-
chine reconstructors in the anomaly detection task.
Based on the obtained results, the following rec-
ommendations can be made for further development
and application of the developed system:
• Expanding the data set.
• Developing additional preprocessing methods.
• Expanding hyperparameter optimization.
• Integrating with other models and algorithms.
• Expanding the functionality of the system.
• Adapting to new threats.
Our approach faced several challenges: data im-
balance was mitigated with ADASYN and undersam-
pling; high feature dimensionality was addressed us-
ing feature importance analysis; limited malicious
traffic was supplemented with synthetic data; and de-
vice behavior variability requires future adaptive so-
lutions. Additionally, the reliance on dataset may
limit generalizability, and computational complexity
remains a concern for scaling.
Table 6: Comparison with the state-of-the-art.
Work Dataset Approach Model Accuracy Precision Recall F-score Type
(Bakhsh et al., 2023) CICIoT2022
One model
for all devices
FFNN 0.9993 0.9993 0.9993 0.9993 Max
LSTM 0.9989 0.9989 0.9989 0.9989 Max
RandNN 0.9642 0.9642 0.9642 0.9642 Max
(Zhao et al., 2023)
CICIoT2022 One model
for all devices
YaTC
0.9658 - - 0.9658 Max
ISCXTor2016 0.9972 - - 0.9972 Max
(Zohourian et al., 2024) CICIoT2023
One model
for all devices
non-ML (IoT-PRIDS) 0.9874 0.9384 0.9971 0.9529 Max
(Roshan and Zafar, 2024)
CICIoT2023 One model
for all devices
EnsAdp CIDS
0.9893 0.9950 0.9940 0.9945 Max
CICIDS-2017 0.9977 0.9982 0.9986 0.9978 Max
(Khan and Alkhathami, 2024) CICIoT2023
One model
for all devices
2-class RF 0.9955 0.9955 0.9955 0.9955 Max
34-class RF 0.9633 0.9628 0.9633 0.9626 Max
(Jeffrey et al., 2024)
CICIot2023 One model
for all devices
Ensemble Learning Boosting
(LR, NB, SVM, KNN, MLP)
0.9319 0.9353 0.9319 0.9324 Max
Edge-IIoTset2023 0.9601 0.9606 0.9601 0.9594 Max
(Bajpai et al., 2023) IoTID20
One model
for all devices
RF 0.9868 - - - Max
XGB 0.9867 - - - Max
Extra Tree 0.9845 - - - Max
Ours
CICIoT2022
(improved version)
Individual models
per device
Anomaly detection
(IF, EE, 1-SVM)
0.9940 0.9940 0.9940 0.9930 Max
0.9549 0.9568 0.9549 0.9547 Avg
0.7720 0.7740 0.7720 0.7720 Min
Attack detection
(RF, XGB, CB)
1.0000 1.0000 1.0000 1.0000 Max
0.9880 0.9880 0.9880 0.9880 Avg
0.9270 0.9270 0.9270 0.9270 Min
ICISSP 2025 - 11th International Conference on Information Systems Security and Privacy
282

During the further research, we plan to focus
on developing adaptive protection methods, multifac-
tor profiling, the ability to integrate the system into
critical infrastructure facilities, increasing system re-
silience, and other aspects related to ensuring secu-
rity and reliability. It would allow improving protec-
tion against cyber threats, minimize the risks of unau-
thorized access, and improve the efficiency of man-
agement and monitoring in the face of dynamically
changing threats and requirements.
ACKNOWLEDGEMENTS
The study was supported by the grant of the Russian
Science Foundation No. 24-71-10095, https://rscf.ru/
en/project/24-71-10095/.
REFERENCES
Bajpai, S., Sharma, K., and Chaurasia, B. K. (2023). Intru-
sion detection framework in iot networks. SN Com-
puter Science, 4(4):350.
Bakhsh, S. A., Khan, M. A., Ahmed, F., Alshehri, M. S.,
Ali, H., and Ahmad, J. (2023). Enhancing iot network
security through deep learning-powered intrusion de-
tection system. Internet of Things, 24:100936.
Bansal, M. and Priya (2021). Performance comparison of
mqtt and coap protocols in different simulation en-
vironments. Inventive Communication and Compu-
tational Technologies: Proceedings of ICICCT 2020,
pages 549–560.
Canavese, D., Mannella, L., Regano, L., and Basile, C.
(2024). Security at the edge for resource-limited iot
devices. Sensors, 24(2):590.
Dadkhah, S., Mahdikhani, H., Danso, P. K., Zohourian, A.,
Truong, K. A., and Ghorbani, A. A. (2022). Towards
the development of a realistic multidimensional iot
profiling dataset. In 2022 19th Annual International
Conference on Privacy, Security & Trust (PST), pages
1–11. IEEE.
Ericsson (2024). Ericsson mobility visualizer. Last ac-
cessed 20 November 2024.
Istiaque Ahmed, K., Tahir, M., Hadi Habaebi, M., Lun Lau,
S., and Ahad, A. (2021). Machine learning for
authentication and authorization in iot: Taxonomy,
challenges and future research direction. Sensors,
21(15):5122.
Jeffrey, N., Tan, Q., and Villar, J. R. (2024). Using ensem-
ble learning for anomaly detection in cyber–physical
systems. Electronics, 13(7):1391.
Khan, M. M. and Alkhathami, M. (2024). Anomaly de-
tection in iot-based healthcare: machine learning for
enhanced security. Scientific Reports, 14(1):5872.
Levshun, D., Bakhtin, Y., Chechulin, A., and Kotenko, I.
(2019). Analysis of attack actions on the railway in-
frastructure based on the integrated model. In Interna-
tional Symposium on Mobile Internet Security, pages
145–162. Springer.
Levshun, D., Chechulin, A., and Kotenko, I. (2017). De-
sign lifecycle for secure cyber-physical systems based
on embedded devices. In 2017 9th IEEE International
Conference on Intelligent Data Acquisition and Ad-
vanced Computing Systems: Technology and Applica-
tions (IDAACS), volume 1, pages 277–282. IEEE.
Levshun, D., Chechulin, A., and Kotenko, I. (2018). A tech-
nique for design of secure data transfer environment:
Application for i2c protocol. In 2018 IEEE Indus-
trial Cyber-Physical Systems (ICPS), pages 789–794.
IEEE.
Nguyen, G. L., Dumba, B., Ngo, Q.-D., Le, H.-V., and
Nguyen, T. N. (2022). A collaborative approach to
early detection of iot botnet. Computers & Electrical
Engineering, 97:107525.
Rose, J. R., Swann, M., Bendiab, G., Shiaeles, S., and
Kolokotronis, N. (2021). Intrusion detection using
network traffic profiling and machine learning for iot.
In 2021 IEEE 7th International Conference on Net-
work Softwarization (NetSoft), pages 409–415. IEEE.
Roshan, K. and Zafar, A. (2024). Ensemble adaptive online
machine learning in data stream: a case study in cyber
intrusion detection system. International Journal of
Information Technology, pages 1–14.
Safi, M., Dadkhah, S., Shoeleh, F., Mahdikhani, H.,
Molyneaux, H., and Ghorbani, A. A. (2022). A sur-
vey on iot profiling, fingerprinting, and identification.
ACM Transactions on Internet of Things, 3(4):1–39.
Safi, M., Kaur, B., Dadkhah, S., Shoeleh, F., Lashkari,
A. H., Molyneaux, H., and Ghorbani, A. A. (2021).
Behavioural monitoring and security profiling in the
internet of things (iot). In 2021 IEEE 23rd Int Conf
on High Performance Computing & Communications;
7th Int Conf on Data Science & Systems; 19th Int
Conf on Smart City; 7th Int Conf on Dependabil-
ity in Sensor, Cloud & Big Data Systems & Ap-
plication (HPCC/DSS/SmartCity/DependSys), pages
1203–1210. IEEE.
Slimane, J. B., Abd-Elkawy, E. H., and Maqbool, A. (2024).
Intrusion detection using network traffic profiling and
machine learning for iot. Journal of Electrical Sys-
tems, 20(3s):2140–2149.
W
´
ojcicki, K., Biega
´
nska, M., Paliwoda, B., and G
´
orna, J.
(2022). Internet of things in industry: Research profil-
ing, application, challenges and opportunities—a re-
view. Energies, 15(5):1806.
Zhao, R., Zhan, M., Deng, X., Wang, Y., Wang, Y., Gui,
G., and Xue, Z. (2023). Yet another traffic classi-
fier: A masked autoencoder based traffic transformer
with multi-level flow representation. In Proceedings
of the AAAI Conference on Artificial Intelligence, vol-
ume 37, pages 5420–5427.
Zohourian, A., Dadkhah, S., Molyneaux, H., Neto, E. C. P.,
and Ghorbani, A. A. (2024). Iot-prids: Leveraging
packet representations for intrusion detection in iot
networks. Computers & Security, 146:104034.
Exploring Efficiency of Machine Learning in Profiling of Internet of Things Devices for Malicious Activity Detection
283
