
Multilevel Hypergraphs: A Conceptual Approach for Complex
System Database Modelling
José Ribas
1a
and Orlando Belo
2b
1
Higher School of Technology and Management, Polytechnic Institute of Viana do Castelo, Portugal
2
ALGORITMI R&D Centre / LASI, University of Minho, Portugal
Keywords: Complex System Modelling, Database Models, Graphs, Graph Models, Hypergraphs, Multi-Level
Hypergraphs, and Graph Databases.
Abstract: Graphs are very specialized structures for modelling and representing data objects and their relationships in
real-world applications. The number and diversity of graph-based applications existing today are clear
testimonies of the importance and relevance of the application of graphs in solving real-world problems.
However, more conventional graph structures have difficulty keeping up with the evolving complexity of
problems, particularly when they involve n-ary relationships between data objects. This can be overcome
using hypergraphs, which allow for representing complex relationships between finite sets of data objects.
However, their implementation still has some difficulties, such as the establishment of efficient algebras and
computing mechanisms to deal with relational content between entities of a dataset. In this paper, we present
an extension to conventional hypergraph-based models for modelling real world problems, proposing a new
functional abstraction based on a graph structure with several levels of abstraction. Relationships between
data objects are established at each level in a traditional way, while relationships between levels are defined
by “levelled” virtual data objects, allowing for the establishment of inheritance relationships between other
data objects of sequential levels, through a logical governance structure defining the relational flow between
the various levels of the established model. We named this structure as multilevel hypergraph.
1 INTRODUCTION
Graph theory (Daniel, 2013) (Angles & Gutierres,
2008) (Bondy & Murty, 2008) has been used since
very early in our training process. From the first
moment we saw a map of roads, graphs emerged in a
very natural way as the most appropriate solution to
represent the various data elements and their
relationships presented in a map. Later, in more
advanced study cycles, graphs appeared to us as
simple but very powerful "tools" for modelling real-
world systems. As we study graph theory,
approaching its history, foundations, terminology,
models and algebras, we recognize the importance of
the work of Euler (Biggs et al., 1986), which was the
first to use a graph model to solve a real practical
problem (the "Seven Bridges of Königsberg") or of
Sylvester (1878) that coined the word graph, as well
as the enormous potential and application of graphs.
a
https://orcid.org/0000-0001-9139-2801
b
https://orcid.org/0000-0003-2157-8891
In the areas of Medicine, Biology, Economics or
Computer Science, among many others, graphs have
been applied in a very systematic way, to represent
and solve very complex problems (Kanhio, 2023).
However, as problems become more complex, we
find that the most elementary representations of
graphs are not always the most adequate to address
some problems, especially those that require the
establishment of more complex relationships between
data objects than simple binary relationships, between
pairs of data objects. In some applications, the use of
simple relationships can lead to the loss of pertinent
information or even lead to the inability of the model
to represent real data objects. Cases like these require
other modelling approaches for overcoming such
limitations and providing means to represent complex
relationships (n-ary) between data objects. One of the
ways we can use to solve these types of problems is
using hypergraphs.
Ribas, J. and Belo, O.
Multilevel Hypergraphs: A Conceptual Approach for Complex System Database Modelling.
DOI: 10.5220/0013356900003929
In Proceedings of the 27th International Conference on Enterprise Information Systems (ICEIS 2025) - Volume 1, pages 87-98
ISBN: 978-989-758-749-8; ISSN: 2184-4992
Copyright © 2025 by Paper published under CC license (CC BY-NC-ND 4.0)
87

Berge (Berge, 1967) (Berge, 1973) introduced the
concept of hypergraph as a form of generalization of
graph-based approaches. In practice, a hypergraph
(Hellmuth et al., 2012) (Voloshin, 2009) (Bretto,
2013) is made up of a set of vertices and a set of
hyperedges that each refer to a diverse set of vertices.
In addition, vertices of a hypergraph can be related to
several hyperedges. Hypergraphs are a natural model
for the representation of networks or systems that
require the representation and manipulation of objects
with complex relationships or need to host higher-
order interaction processes. In fields such as physics,
biology, or engineering, traditional graph models may
not have the capacity to represent adequately the
complexity of the data objects involved. In these
cases, hypergraphs have already proven that they can
help.
From social network analysis to software system
modelling, hypergraphs have had numerous
applications. We can find them in several application
domains (Molnár, 2014), such as image segmentation
processes (Ducournau et al., 2012), representing
structures of non-classical molecules (Konstantinova
& Skorobogatov, 2001), provisioning of new data
models for social networks (Amato et al., 2017),
recommending music in social networks (Tan et al.,
2011), or representing systems (Sarkadi-Nagy &
Molnár, 2019). Despite their proven usefulness,
hypergraphs reveal some practical limitations,
particularly in visualizing and interpreting the
complex objects they represent and host, as well as in
understanding the relationships established, and
mapping them in a real field of application. In
addition, given their complexity, they are much more
demanding in terms of computational resources and
may be less efficient than traditional graphs.
In this paper, we present and discuss a new
conceptual model for hosting hypergraphs: multilevel
hypergraphs (MLHG). A MLHG uses multilevel
graphs to represent complex real-world problems,
presenting several benefits and applications in
different areas of knowledge, namely in the field of
data science and data engineering. The model of a
MLHG is a new functional abstraction for modelling
real world problems, since it allows to make more
complex and detailed representations of relationships
between entities and to sustain analysis processes
along the various levels of abstraction defined in the
structures of the implemented model. A MLHG adds
a new set of features to conventional hypergraphs,
namely: the ability to create and edit a modular data
hierarchy during the construction of the model itself,
or the process of its instantiation; the capability to
perform isolated analyses on a specific set of data,
bounded between two levels of abstraction, within a
virtual vertex; or the simplicity of manipulating the
data structure of a specific set of data contained in any
virtual vertex, without harming the other data or the
overall structure of the model, are just some of them.
These characteristics enable innovative approaches to
solve new problems, especially those related to
models with multiple functional complexities or to
models with irregular hierarchical groupings, whose
hierarchies are not initially defined in the model, and
whose mutations evolve over time, being applicable
in latent scenarios. We organized the remaining part
of this paper as follows. Section 2 exposes the domain
of graphs and hypergraphs, giving emphasis to their
fundamentals and applications, Section 3 presents and
discusses multilevel hypergraphs, an abstract
extension for conventional hypergraphs we propose
for modelling complex systems, and Section 4
demonstrates the application of multilevel
hypergraphs to a specific application case. Finally,
Section 5 presents some conclusions and future work.
2 GRAPHS AND HYPERGRAPHS
The application of graphs (Daniel, 2013) (Angles &
Gutierres, 2008) to real-world problems are quite
common whenever the problem requires, directly or
indirectly, the representation and storage of data that
requires the definition of paired relationships between
one or more data elements. Numerous real-world
domains provide a very broad field of application for
the use and exploration of graph-based structures.
However, it is the emergence of new areas of work
and new services that, today, requires the use of
structures such as graphs, essentially due to the
volume and complexity of the data elements involved
and their relationships.
Many systems involving navigation or
transportation problems that people use in their
decision services use graphs, such as the one that
Dijkstra used many years ago (Dijkstra, 1959).
Graphs help to decide which is the shortest path
between two points (Johnson, 1977), to find the
shortest path between any pair of points in a directed
heavy graph, or to help allocate rental cars to people
who need to get around (Kuhn, 1955). These are
typical optimization problems in which graphs can be
naturally applied. But there are a lot more of fields
where graphs can be applied with very success. For
example, in Chemistry non-oriented graphs are used
to represent molecules (Wigh et al., 2022), in Biology
to represent bio entities such as proteins, genes, or
molecules (Georgios et al., 2018), or in Medicine to
ICEIS 2025 - 27th International Conference on Enterprise Information Systems
88

support the interpretation of proteomic data (Brin &
Page, 1998). In Process Management and Control
applications, some of the data representation models
are used to represent the execution of tasks or
processes, considering their sequence, scaling, or
execution time.
Graph models have enormous application
potential. We can prove this through the numerous
applications in various scientific fields, supporting a
wide variety of solutions to problems in networks of
chemical reactions, access to web pages,
establishment of usage profiles, or in the analysis of
population dynamics. But probably the most relevant
application was in Google's PageRank System (Brin
& Page, 1998). Finally, we want to mention the use
of graphs in the implementation of database systems
(Angles & Gutierres, 2008), in which we can find
very high-level graph structures to host and relate
data elements, in large volume and diversity. Take,
for example, the cases of the database management
systems Neo4J (Neo4J, 2024), JanusGraph
(JanusGraph, 2024), Memgraph (Memgraph, 2024)
or NebulaGraph (NebulaGraph, 2024), which have
been gaining popularity over the last few years, or
other hybrid systems, which integrate graphs with
other types of data structures to cover a wide
spectrum of applications.
Generally, a graph G is abstractly defined as a
structure G (V, E), where V represents the vertices
and E the edges that support connections among
vertices, allowing the establishment of relationships
between different entities or data objects, defining
semantic relationships, interrelating characteristics,
and promoting inference of new information. Over
the years, graph structures and their conceptualization
processes have evolved, encompassing new
representation schemes and embracing increasingly
sophisticated and complex levels of abstraction. But
in many real-world problems, relationships between
objects require more complex connections than
simple relationships between pairs of vertices. The
eventual representation of these complex
relationships through simple relationships could be
done, but it would lead to some kind of loss of
information, deteriorating the real representation of
the model in its field of application (Schölkopf et al.,
2007).
Hypergraphs (Hellmuth et al., 2012) (Ouvrard,
2020) can be a good solution for receiving complex
relationships, since they allow for the representation
of relationships between more than two vertices.
Hypergraph theory is not new, having been studied by
many researchers over the years. The concept of the
hypergraph was introduced by Claude Berge in 1967
(Berge, 1967). Since then, hypergraphs have been
used in a variety of applications, including problem
optimization, network analysis, machine learning, or
data science, among other areas (Molnár, 2014).
However, one of the biggest applications of
hypergraphs, probably the most impactful, has been
in graph partitioning, which is a technique widely
used in several areas, such as Computer Science,
Mathematics, Engineering or Physics. In these areas,
hypergraphs are used for solving combinatorial
optimization problems, data clustering, social
network analysis, or data routing, among many other
problems. Contrarily to traditional graphs,
hypergraphs are composed of vertices and
hyperedges. Hyperedges are sets of two or more
vertices identified as a single entity. The definition of
hyperedges provides essential means to receive and
deal with complex relationships among communities
of vertices, not only among simple vertices. In
scientific collaboration networks (Ouvrard et al.,
2017), for example, the use of hyperedges allows for
modelling the co-authorship of articles. In this case,
each vertex represents an author, and each hyperedge
represents an article on which those authors
collaborated. Using a hypergraph, we can effectively
model the (complex) relationships between authors
and papers, rather than simply relating pairs of
authors as would happen in a traditional graph.
Hypergraphs can represent higher-order relationships
between vertices, while traditional graphs are limited
to representing relationships of order 2 (edges). This
is the big distinction between conventional graphs
and hypergraphs. Furthermore, hypergraphs have
specific properties that differentiate them even more
from traditional graphs. For example, the cardinality
of a hyperedge is the number of vertices it contains,
while the cover of a hypergraph is the smallest set of
vertices that intersects all hyperedges. These
properties have important implications for the
analysis and understanding of hypergraphs. They
promote the investigation of richer structures and
provide greater flexibility in the relationships that
must be represented.
Formally, a hypergraph (HG) can be defined as a
structure (V, E, I), in which V is a non-empty set of
vertices, E a set of hyperedges, and I the incidence
function that associates each hyperedge of E with a
non-empty subset of V. The incidence function I is
defined as I: And → P(V), where P(V) is the set of
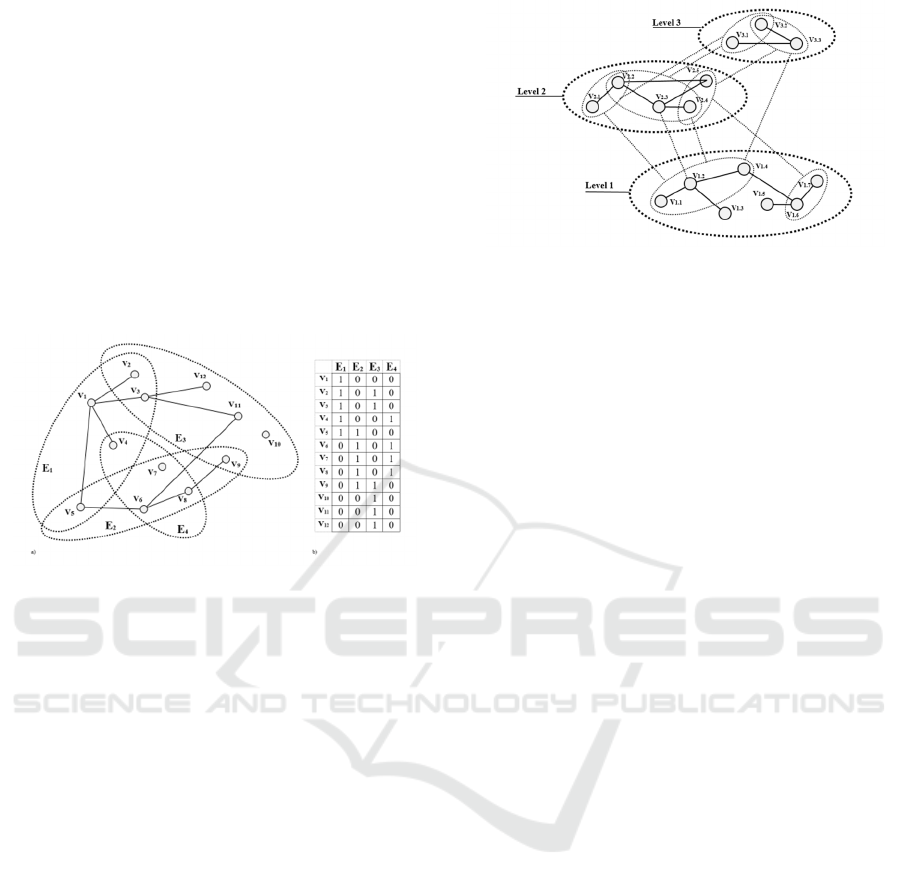
all subsets of V. Figure 1a illustrates a small example
of a hypergraph. The representation of hypergraphs
can be performed using algebraic, incidence,
adjacency matrices and their respective lists, as well
as through set-based approaches (Ouvrard, 2020).
Multilevel Hypergraphs: A Conceptual Approach for Complex System Database Modelling
89
Each of these representations must be carefully
chosen, considering the field of application and the
desired modelling, as each of them has specific
advantages and applications. In Figure 1a we can see
an example of a hypergraph and in Figure 1b the
corresponding matrix representation. However,
despite their advantages, hypergraphs pose some
difficulties, not only in terms of their complexity of
their computational representation and processing,
but also in their subsequent visualization,
manipulation, and analysis of their various data
elements. To work with a hypergraph, it is necessary
to use several techniques, such as, for example,
decomposition trees (Habib et al., 2022).
Figure 1: A hypergraph and its adjacency matrix.
In addition, modelling a hypergraph can also be quite
challenging, sometimes requiring the use of machine-
learning techniques (Gao et al., 2022), as well as
interpreting the information we obtain from a
hypergraph, given the complexity of the data and the
relationships that are included in it. To interpret data
like these, Frieze and Karoński (2015) proposed some
specific random graph-based techniques, namely for
applying in processes of pattern and relationship
analysis in scientific literature.
Over time, depending on the needs of the
problems and their domains of knowledge, several
types of hypergraphs have been created, which are
basically extensions to the original model of a
hypergraph. Today, in the literature, we can find a
large diversity of references about hypergraphs,
ranging from random hypergraphs (Frieze &
Karoński, 2015) (Ghoshal et al., 2009), incident
hypergraphs (Grilliette et al., 2022), to hierarchical
hypergraphs (Ancona & De Floriani, 1989), among
many others. Although the importance of all these
types of hypergraphs in their own fields of
application, in this work we have relied in a particular
type of hypergraphs, hierarchical (Figure 2), in which
vertices and hyperedges are organised at different
levels.
Figure 2: An example of a hierarchical hypergraph.
This type of hypergraph is used effectively in very
interesting areas of application. Of note is their
application in rule-based modelling of biochemical
systems (Lemonset al., 2011), representing structural
properties of robotic systems (Scioni et al., 2016), or
describing the structure of an application and its
computing architecture (Yang & Shen, 2015).
Inspired by all these works, we designed a new
definition for a multilevel hypergraph structure, as a
new class of hypergraphs, which has greater
flexibility in modelling complex systems, involving
multiple levels of hierarchy. With this type of
hypergraph, it will be possible to create connections
that are more complex, with greater granularity, when
compared to traditional hierarchical hypergraphs,
which we think are an interesting alternative for
representing and manipulating complex systems, at
different areas of knowledge. In the next section, we
will approach this new class of hypergraphs: MLHG.
3 MULTILEVEL HYPERGRAPHS
The nature of a problem determines what kind of data
model we need to use. Different problems impose
different data models. Obviously. Each type of
problem requires a specific data model, supported by
a particular type of graph. There are problems having
complex natures that require sophisticated graph
structures for modelling and receiving data, capable
of representing entities whose characterization (and
relationships) is done through the establishment of
several levels of abstraction, with some kind of
defined hierarchy. To accommodate this kind of
modelling problems, we propose MLHG as an
alternative functional abstraction.
A MLHG (Figure 3) is a generalization of a
hypergraph, which allows for describing complex
relationships between multiple data objects
distributed by distinct abstraction levels. The
mathematical-computational representation of
ICEIS 2025 - 27th International Conference on Enterprise Information Systems
90
problems using a MLHG provides the basis for
modelling relationships between objects belonging to
different levels, which often cannot be described in an
adequate manner by other hypergraph approaches,
even by hierarchical hypergraphs.
Figure 3: Illustration of a MLHG conceptual structure.
The MLHG model proposal we propose uses a
structure (V
i,n
, A
i,n
, V
*
i,n
, E
i,n
) (Figure 3), in which V
i,n
represents the set of regular vertices, A
i,n
the set of
level trees, V
*
i,n
the set of virtual vertices, and E
i,n
the
set of edges of the hypergraph. The vertices V
i,n
,
which are organized at different levels of abstraction,
represent the entities at a given level of abstraction n,
while the logical structure trees of levels (Ai,n)
manage the relational flow between the vertices of the
various levels. The virtual vertices (V
*
i,n
) are
candidates for hypergraphs at the n-level, and the
edges (E
i,n
) materialize the relationships between the
vertices V
i,n
and V
*
i,n
.
The mathematical-computational representation
of an MLHG is obtained using an adjacency matrix
structure supported by a dictionary of labels, in which
each vertex is represented on a specific line and a
column. The graphical representation of a MLHG
allows for visualizing different entities and
relationships present at a certain level of abstraction,
making it easier to understand and analyse any system
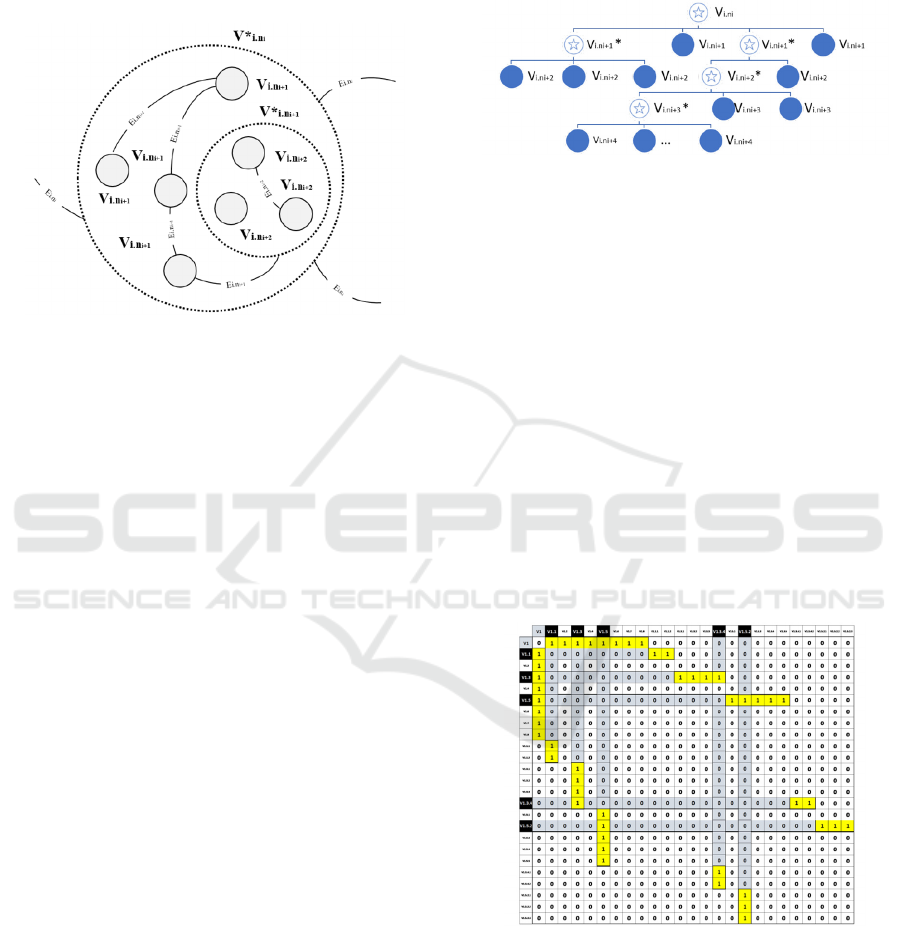
model. The level trees (A
i,n
) (Figure 4) play an
essential role in defining the flow of relationships
between different levels of abstraction of the MLHG.
Each tree starts with a specific root, which represents
the various regular vertices (V
i,n
) and the virtual
vertices (V
*
i,n
), at the n
i
level. As the tree may grow
to higher levels, virtual vertices (V
*
i,n
) turn into
branches, feeding other branches and providing
leaves (vertices) at the next higher level, n+1.
Level trees provide a clear hierarchical structure
of the various relationships between different levels
of abstraction of a MLHG. This provides a way for
establishing a coherent and efficient organization in
the representation of graphs of diverse multi levels of
abstraction, facilitating the understanding of the
relationships between all the entities involved in each
level of abstraction.
Figure 4: An example of a level tree of a MLHG.
Additionally, using virtual vertices (V
*
i,n
) allows
MLHG to represent models in which an entity has not
yet been fully defined or is not relevant to an ongoing
analysis process. Furthermore, we have created a
structure for labelling vertices representing entities at
a given level of abstraction n. This structure uses a
unique index for each vertex V, in the form
<i(n1).i(n2).i(n3).i(n4)…i(nn)>. The size of the index
allows for setting the cardinal of the level, as well as
the cardinal of the vertex at each level it crosses. For
example, a label having the format <1.3.4.2> refers to
a vertex, V
1.3.4.2
, at the maximum level, n=4,
representing, respectively, the second vertex of that
level, the fourth vertex of level 3, the third vertex of
level 2, and the first vertex of level 1. Labelling these
elements is important for identifying uniquely each
vertex in a MLHG.
Figure 5: An adjacency matrix of a MLHG.
Figure 5 shows the mapping of an MLHG in an
adjacency matrix. Through the adjacency matrix of
the level tree, it is possible to identify directly the
virtual vertices (V
*
i,n
) and the edges (E
i,n
) associated
with each level of abstraction of the MLHG. Thus, a
more organized and efficient representation of a
MLHG is achieved, facilitating the analysis of the
Multilevel Hypergraphs: A Conceptual Approach for Complex System Database Modelling
91
relationships established between the entities
involved, using the labels of their vertices. The
adjacency matrix of a MLHG is a square matrix of
dimensions (V x V), which can be represented simply
by [V
ij
]. This type of structure was chosen because it
is possible to know its dimensions in advance. It is a
structure commonly recommended for the
representation of dense graphs, which allows for
creating algebraic operators, and it is especially
oriented for representing digraphs.
The algorithm used for constructing the adjacency
matrix of an MLHG (Figure 6), as well as its vertex
labelling dictionary, was developed to ensure its
integrity. This is important, because there is an
inheritance relationship between the relationships of
each abstraction level (n) and its successor level
(n+1). This means that for a given relationship E
i,ni+1
,
existing at the level ni+1 between two vertices of this
level (V
i,ni+1
) and another virtual vertex (V
*
i,ni+1
),
candidate to be managed by each of the elements
integrated in the higher level, ni+2, it is necessary to
ensure the replication by inheritance of the
relationships, E
i,ni+1
(of edges) and of the vertex V
i,
ni+1
, for all vertices E
i,ni+2
constituents of V
*
i,ni+1
,
which in this process will no longer be part of the ni+2
level.
Figure 6: Building an adjacency matrix for a MLHG.
In the process of inheritance between levels (Figure
7), due to a certain relationship E
i,ni+1
of the ni+1
level, relating the vertex V
i,ni+1
with the virtual vertex
V
*
i,ni+1
at the level ni+2, it can be observed that three
new relationships arise, one for each vertex of V
*
i,ni+1
,
despite the loss of another relationship. The
inheritance relations defined with the relationships
established between each abstraction level (n) and its
successor level (n+1) are defined through the
algorithm, which allows for constructing the
adjacency matrix for the MLHG, for any level n. The
adjacency matrix, AdjM(MLHG), at the first level, is
initialized according to the standard convention for
labelled graphs. The algorithm iterates through each
virtual vertex V
*
i.ni+1
with edges E
i,n+1
, at each level
n+k, and establishes a new adjacency matrix
AdjM(V
i.ni+2
,E
i,n+2
), having dimension V
*
x V
*
, where
V
*
is the number of vertices in V
i.ni+2
. For expanding
the dimension of the current Madj array, and
accommodate a new Madj array (V
i.ni+2
,E
i,n+2
), the
algorithm performs three steps, namely it:
1) expands dimensionally the matrix in the (i-th+1)
row and column referring to the position of the
vertex V
*
i.ni+1
, by adding |V
*
|-1;
2) replicates the constant values with respect to the
virtual vertex V
*
i.ni+1
in the new coordinates
resulting from step 1, per column and per row;
3) develops the new Madj matrix from the correct
coordinates of the current Madj matrix, from the
initial coordinates of the vertex V
*
i.ni+1
.
Figure 7: Illustrating inheritance between levels.
For virtual vertices with no edges (E
i,n+1
), the
algorithm performs a similar process, but performing
a dimensional expansion from the origin of the
adjacency matrix, assigning zeros to all new
coordinates. The result is an adjacency matrix
AdjM(MLHG) representing an MLHG with levels
and no virtual vertices. The algorithm uses constant
values and straightforward development processes, to
minimize the number of calculations required to
construct the final adjacency matrix. MLHG are
designed to represent systems having multiple
hierarchies, or complex interactions between
different levels, being particularly adequate for
modelling systems. For example, in transportation
systems, Bezrukova (2019) demonstrated the
practical application of MLHG, and Yu Gu (2022)
their applications in the field of distributed data
processing, proposing a partitioning algorithm for
graph division for facilitating the distributed
processing of hypergraphs. All the experiments
revealed very interesting results. In the next section
we will look at how we can apply the model proposed
in this paper in a real-world application domain
4 AN APPLICATION CASE
Today, the application of hypergraphs has some
prominence in several application areas. By
modelling complex interactions between structural
ICEIS 2025 - 27th International Conference on Enterprise Information Systems
92

elements, hypergraphs allow the visualization of
global relationships defined in a system model,
making simple to understand how these interactions
influence the project. In this section, we will show
how to explore a MLHG for representing (and see)
relationships in a Rowing Club, which will allow us
to understand how the different elements of the club
are related and interact with each other. Using a
MLHG for representing them, it will be possible to
identify patterns and structures that would not be as
evident just by looking at the raw data. We can get a
more detailed view seeing the relationships between
different elements of the club, such as athletes,
coaches, competitions, and boats.
4.1 The Case: General Overview
Rowing, as a sport, has a deeply intertwined history
with the regattas that emerged along the River
Thames in England around 1700. Initially used for
transportation, even in war contexts, rowing has
evolved to become an emblematic sporting activity.
Historic competitions, such as the Oxford-Cambridge
regatta, established in 1829 and still held in London
today, were essential in consolidating rowing as a
prominent sport. Rowers compete in narrow
watercraft, sitting on movable benches with their
backs to the bow. In this speed competition, athletes
are challenged to propel the boat as fast as possible,
using oars and controlling the rudder by means of
cables attached to the feet.
There is a wide variety of categories, from
individual boats to teams of eight rowers. The number
of oars used depends on the type of boat and the
modality. On certain types of boats, especially larger
ones, a helmsman is present to guide the team and
dictate the pace of the paddling. Rowing clubs are
institutions dedicated to the training and competition
of rowers of all athletic levels. The management of
rowing clubs presents a series of complex difficulties
requiring well-defined strategies for ensuring the
success of the institution in competitions, namely to:
organize and coordinate training and competitions
ensuring that athletes are prepared for the
competitions, manage available resources – e.g.
boats, equipment or technical personnel – efficiently
to improve the performance of the club, or make
strategic decisions in various areas, to hire technical
staff, set training goals or plan competitions, for
example.
4.2 A MLHG Model
The MLHG allows for representing the diverse range
of relationships and interactions between the different
elements involved in the club. Its flexible structure is
essential to capture the complexity of the
management environment, which involves a variety
of intricate and dynamic relationships between its
elements, namely athletes, coaches, boats and
competitions, etc. The possibility of achieving a
multi-level representation of the relationships within
the club is an aspect that enhances the relationships
that can be visualized and analysed at different levels
of granularity. From the individual level of athletes
and coaches to the functional level of the competition
boats, as well as the management of the club. On the
other hand, club managers can conduct an integrated
analysis of the interactions between the different
members of the club, which includes identifying
patterns, trends, and correlations that may not be
easily perceived in a traditional management
approach. Faced with a chaotic scenario of the
dynamic management of the club, which is subject to
constant changes, such as the entry of new athletes,
the hiring of new coaches or the scheduling of new
competitions, we consider that the MLHG is
adequate, as it welcomes any changes that may occur
over time, which allows new elements to be easily
incorporated into a graph-based database and
relationships to be adjusted accordingly is necessary.
Let’s focus now specifically on our case study and
how modelling it is using a MLHG. The club has nine
different boats for the competitions (Table 1).
Table 1: Types of boats.
Each boat is identified by a unique label, B
i
. The club
has its own facilities, in which the athletes perform
specific daily training in water tanks and ergometers.
Within the group of athletes, only 12 are selected to
occupy the positions (A
i
), previously established for
each boat. Figure 8 shows the structure of the HGMN
and Figure 9 its corresponding adjacency matrix. The
matrix was defined as a general structure of the club
management, with hyperedges/vertices for athletes
(A), coaches (T), boats (B), helmsmen (TM),
competitions (C) and directors (D).
Multilevel Hypergraphs: A Conceptual Approach for Complex System Database Modelling
93
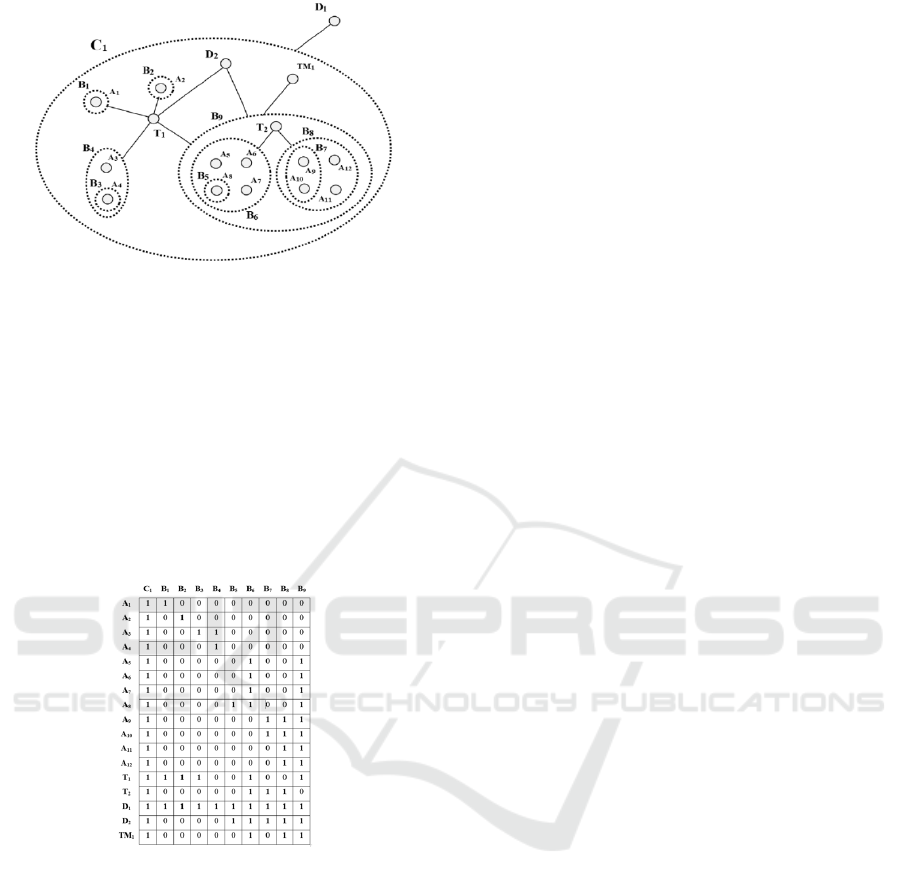
Figure 8: Illustration of the club management MLHG.
Edges indicate the various relationships established
between the entities of the club, such as the
assignment of athletes to coaches or their
participation in competitions, for example. Since we
are dealing with an MLHG, hyperedges could be
associate some relationships by inheritance, which in
turn can connect different entities, such as athletes,
coaches, competitions, and types of boats. Each entity
(hyperedge) may have several attributes and be
associated with specific relationships established
between entities.
Figure 9: The adjacency matrix of the MLHG.
Let's now take a closer look at the various entities we
defined for the club and the MLHG adjacency matrix
representing the various relationships established
between them. In the adjacency matrix, each column
corresponds to a relationship (hyperedge) between
the entities of the club, namely:
- Competition (C
1
), represents athletes, coaches
and types of boats that participate in the
competitions; they provide information that
allows for determining which athletes and
coaches are involved in each competition, and
what types of boats can be used.
- Type of boat (B
1
..B
9
), defines each of the types
of competition boats. Each type of boat has a
specific relationship with the athletes and
coaches. For example, we can identify which
athletes are assigned to each type of boat, and
which coaches are responsible for their training.
- Athlete (A
1..
A
A12
), represents the athletes of the
club; they are related to the types of boats which
they compete on and the coaches who supervise
them. The adjacency matrix defined does not
allow us to determine which athletes are in each
boat and which are their coaches.
- Coach (T
1
, T
2
), which characterizes the club's
coaches, are associated with the athletes he
supervises and the types of boats they are
involved in. This information allows us to know
how the distribution of coaches is done among
the different types of boats and athletes.
- Helmsman (TM
1
), who represents the helmsmen
of the boats; each helmsman is associated with
the various types of boats he drives and implicitly
with the athletes who are involved in each boat.
This information can be used to know its
influence on the results between different types
of boats and athletes.
- Director (D
1
, D
2
), who characterizes the
members of the club involved in the organization
and logistics of competitions and training. Their
relationships can be inferred indirectly based on
the relationships between athletes, coaches, and
competitions.
Using the MLHG presented earlier in Figure 8,
let's analyse some practical application cases.
Athletes are directly related to the types of boats
available. Each athlete is associated with one or more
types of boats, which indicates they compete in these
boats. For example, the athlete A
8
is related to the
boats B
5
, B
6
and B
9
, which means that he participates
in competitions with these three types of boats.
Coaches are directly related to the types of boats
available. Each trainer is related to one or more types
of boats, indicating supervision and training actions
on these vessels. For example, the trainer T
1
is related
to all types of boats available. The director D
1
is not
directly related to the types of boats, but rather to the
competitions. On the other hand, director D
2
is related
to boat B
9
– this boat, with eight seats, is the one that
will bring the most prestige to the club, if it is
successful in the competition. The helmsman is
related to the types of boats available, which require
his steering. For example, the helmsman TM
1
is
associated with boats B
6
, B
8
and B
9
.
ICEIS 2025 - 27th International Conference on Enterprise Information Systems
94
4.3 A Graph-Based Database
To establish a schema for a graph-based database
from the structure of an MLHG, it is important that
its creation is carried out according to the schema
presented in Figure 10, and the trees of the levels
logical structure reflect the hierarchical organization
of the all the aspects considered in the management
of the club. The MLHG framework provides a
flexible basis for representing information by
defining hierarchical dimensions. It allows for
creating a database model with different levels of
detail and complex relationships, having the ability to
represent the large number of relationships between
the club's entities.
Figure 10: The club’s graph-based database schema.
The schema for the database should be defined to
capture all relevant elements of the management of
the club, including the entities, relationships and
attributes necessary to represent the data involving
athletes, coaches, competitions, resources and other
aspects involving the club management. The scheme
depicted in Figure 10 represents the club and the
relationships between management elements.
However, it could, if necessary, include other vertices
to represent other aspects, such as the coordination of
training and competitions, or the performance of
athletes, among others. As mentioned earlier, logical
level structure trees are essential for breaking down
club management into several hierarchical layers.
Each level of the tree includes a specific set of
elements and their relationships, which allows us to
get a detailed and structured view of the management
of the club (Figure 11).
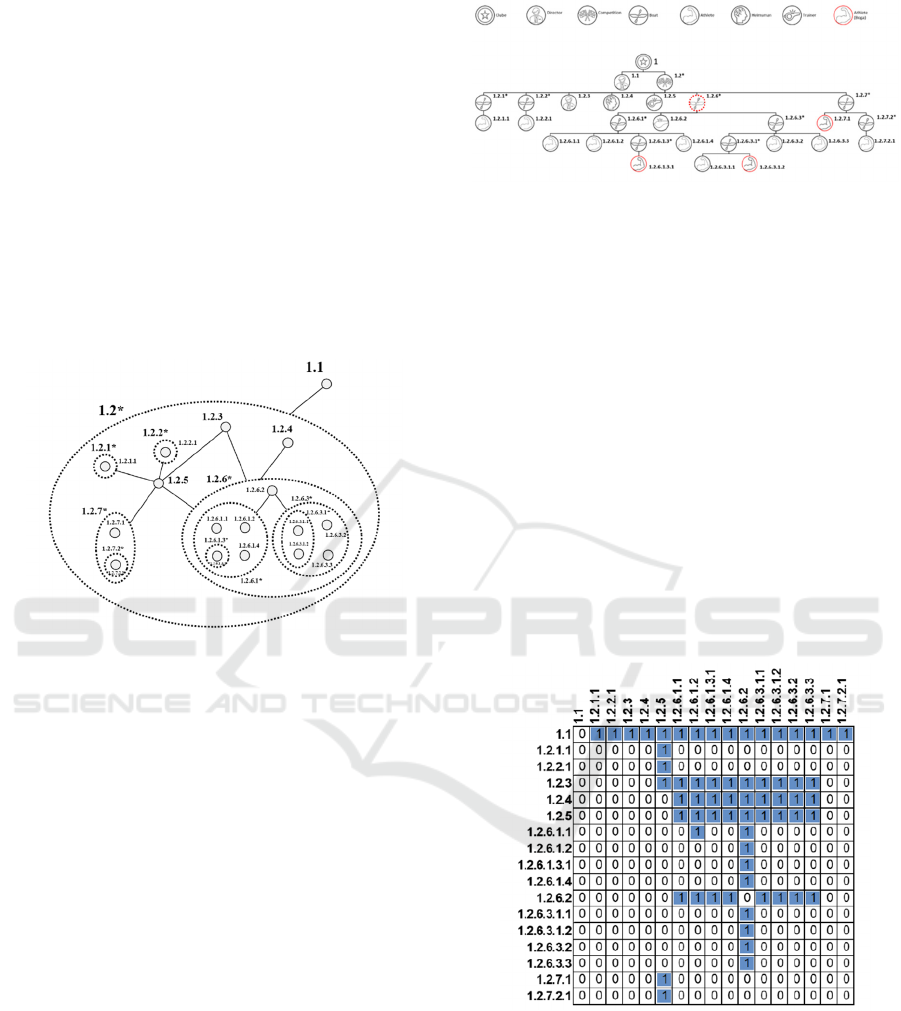
The logical framework defined for the MLHG in
the context of the modelling of the management of the
rowing club shows how the 6 levels of abstraction are
linked, from the individual level of athletes and
coaches to the level of competitions.
Figure 11: Logical structure of the club’s levels.
To create an instance of a given competition (Figure
13), after the conclusion of the aggregation process
presented in section 3, an aggregate subgraph
representative of the instance is incorporated into the
database, through its dictionaries and its adjacency
matrix, Figure 12, which at the limit, may be
coincident with the overall adjacency matrix of the
scheme. This matrix provides a visual mapping
representation of the relationships established
between the club's entities for the competition
instance. In the array, each cell indicates whether
there is a relationship between two entities. This
visual representation of relationships is essential to
understanding the connections established within the
club's organizational structure. For example, if a cell
contains a value that indicates a relationship between
an athlete and the competition, it suggests the athlete's
participation in that competition.
Figure 12: The adjacency matrix of an instance.
By associating this matrix with the formal definition
of relationships (Table 2), it is possible to establish
the labelled subgraph, as shown in Figure 14, to
support a representative instance of a particular
competition. After having typified the relationships
involved, using the MLHG adjacency matrix to
support the instantiation process of the competitions,
Multilevel Hypergraphs: A Conceptual Approach for Complex System Database Modelling
95
we can obtain the support subgraph presented in
Figure 13.
Table 2. Definition of the relationships.
Entity Relationship Description
Director RELATED_TO The person in charge to coordinate the
members of the club.
Helmsman ACCOUNTABLE The responsible for a specific set of boats
during competitions or training.
Trainer TRAINS The one that trains a specific set of athletes.
Athlete TRAINE An athlete trained by one or more coaches
specialized in a given sport.
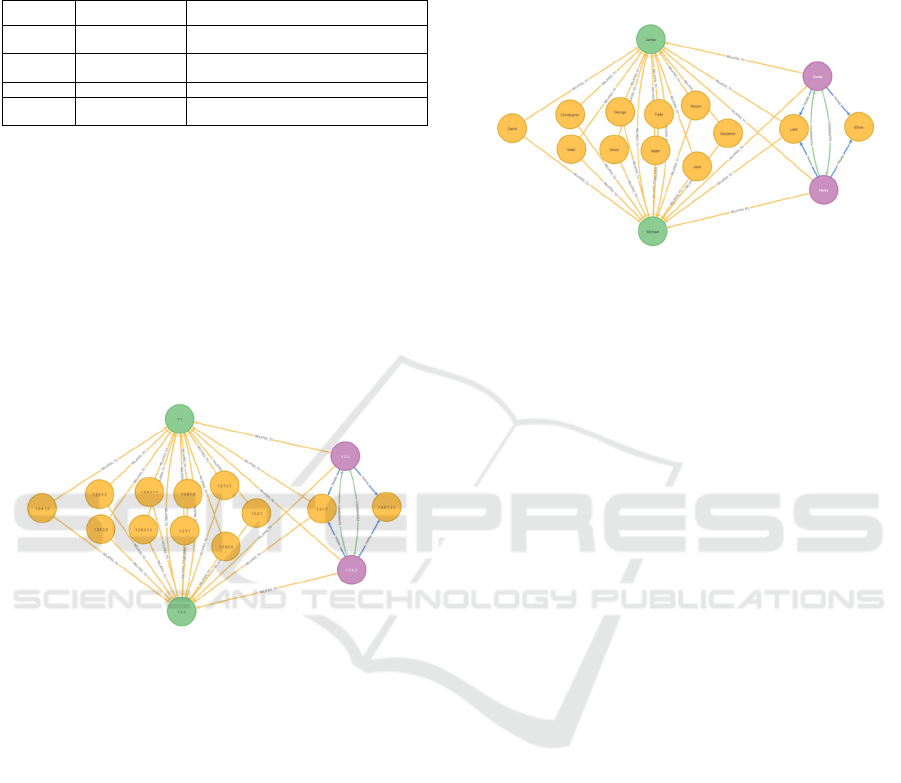
This subgraph offers a detailed view of the various
relational flows between the various entities of the
club, for a given competition, even without revealing
the identity of the athletes, coaches or directors,
where, for example, it is verified that the athlete
(1.2.6.1.3.1) relates exclusively to the two coaches
(1.2.5) and (1.2.6.2), who in turn report directly to
(1.1) and (1.2.3), your situation as an athlete. In the
final populating stage of the database, a careful
selection was made of the individuals to be included
in the database, such as athletes.
Figure 13: Support aggregate subgraph.
The athletes were chosen based on their performance
history, which includes their technical level,
endurance and physical strength. In addition to
physical capabilities, the potential of athletes was also
evaluated based on their mental capabilities, so that
we can achieve higher competitive results. The
willingness of the athletes to train and compete, along
with their commitment to the club, were also
considered as determining factors in the selection of
the athletes. This process resulted in the formation of
a very refined subgraph (Figure 14), which allows the
identification of all the participants in each
competition, where, for example, it turns out that
Ethan relates exclusively to the two coaches David
and Henry, who in turn report directly to the directors
James and Michael, his situation as an athlete.
To conclude, we want to emphasize once again
the importance of creating a graph-based database for
the club, using a HGMN model for representing the
complex relationships that can be established
between one or more entities of the club. The
database created is a robust structure to store and
organize information related to athletes, coaches,
competitions, types of boats and other essential
aspects in the management of the club.
Figure 14: Participant Aggregate subgraph.
By using a HGMN as the fundamental model of
the database, we can capture and model the
interactions and interdependencies between the
different entities of the club, which facilitates the
implementation of analysis and decision-making
processes, and provides a high-level conceptual
model of the database.
5 CONCLUSIONS AND FUTURE
WORK
The growing demand for advanced approaches for
analysing complex systems has driven to the
exploration of mathematical structures with the
ability for capturing interconnections and
interdependencies present in the various system’s
data elements. Graphs, in general, and hypergraphs,
in particular, stood out in this domain as adequate and
very versatile instruments, capable of dealing with the
complexity of the intricate way data elements are
related to (and aggregate). Graphs offer an elegant
mathematical representation for creating very
intuitive, easy-to-understand visual abstract models.
It is not surprising, therefore, that it is adopted and
applied in modelling systems requiring reliable
representations of real systems and effective
mechanisms for manipulating their data elements,
using specific languages for selecting and combining
data elements, different types of data, and other types
of data.
In this paper, we presented a new strain of
hypergraphs, as a new functional abstraction for
modelling real world problems. This kind of graphs,
MLHG, allows for receiving complex and detailed
representations of relationships between entities as
ICEIS 2025 - 27th International Conference on Enterprise Information Systems
96

well as the ability for sustaining analysis processes
along the multilevel architecture of a hypergraph.
MLHG allow for solving complex problems,
involving models with multiple functional
complexities or with irregular hierarchical groupings,
not defined initially and involving mutations evolve
over time. Their basic characteristics sustain the
definition of modular data elements hierarchies
during the construction of a system model,
performing isolated analyses on a specific set of data,
bounded between two levels of abstraction, within a
virtual vertex, and allowing handling autonomously
data element structures contained in virtual vertices,
without affecting other data elements of a specific
model.
MLHGs stand out for their ability to deal with
systems that exhibit unpredictable behaviours, in
which the so-called global properties arise from local
interactions between individual components. On the
other hand, they have great potential in large-scale
systems, helping to identify problems and improve
the performance of complex systems. It is important
that, in a near future, we develop more efficient
algorithms, and increase the understanding of
complex systems, to improve MLHG-based
solutions.
ACKNOWLEDGEMENTS
This work has been supported by FCT – Fundação
para a Ciência e Tecnologia within the R&D Units
Project Scope: UIDB/00319/2020.
REFERENCES
Daniel, G. (2013). Graph Theory. In: Runehov, A.L.C.,
Oviedo, L. (eds) Encyclopedia of Sciences and
Religions. Springer, Dordrecht.
Angles, R., Gutierrez, C. (2008). Survey of graph database
models. ACM Comput. Surv. 40, 1, Article 1, February.
Bondy, J. A., Murty (2008). U. S. R., Graph Theory,
Springer.
Biggs, N., Lloyd, E., Wilson, R. (1986). Graph Theory,
1736-1936, Oxford University Press.
Sylvester, J. (1878). Chemistry and Algebra. Nature. 17
(432): 284. Bibcode, 1878.
Kanhio, M. (2023). Scope of Graph Theory in Real Life.
http://dx.doi.org/10.2139/ssrn.4651239
Berge, C. (1967) Graphes et hypergraphes. Dunod, Paris.
Berge, C. (1973). Graphs and hypergraphs, volume 7.
North-Holland publishing com-pany Amsterdam.
Hellmuth, M., Ostermeier, L. & Stadler, P.F. (2012). A
Survey on Hypergraph Products. Math.Comput.Sci. 6,
1–32.
Voloshin, V. (2009). Introduction to graph and hypergraph
theory. Nova Science Publ. ISBN 978-1-60692-372-6.
Bretto, A. (2013). Applications of Hypergraph Theory: A
Brief Overview. In: Hyper-graph Theory. Mathematical
Engineering. Springer, Heidelberg.
Molnár, B. (2014.) Applications of Hypergraphs in
Informatics: A Survey And Oppor-tunities For
Research. Annales Universitatis Scientiarum
Budapestinensis De Rolando Eotvos Nominatae Sectio
Computatorica (Issn: 0138-9491). 42. 261-282.
Ducournau, A., Bretto, A., Rital, S., Laget, B. (2012), A
reductive approach to hypergraph clustering: An
application to image segmentation, Pattern
Recognition, Volume 45, Is-sue 7.
Konstantinova, E. V., & Skorobogatov, V. A. (2001).
Application of hypergraph theory in chemistry.
Discrete Mathematics, 235(1-3), 365-383.
Amato, F., Moscato, V., Picariello, A., Sperlí, G. (2017).
Influence Maximization in So-cial Media Networks
Using Hypergraphs. In: Au, M., Castiglione, A., Choo,
KK., Palm-ieri, F., Li, KC. (eds) Green, Pervasive, and
Cloud Computing. GPC 2017. Lecture Notes in
Computer Science, vol 10232. Springer, Cham.
Tan, S., Bu, J., Chen, C., Xu, B., Wang, C., He, X. (2011).
Using rich social media in-formation for music
recommendation via hypergraph model. ACM Trans.
Multimedia Comput. Commun. Appl. 7S, 1, Article 22
(October 2011), 22 pages.
Sarkadi-Nagy, B., Molnár, B. (2019). System Modeling by
Representing Information Systems as Hypergraphs. In:
Abramowicz, W., Corchuelo, R. (eds) Business Infor-
mation Systems. BIS 2019. Lecture Notes in Business
Information Processing, vol 354. Springer, Cham.
https://doi.org/10.1007/978-3-030-20482-2_8
Dijkstra, E. W. (1959). "A note on two problems in
connexion with graphs". Numer-ische Mathematik. 1:
269–271.
Johnson, D. B. (1977), "Efficient algorithms for shortest
paths in sparse networks", Journal of the ACM, 24 (1):
1–13..
Kuhn, H. W. (1955). "The Hungarian method for the
assignment problem". Naval Re-search Logistics
Quarterly. 2 (1–2): 83–97.
Wigh, D., Goodman, J., Lapkin, A. (2022). A review of
molecular representation in the age of machine
learning. WIREs Comput Mol Sci.
Georgios A Pavlopoulos, Panagiota I Kontou, Athanasia
Pavlopoulou, Costas Bouyiou-kos, Evripides Markou,
Pantelis G Bagos (2018), Bipartite graphs in systems
biology and med-icine: a survey of methods and
applications, GigaScience, Volume 7, Issue 4, April.
Santos, A., Colaço, A.R., Nielsen, A.B. et al. (2022). A
knowledge graph to interpret clinical proteomics data.
Nat Biotechnol 40, 692–702.
Brin, S., and Page, L. (1998). The anatomy of a large-scale
hypertextual web searchen-gine. Computer networks
and ISDN systems 30, 1, 107–117.
Multilevel Hypergraphs: A Conceptual Approach for Complex System Database Modelling
97

Neo4J (2024). Neo4J, GenAI apps, grounded in your data.
Homepage, https://neo4j.com/, last accessed
2024/12/11.
JanusGraph (2024). JanusGraph, Distributed, open source,
massively scalable graph database. Homepage,
https://janusgraph.org/, last accessed 2024/12/11.
Memgraph (2024). Memgraph, Scales to billions of nodes
and edges, and delivers real-time performance.
Homepage, https://memgraph.com/, last accessed
2024/12/11.
NebulaGraph (2024). NebulaGraph, Open Source,
Distributed, Scalable, Lightning Fast. Homepage,
https://www.nebula-graph.io/, last accessed
2024/12/11.
Schölkopf, B., Platt, J., Hofmann, T. (2007). Learning with
Hypergraphs: Clustering, Classification, and
Embedding," in Advances in Neural Information
Processing Systems 19: Proceedings of the 2006
Conference , MIT Press, pp.1601-1608.
Ouvrard, B. (2020). Hypergraphs: an introduction and
review. arXiv:2002.05014, 2020.
Molnár, B. (2014). Applications of Hypergraphs in
Informatics: A Survey and Oppor-tunities for Research.
Annales Universitatis Scientiarum Budapestinensis de
Rolando Eotvos Nominatae Sectio Computatorica
(ISSN: 0138-9491). 42. 261-282.
Ouvrard, B., Le Goff, J., Marchand-Maillet, S., (2017).
Networks of Collaborations: Hypergraph Modeling and
Visualisation.
Habib, M., de Montgolfier, F., Mouatadid, L., Zou, M.
(2022). A general algorithmic scheme for combinatorial
decompositions with application to modular
decompositions of hypergraphs. Theoretical Computer
Science, 923, 56-73.
Gao, X., Zhu, Y., Yang, Y., Zhang, F., Zhou, F., Tian, X.,
... & Chen, Y. (2022). A sei-zure detection method
based on hypergraph features and machine learning.
Biomedical Signal Processing and Control, 77, 103769.
Frieze, A., Karoński, M. (2015). Introduction to Random
Graphs. Cambridge University Press.
Ghoshal, G., Zlatić, V., Caldarelli, G., Newman, M.E.J.
(2009). Random hypergraphs and their applications.
Phys. Rev. E 2009, 79, 066118,
https://doi.org/10.1103/physreve.79.066118
Grilliette, W., Reynes, J., Rusnak, L. (2022). Incidence
hypergraphs: Injectivity, uni-formity, and matrix-tree
theorems, Linear Algebra and its Applications, Volume
634, Pages 77-105.
https://doi.org/10.1016/j.laa.2021.10.023.
Ancona, M., De Floriani, L. (1989). A hypergraph-based
hierarchial data structure and its applications, Advances
in Engineering Software, Volume 11, Issue 1, Pages 2-
11. https://doi.org/10.1016/0141-1195(89)90030-2
Lemons, N.W., Hu, B., Hlavacek, W.S. (2011).
Hierarchical graphs for rule-based modeling of
biochemical systems. BMC Bioinformatics 12, 45.
https://doi.org/10.1186/1471-2105-12-45
Scioni, E., Huebel, N., Blumenthal, S., Shakhimardanov,
A., Klotzbuecher, M., Garcia, H., & Bruyninckx, H.
(2016). Hierarchical Hypergraph for Knowledge-
centric Robot Systems: a Composable Structural Meta
Model and its Domain Specific Language NPC4. In
JOSER: Journal of Software Engineering for Robotics
(Vol. 7, Issue 11, pp. 55–74).
Yang, F., Shen, L. (2015). Reconfigurable architecture
model based on layered hyper-graph. In 2015 Chinese
Automation Congress (CAC), Wuhan, pp. 1868-1873.
https://doi.org/10.1109/CAC.2015.7382808
Bezrukova, T., Tereshkina, T., Nesterov, S., Kuksova, I.,
Pecherskaya, O. (2019). Management of transport and
logistic infrastructure of the territory: methodological
tools and their improvement, IOP Conference Series:
Materials Science and Engineer-ing, Volume 817, 28-
29 November 2019, St. Petersburg, Russia
Gu, Y., Yu, K., Song, Z., Qi, J., Wang, Z., Yu, G., Zhang,
R. (2022). Distributed Hy-pergraph Processing Using
Intersection Graphs, in IEEE Transactions on
Knowledge and Data Engineering, vol. 34, no. 7, pp.
3182-3195, 1 July.
https://doi.org/10.1109/TKDE.2020.3022014.
ICEIS 2025 - 27th International Conference on Enterprise Information Systems
98
