SPViz: A DSL-Driven Approach for Software Project Visualization
Tooling
Niklas Rentz
a
and Reinhard von Hanxleden
b
Department of Computer Science, Kiel University, Kiel, Germany
{nre, rvh}@informatik.uni-kiel.de
Keywords:
Software Visualization, Meta Modeling, Model-Driven Engineering, Reverse-Engineering.
Abstract:
For most service architectures, such as OSGi and Spring, architecture-specific tools allow software developers
and architects to visualize configurations that are usually spread through project files. Such visualization tools
are used for documentation purposes and help to understand programs. However, such tools often do not
address project-specific peculiarities, or do not exist at all for less common architectures.
We propose a DSL-driven approach that allows software architects to define and adapt their own project
visualization tool. The approach, which we refer to as Software Project Visualization (SPViz), uses two
DSLs, one to describe architectural elements and their relationships, and one to describe how these should
be visualized. We demonstrate how SPViz can then automatically synthesize a customized, project-specific
visualization tool that can adapt to changes in the underlying project automatically. We implemented our
approach in an open-source library and discuss and analyze three different tools that follow this concept,
including open-source projects and projects from an industrial partner in the railway domain.
1 INTRODUCTION
This is joint work with the industrial partner Scheidt
& Bachmann System Technik GmbH. In industry, it is
quite common to maintain large software projects for
a long duration. Maintaining a good understanding
of complex software architectures is a challenge, in
particular for new team members. Diagrams can aid
understanding concrete connections and ideas and the
broader architecture of a system (Eades and Zhang,
1996). However, it is still common practice to cre-
ate such diagrams manually. This requires significant
maintenance effort (Lientz et al., 1978) and bears the
risk of becoming inconsistent with the actual project.
One approach to combat this issue is to use
language-specific visualization tools for architecture
systems such as OSGi
1
(The OSGi Alliance, 2020;
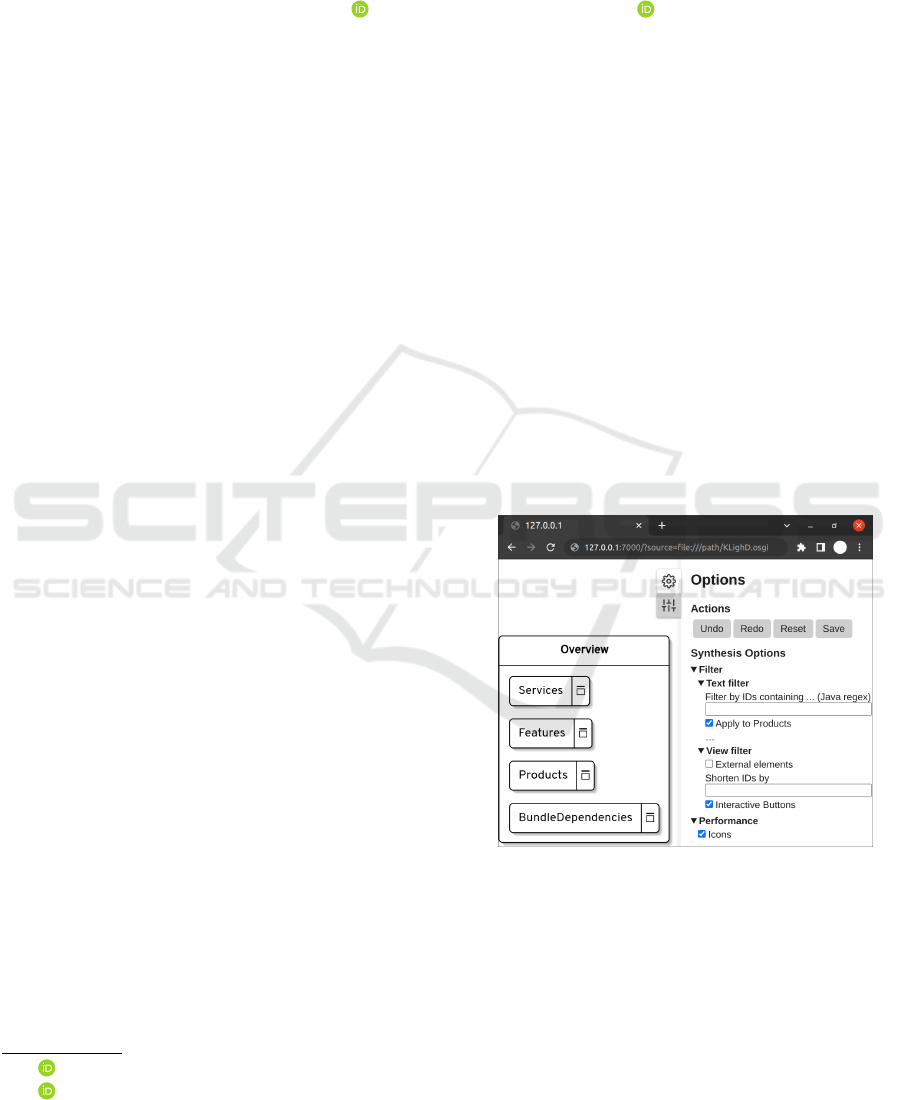
Rentz et al., 2020). For example, Figure 1, a view of
a tool generated by SPViz, provides a very high-level
view of a specific OSGi project highlighting its archi-
tecture consisting of services, features, products, and
bundle dependencies that can be browsed to provide
customizable views as shown in Section 2.
a
https://orcid.org/0000-0001-6351-5413
b
https://orcid.org/0000-0001-5691-1215
1
OSGi™ is a trademark of the OSGi Alliance in the US
and other countries.
Figure 1: Screenshot of an architecture visualization tool
synthesized by SPViz, in this example for OSGi projects.
The overviews can be interactively expanded to show con-
nections as shown in Figure 2. The view can be customized
with filters and interactive features in the open sidebar.
Architecture visualization tools provide insights
into legacy code. However, most of them are specific
for one task or project style, making them unusable
for most other projects. For each new project struc-
ture, developers will ask how project artifacts relate
to each other and which hierarchies exist, to explore
and explain the projects. Alternatively to that project-
Rentz, N. and von Hanxleden, R.
SPViz: A DSL-Driven Approach for Software Project Visualization Tooling.
DOI: 10.5220/0013356800003912
Paper published under CC license (CC BY-NC-ND 4.0)
In Proceedings of the 20th International Joint Conference on Computer Vision, Imaging and Computer Graphics Theory and Applications (VISIGRAPP 2025) - Volume 1: GRAPP, HUCAPP
and IVAPP, pages 967-974
ISBN: 978-989-758-728-3; ISSN: 2184-4321
Proceedings Copyright © 2025 by SCITEPRESS – Science and Technology Publications, Lda.
967
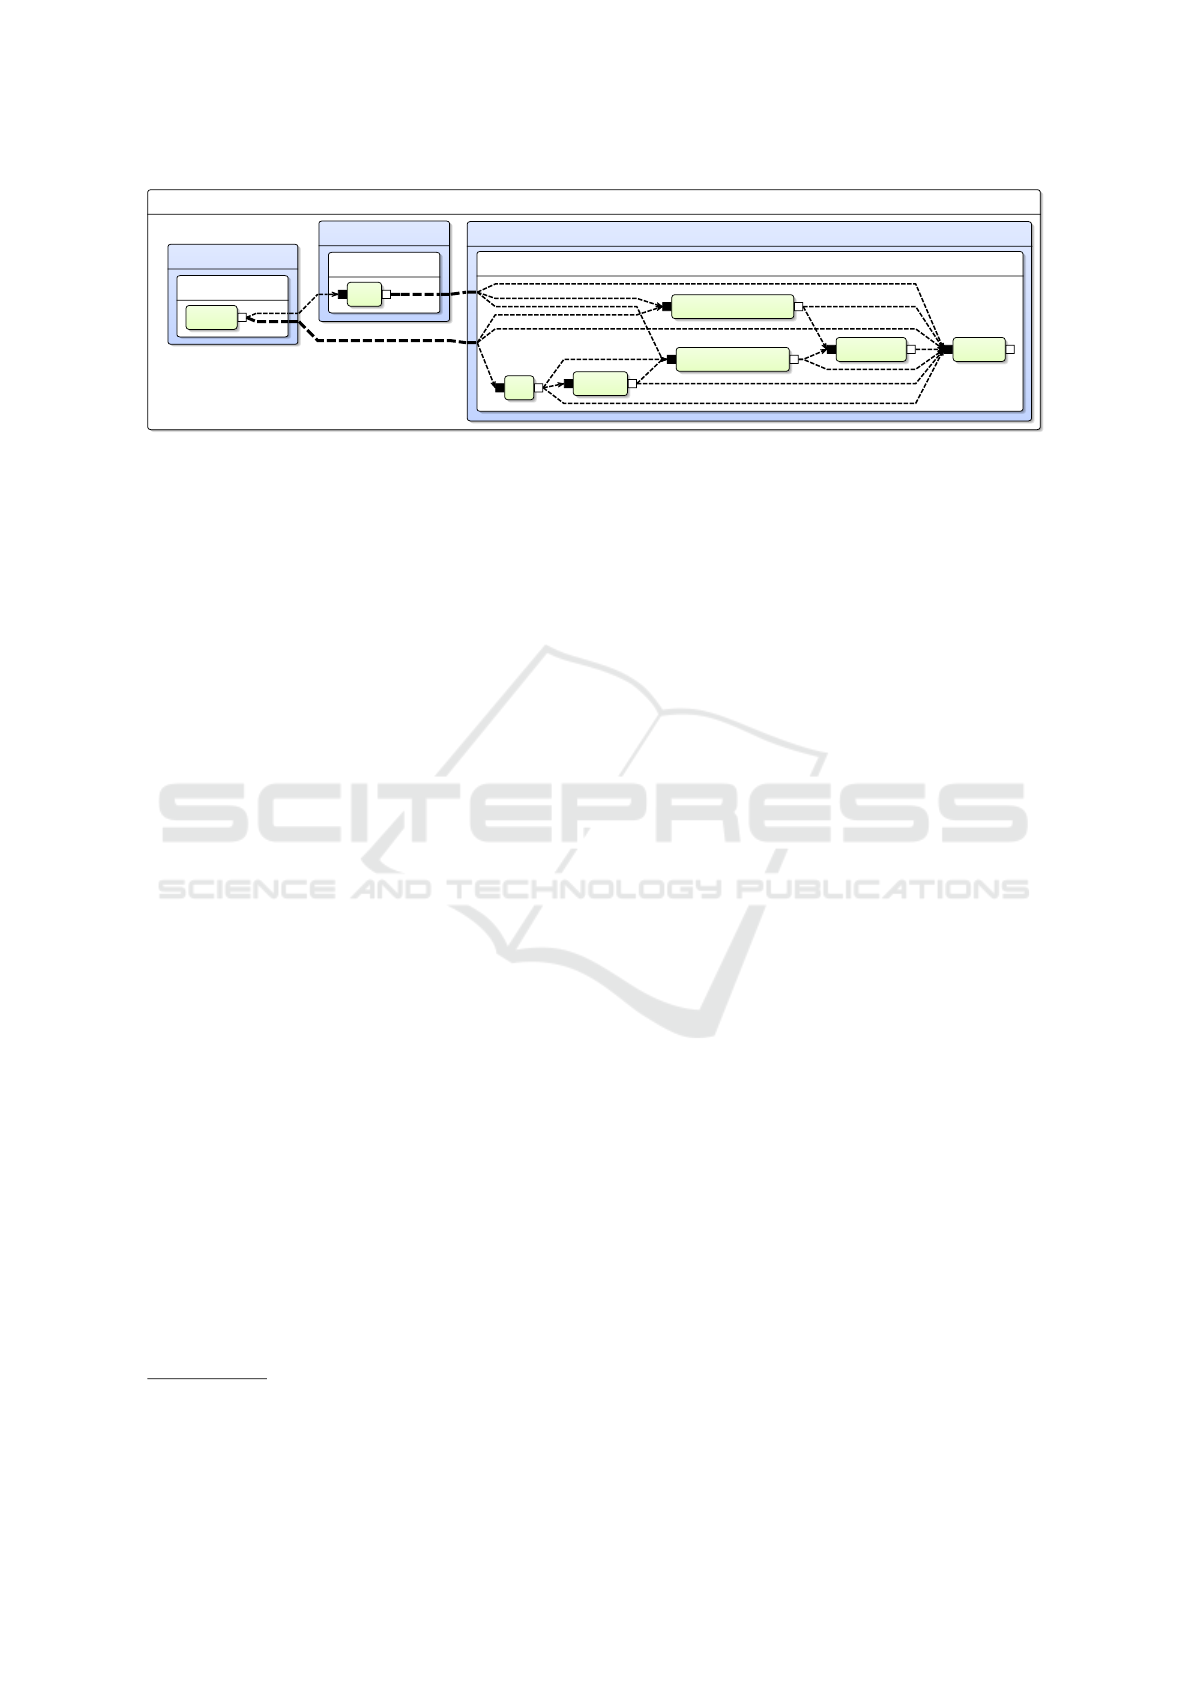
Features
...ide.feature
BundleDependencies
...ide
...feature
BundleDependencies
de.cau.cs.kieler.klighd
...kgraph
...krendering.extensions
...krendering
...ui
...piccolo
...view.feature
BundleDependencies
...ui.view
Figure 2: View of the internal bundle dependencies originating from the ui.view bundle of the KLighD
2
project, synthesized
by the tool generated by SPViz based on structural and visual descriptions in Figures 5 and 6.
specific approach, one may use tools that support very
generic visual languages such as defined in the UML
standard. As stated by a survey (Lange et al., 2006),
such languages can be used and understood by many
developers, architects, and other users of code. How-
ever, such generic techniques may fail to be specific
enough to describe the needs of domain experts and
require too much manual effort to yield pleasing and
meaningful diagrams.
In the current state of the practice, for projects
where no good specific tools exist and architects do
not want to use the traditional way of using manu-
ally designed UML diagrams, they need other tool
support. Thus, the research question we address in
this paper is: How can one create customized archi-
tecture visualization tools with minimal effort. In
answer to that question, we propose a Domain Spe-
cific Language (DSL)-driven approach, referred to as
Software Project Visualization (SPViz). SPViz uses
project meta modeling with two DSLs, one to de-
scribe architectural elements and their relationships,
and one to describe how these should be visualized.
Provided with such architecture and visualization de-
scriptions, we propose to automatically synthesize a
customized, project-specific visualization tool. We
have validated this approach with an open-source li-
brary, also termed SPViz
3
. An initial view for further
configuration of a concrete architecture visualization
tool synthesized by SPViz is shown in Figure 1.
Our previous work (Rentz et al., 2020) pro-
poses a visualization tool specific to OSGi architec-
tures, which follows the modeling pragmatics ap-
proach (Fuhrmann and von Hanxleden, 2010). This
previous work only works for a single architecture
and therefore lacks the applicability to other architec-
tures. SPViz automates the process of designing such
tools and adapts the concepts to arbitrary architec-
2
https://github.com/kieler/klighd
3
https://github.com/kieler/SoftwareProjectViz/tree/
ivapp25
tures. A dependency hierarchy of an example OSGi
project, where the visualization tool was generated by
SPViz, can be seen in Figure 2.
Outline: In Section 2 we recapitulate the visual-
ization and interaction style proposed in our previous
work (Rentz et al., 2020). Next, we cover the main
contributions:
• We present the SPViz approach via two DSLs that
describe arbitrary architectures and their visual-
ization as a generalization of the OSGi visualiza-
tion tool in Section 3.
• We propose how to automatically generate a com-
plete visualization tool akin to the OSGi visual-
ization using DSLs in Section 4.
• We illustrate the DSLs using example projects,
both open source and ones from industrial part-
ners, and present feedback in Section 5.
We compare related work in Section 6, discuss threats
to validity in Section 7 and conclude in Section 8.
More details can be found in a long form of this pa-
per (Rentz and von Hanxleden, 2024).
2 VISUALIZING SPECIFIC
PROJECT ARCHITECTURES
In our previous work (Rentz et al., 2020), we pre-
sented a visualization tool specific to the OSGi archi-
tecture to aid developers understand legacy projects
and to document actively developed systems. The use
of the diagrams, according to the previous paper, al-
lows users to move from manually drawn diagrams
such as UML to automatically created diagrams that
are useful for system documentation purposes. The
visualization tool utilizes the tooling of the KIELER
Lightweight Diagrams (KLighD) framework (Schnei-
der et al., 2013) with automatic layout by the Eclipse
Layout Kernel (ELK) (Domr
¨
os et al., 2023). KLighD
provides a visualization of OSGi projects given a
IVAPP 2025 - 16th International Conference on Information Visualization Theory and Applications
968
Project
Project Model (PM)
Architecture Meta Model (A2M)
Architecture Meta Meta Model (A3M)
View
View Context Model (VCM)
View Context Meta Model (VC2M)
View Context Meta Meta Model (VC3M)
klighd.osgi
osgi.spvizmodel
klighd-all-deps.osgiviz
osgiviz.spviz
is a
is a
is a
is a
uses data
uses data
KLighD
is a
represented by
Fig. 2
is a
SPViz
defines
defines
represented by
conforms to
conforms to
conforms to
conforms to
Figure 3: The meta modeling hierarchy of SPViz. The shaded top is our proposed abstraction, the center contains examples
for the different models.
View
Context Model
(VCM)
Project Model
(PM)
Data
View
Layout &
Rendering
(ELK & KLighD)
Modify
Interactively
Filtering
PM File
VCM File
Persist Models
Figure 4: The usage process of the view tools with its core,
the view context model. It is used to configure and filter
views for later reuse. Solid arrows depict data flow, dashed
ones the interaction paths to control the VCM. Adapted
from (Rentz et al., 2020).
model synthesis, which is implemented in that tool.
This visualization uses node-link diagrams to repre-
sent structural relationships between architectural ar-
tifacts. This follows the graph-based visualization
technique, a term coined in a literature review of soft-
ware visualization (Shahin et al., 2014).
The view context model (VCM), depicted in Fig-
ure 4, is the central model for interaction with the
tool by modifying and filtering views to be reusable
for documentation purposes in evolving (software)
projects. This model is entirely hidden from the user
and only modified by interaction with the UI. The
project model (PM) contains the extracted data of a
concrete project, here for an OSGi project. It is the
data source of the VCM and describes the project at
its state in time when the PM was generated. The
PM conforms to the meta model of the OSGi archi-
tecture, therefore we also call this the architecture
meta model (A2M). It models all possible PMs for
OSGi projects. A VCM is created the first time a PM
should be visualized. Together with the model syn-
thesis and KLighD, this allows visually browsing dif-
ferent views sensible in the OSGi environment.
Figure 1 shows the view of such an initial VCM.
Any interaction with the view via the options, filters,
or the UI modifies the VCM to reflect the currently
shown and connected elements. Figure 2 is a view
with a pre-configured VCM investigating the KLighD
framework, which also uses OSGi as its project archi-
tecture. The view is configured to focus on the fea-
tures view to show all bundles that are directly or in-
directly required by its ui.view bundle in context of
the unique features that contain the bundles. All con-
nections of the project as defined in the A2M and con-
figured to be shown in the meta model for the VCM,
the view context meta model (VC2M), can be inter-
actively added or removed to show any hierarchy.
As mentioned before, the VCM and with that the
view can be modified via interaction with the views.
We added some new filtering and interactions to tools
generated by SPViz compared to the OSGi tool, such
as showing/hiding the collapsed artifacts, connect-
ing artifact connections recursively, and removing all
connections from an artifact.
Overall, this previous work (Rentz et al., 2020)
can be used for OSGi projects, but lacks usage for
any other architecture. We now generalize this tool
and make it applicable to arbitrary architectures.
3 THE SPViz DSLs
To allow domain experts to conceptualize a visualiza-
tion for software projects following arbitrary archi-
tecture meta models (A2Ms), we define meta meta
models to describe the general structure of a soft-
ware architecture and an abstract way to visualize that
architecture. We illustrate the meta modeling hier-
archy of visualization tools relative to our previous
work (Rentz et al., 2020) with our proposed abstrac-
tion in Figure 3. Section 2 explains the project, view,
and their respective project model (PM) and view con-
text model (VCM). We name the meta model that de-
scribes the architecture the architecture meta model
(A2M), and the meta model that describes the possi-
ble types of shown connections and views the view
context meta model (VC2M). This section introduces
two DSLs in which such A2Ms and VC2Ms can be
defined, thus making the DSLs themselves an archi-
tecture meta meta model (A3M) and a view context
meta meta model (VC3M). This paper gives a small
overview of the DSLs using an example. More de-
tails and more and longer examples can be found in
SPViz: A DSL-Driven Approach for Software Project Visualization Tooling
969

// name of the architecture is OSGi
SPVizModel O SGi {
// the artifacts the project contains
Fea t ure {
// features structure the bundles
contains B u ndl e
}
Bun d le {
// bundles may connect to other
// bundles as a connection
// called "Dependency"
Depe n d ency connects Bun d le
} }
Figure 5: Example A3M DSL usage.
the corresponding long form of this paper (Rentz and
von Hanxleden, 2024), the SPViz repository, and the
examples repository
4
on GitHub.
3.1 The Architecture Meta Meta Model
Domain experts can define a model of their project
architecture (an A2M) using our architecture meta
meta model (A3M) DSL. All project structures are
different in their concrete realization in the sense of
which files and which configurations define the under-
lying project. However, in an abstract sense projects
always contain different artifacts and references be-
tween these artifacts. Artifacts can be coarse- or fine-
grained parts of a software system such as entire prod-
ucts, features, classes, or even statements, which may
refer to other artifacts. References can be further spe-
cialized into connections, e.g. dependencies connect-
ing different artifacts, and containments, e.g. some
product artifact containing a set of packages. We de-
fine these components as the A3M. The A3M can be
applied to any architecture to show how all its differ-
ent artifacts relate to each other. This concept is com-
parable to other meta models used for Model Driven
Engineering (MDE) such as the Meta Object Facil-
ity (MOF) (Object Management Group, 2019), in a
simplified version.
Figure 5 shows an example use of the A3M DSL
to describe a simplified OSGi architecture A2M. The
information in the example consists of the name, ar-
tifacts, their hierarchy, and connections. The result-
ing meta model describes coarse- and fine-granular
artifacts of the OSGi architecture modeling bundle
dependencies and classifications in features. Blocks
within the SPVizModel block define the artifacts that
the architecture contains, here features and bundles.
In this example, the features are structured by the bun-
dles that they contain.
4
https://github.com/kieler/
SoftwareProjectViz-examples/tree/ivapp25
// refer to the "OSGi" model above
import "osgi.spvizmodel"
// the visualization name
SPViz O S GiVi z {
// the available views for OSGiViz
// view for bundle dependencies
Bundle D e p endenc i e s {
show OSGi . Bu ndl e
connect O SGi . Bun dle . D e pend e ncy
}
// view of features, for filtering
Feat u res {
show O SGi . Fea t ure
// category connection of features
connect O SGi . Bun dle . D e pend e ncy via
OSGi . F eatu re in B u n dleDe p e n d encie s
}
// features can show artifact views
OSGi . F eatu re shows {
// inner views as defined above
Bundle D e p endenc i e s with {
// bundles contained in feature
OSGi . B und le from OSG i . F eatu re
>OSGi . Bund le
} } }
Figure 6: Example VC3M DSL usage, referring to the ex-
ample in Figure 5.
PM instances of this OSGi A2M describe infor-
mation of the structure of concrete projects to model
dependencies between bundles from the project itself
and external ones.
3.2 The View Context Meta Meta Model
The view context meta meta model (VC3M) makes it
possible to define which of the artifacts and their con-
nections from a A2M should be visualized in different
views. Typically, not all possible connections should
be shown in any view, and not all artifacts of the same
type should be in the same view part. Just showing
everything at once is typically not the best visualiza-
tion for project structures, but filtered subsets are.
Continuing the OSGi example, Figure 6 shows a
possible use of the VC3M DSL to describe a VC2M
for the OSGi A2M. The example defines a new vi-
sualization for the OSGi architecture called OSGiViz
and defines what views can be shown in general, as
well as how artifacts can reuse these views to filter
views. The view called bundle dependencies clarifies
that the artifacts and the connections related to it from
the underlying OSGi model should be shown. An ex-
ample view of the bundle dependencies can be seen
inside the features in Figure 2. The view named fea-
tures shows an overview of all possible features and a
category connection.
Through configuration of an artifact view, the fea-
IVAPP 2025 - 16th International Conference on Information Visualization Theory and Applications
970
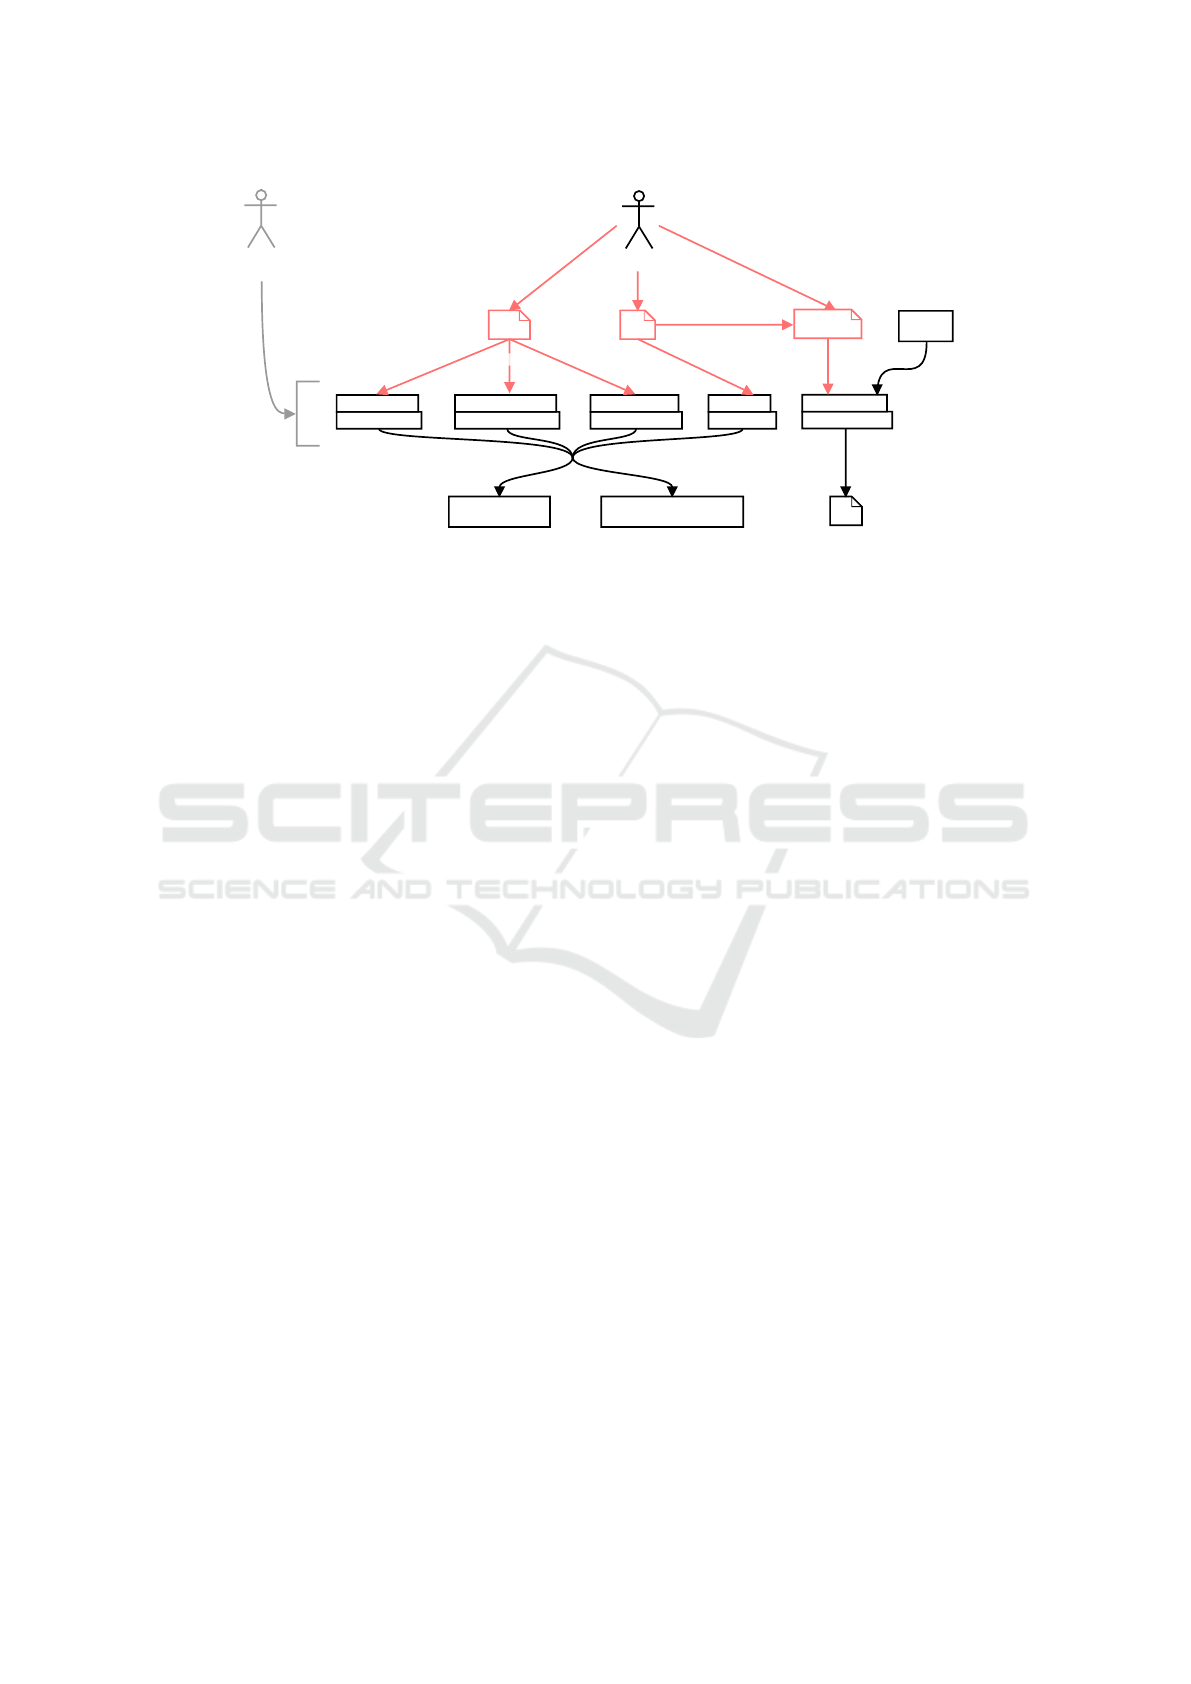
Architect
VC2M A2M
PM Generator
Template
Build System Language Server Visualization EMF Model
Project
PM
Eclipse Plug-Ins Standalone Application
generates
packages into
generates template
writes
writes
completes by programming
(or uses different tool)
packages into
input
output
generates
programs
all of
Architect
Figure 7: Traditional (left, gray) and proposed (red) process for developing a new software project visualization tool. A2M
and VC2M are written in the DSLs proposed here. Boxes represent files, software packages, and applications in UML style.
tures displayed in their overview show filtered bundle
dependency views specific to the individual features
defined within an OSGi project. In this example it
means that all bundles are shown that are listed in the
feature’s child bundles. This way, whereas a general
view for bundle dependencies would show all bundles
as they are used and defined in the whole project, the
feature-specific artifact view for bundle dependencies
shows the filtered view, only with bundles relevant for
the feature. Figure 2 illustrates this, as the bundle de-
pendencies view in each feature only shows the bun-
dles view that the feature contains.
The category connection defined in the features
view makes it possible to show a relation between fea-
tures, although the OSGi A2M does not define any
direct connections for features. Because features con-
tain bundles, which themselves define the bundle de-
pendencies connection, this category connection en-
ables showing the relation between the features in
terms of their bundle dependencies. That is, a con-
nection between features will be shown, if a bundle
contained in one feature has a connection to a bun-
dle contained in another feature. In Figure 2, the view
and ide features have a shown dependency, because
the ui.view bundle within the view feature has a de-
pendency to the ide bundle within the ide feature.
4 PROJECT VISUALIZATION
TOOL SYNTHESIS
Figure 7 shows the proposed development process for
software architects who want to apply the visualiza-
tion technique from our previous work (Rentz et al.,
2020) to their project. They need to describe the ar-
chitecture and its visualization as described in Sec-
tion 3 and extract information about the real artifacts
of the project on their file system into a PM. To de-
sign the models, questions such as ‘What connections
and hierarchies in the code should be made visible?’
and ‘What kinds of artifacts are related to the con-
nections?’ need to be answered. This first layer of
modeling a visualization and the architecture is the
main task of an architect when using SPViz. Tradi-
tionally, the architect does not have access to this first
layer and needs to develop all code in the second layer
manually or use an entirely different approach.
4.1 Visualization Framework
Generated from the DSLs
Our implementation of the SPViz approach separates
the generated visualization into multiple parts. This
code generation is the second layer of steps in Fig-
ure 7 and will be automatically executed when de-
veloping the DSLs in Eclipse or manually triggered
in the SPViz CLI. Once the user is finished design-
ing their A2M, SPViz will create an Eclipse Modeling
Framework (EMF) model of that A2M.
The second part created by SPViz is a template
for a PM generator. The template is a complete pro-
gram with a dependency on the generated EMF model
of the A2M. It comes with a Maven build, which
can bundle it into an executable. The template con-
tains a file ReadProjectFiles.java which is missing
the architecture-specific extraction of data from the
project’s sources. It provides methods to create and
connect all artifacts as defined in the A2M as well
as a checklist of all artifacts, connections, and con-
tainments that need to be extracted in the genera-
tor. Examples described in Section 5 implement this
template to show its feasibility. Alternatively, an ex-
SPViz: A DSL-Driven Approach for Software Project Visualization Tooling
971

tractor can be a separate program or tool. Our API
requires an EMF model instance in the open XML
Metadata Interchange (XMI) format, which can be
implemented by any tool. This open format allows
other code mining and reverse engineering tools to
work together with our A2M and therefore with the
visualization tool.
Once the user is finished designing their possible
views in the VC2M, SPViz will create four more mod-
ules: the EMF model and code to support that VC2M
that yields a visualization using the KLighD frame-
work (Schneider et al., 2013), a language server to en-
able viewing KLighD diagrams in web environments,
as well as a Maven build system. This contains con-
figurations to package either as Eclipse plug-ins or as
a standalone application to be used together with the
KLighD CLI
5
in any web environment.
5 PRELIMINARY EVALUATION
AND VALIDATION
We evaluate our proposed concept in two ways. First,
we show its flexibility and usability for diverse project
architectures by realizing five different A2Ms and
VC2Ms via the DSLs, motivated by open source
projects and projects developed by our industrial part-
ner. For each resulting tool, we evaluate the tool us-
ability with these open source and industrial projects.
This paper only presents the OSGi example, the
other examples are detailed in the paper’s long ver-
sion (Rentz and von Hanxleden, 2024) and the SPViz
examples repository.
Second, we evaluate user stories for different user
groups of SPViz and asked two users of different
projects of our industrial partner for feedback on their
goals with the generated project visualizations and
their successes and criticisms.
5.1 Testing with Real-World Examples
We answered the design questions as mentioned in
Section 4 for five different project architectures and
modeled the A2Ms and VC2Ms accordingly. As some
examples are rather specific on the project configu-
rations, e.g. being for a specific build and depen-
dency system with a specific Dependency Injection
(DI) framework, they do not directly apply to most
other projects. However, they are easily configurable
and combinable, so that tools working for other archi-
tectures with their specific use cases are built quickly.
5
https://github.com/kieler/klighd-vscode
OSGi. For the OSGi visualization, the created mod-
els aim to visualize dependencies within the module
layer and service relations within the service layer of
the OSGi specification (The OSGi Alliance, 2020).
The example, which is slightly extended compared to
the OSGi example from Figures 5 and 6, also uses
products to further organize the individual compo-
nents and introduces visualizations for relations be-
tween service artifacts.
This example was verified with a project from our
industrial partner, as well as the KLighD and Seman-
tics frameworks of the KIELER
6
project. The partner
project consists of 144 bundles plus 109 additional de-
pendent bundles, as well as 285 service artifacts. The
KLighD and Semantics frameworks consist of 25 plus
196 bundles and 166 plus 144 bundles, respectively.
An example view of this is shown in Figure 2.
5.2 User Stories and Industry Feedback
SPViz can be used by varying user groups with dif-
ferent goals and desires for a tool solution. Next, we
present and analyze three such groups and their im-
plications for the tool design.
As a first user group we identify the software de-
velopers, or end users. They want to learn and un-
derstand the system they are developing to be able to
improve and extend it. For this, they need reliable and
up-to-date information about the system and a way to
filter that information to some context. Furthermore,
the effort for acquiring such information should be
low. A technical solution for the software developers
should allow for different representations (Malavolta
et al., 2013). The information should furthermore up-
date automatically, for example by integration into the
build process, to lower the effort to use the solution
and always have up-to-date information. Finally, the
solution should be close to or integrated into their de-
velopment IDE or the documentation (Charters et al.,
2003) to avoid bloating their workflows.
In the second user group we identify the technol-
ogy experts as the tool designers for individual archi-
tectures. They need a tool that is tailored to their do-
main technology (e.g. OSGi). If there is no such tool,
or a tool is not specific enough, development of a new
one should be a one-time-effort with low maintenance
cost. A solution should therefore enable experts to
convert their domain knowledge into a usable tool and
extract the data from the underlying project. Its setup
should furthermore be easy and understandable and
work with any technology.
Lastly, we identify the software architects as a
third user group. They need to be able to configure
6
https://github.com/kieler
IVAPP 2025 - 16th International Conference on Information Visualization Theory and Applications
972

views and highlight parts of projects. They also want
to integrate such views in the documentation and pre-
sentations to train new developers. Their solution re-
quirement is that views should be interactively con-
figurable, that this configuration can be persisted and
that views based on such a configuration automati-
cally update to changes in the underlying system.
Users can be in multiple of these groups and there-
fore require a combined solution. We gathered feed-
back from our industrial partner on the usage of the
OSGi and a further Maven + Spring DI example, be-
ing applied to internal projects. We interviewed two
participants, the product owner and one of the archi-
tects of the projects, which are summarized here. One
of them fits in the software architect and partly in the
software developer user group, while the other fits in
the technology expert and software architect groups.
One visualization goal the participants want to
solve is to explore the modules of their architecture
to get an overview, either overall or from some spe-
cific view point. Another goal is to explain the archi-
tecture and specific hierarchies to others by creating
architectural descriptions, without the need to update
such descriptions manually. Both participants stated
that previously such diagrams were crafted and up-
dated by hand. While there are many visualizations
out there, this shows that at least for this question-
naire the architects were not happy with what they
used so far. Other tools did not provide exactly what
was required, because they were not usable as well, or
because the architects did not find the right tool yet.
Both had the problem that views for larger projects
start to require more effort to use and that clustering or
pooling of artifacts into categories can induce a bet-
ter hierarchical view on parts of the system. This is
especially the case when there are many artifacts of
the same type being visualized in the same view. The
artifact views and category connections we described
help to find the right context, as long as the model pro-
vides context via some categorizations. This indicates
that diagram layouts can become a little too large for
what is shown, which will be solved in future work.
Overall, their feedback indicates that the tool can
and already has been used to understand parts of dif-
ferent system architectures. Some improvements re-
garding the actual views and their interaction can be
added, though that does not impair the proposed ap-
proach to create visualizations for any project.
6 FURTHER RELATED WORK
Architectures of projects are often described by Ar-
chitecture Description Languages (ADLs) in the liter-
ature. Medvidovic and Taylor (Medvidovic and Tay-
lor, 2000) classify and describe the use of ADLs in
general. Our approach is not an ADL, but a way to de-
fine project-specific architecture descriptions to cre-
ate an easier step-in into generating project-specific
visualizations, or a meta ADL. SPViz can be used for
existing software architectures and ADLs.
Architecture can also be visualized with visualiza-
tion tools and DSLs such as VizDSL (Morgan et al.,
2017) or one of the tools compared in a survey (Mc-
Nutt, 2023). While their DSLs can also create sim-
ilar visualizations for any architecture, the visual-
ization structure has to be manually defined in their
meta model. With SPViz the user only has to define
an architecture model and filtering for the visualiza-
tion, the visualization structure is generated instead
of manually defined. However, these DSLs also work
for diagram types other than node-link diagrams.
Nimeta (Riva, 2004) is a tool for architecture re-
construction based on views. They build graphical
views based on so-called view-points for arbitrary de-
scriptions. They clearly split the data extraction from
the visualization step to allow different tools to visu-
alize the same data, whereas we with SPViz integrate
the architectural description in the view descriptions,
allowing for further filtering based on the architecture.
Another term under which visualizing architec-
ture is understood is the reconstruction of software
architecture from the area of reverse engineering.
One approach uses the Knowledge Discovery Meta-
Model (KDM) to describe legacy projects to visualize
them (El Boussaidi et al., 2012), while other use clus-
tering algorithms to try to infer architectural mean-
ing from otherwise non-structured code (Riva, 2004;
Wiggerts, 1997). We think approaches like these are
a good way to reverse engineer unstructured legacy
code which can be combined with our visualization
techniques, if they can output the results in a parsable
format for some PM generator.
7 THREATS TO VALIDITY
To address threats to validity of the industry feedback,
that part of the evaluation is not intended to be the
final study to validate the usability of our proposed
SPViz tool. The questionnaire was not structured in a
controlled manner and is meant to be viewed as an
initial argument towards showing the usefulness of
SPViz for generating customized visualization tools.
We currently study the SPViz approach in all identi-
fied user groups as our industry partner further inte-
grates SPViz into other architectures to validate the
usefulness of the approach and its visualizations.
SPViz: A DSL-Driven Approach for Software Project Visualization Tooling
973

8 CONCLUSION
SPViz is a new approach for software architects to
quickly create a visualization tool they can use to
explore any otherwise obscure architecture. The ap-
proach lets users create automatically updating archi-
tectural views for documentation purposes and ex-
plain relations to others. We built a tool follow-
ing this approach to generalize visualizing, explor-
ing, and documenting OSGi projects to arbitrary soft-
ware architectures, highlighting the usability of such
a concept. The visualizations use state-of-the-art and
well-accepted views on connections within software
systems such as dependencies and service structures.
We compared the tool to other meta modeling tools
and architectural visualizations, such as ADLs, which
usually require projects to adapt to. We do not re-
quire projects to use any specific architecture, but sup-
port the description of the architecture for any project.
SPViz can be used as a visualization tool generator for
legacy systems to visualize specific parts that other
tools do not cover. It can also be used to quickly set
up a visualization for new and emerging languages
and system structures. To be applicable to projects
that have no real own architecture and are just a col-
lection of source files, a combination with other tools
that cluster and organize specific artifacts is recom-
mended.
Overall, the tool has been used and evaluated on
multiple projects, showing its benefits. However,
some areas can still be improved in future research
to widen the use cases of this architecture-agnostic
software visualization tool generator.
REFERENCES
Charters, S. M., Thomas, N., and Munro, M. (2003). The
end of the line for software visualisation? In Proc. 2nd
IEEE International Workshop on Visualizing Software
for Understanding and Analysis (VISSOFT), pages
110–112, Amsterdam, The Netherlands. IEEE.
Domr
¨
os, S., von Hanxleden, R., Sp
¨
onemann, M., R
¨
uegg,
U., and Schulze, C. D. (2023). The Eclipse Layout
Kernel. CoRR, abs/2311.00533.
Eades, P. and Zhang, K. (1996). Software Visualisation, vol-
ume 7 of Software Engineering and Knowledge Engi-
neering. World Scientific, Singapore.
El Boussaidi, G., Belle, A. B., Vaucher, S., and Mili,
H. (2012). Reconstructing architectural views from
legacy systems. In 2012 19th Working Conference on
Reverse Engineering, pages 345–354. IEEE Computer
Society.
Fuhrmann, H. and von Hanxleden, R. (2010). On the prag-
matics of model-based design. In Proceedings of the
15th Monterey Workshop 2008 on the Foundations
of Computer Software. Future Trends and Techniques
for Development, Revised Selected Papers, volume
6028 of LNCS, pages 116–140, Budapest, Hungary.
Springer.
Lange, C. F. J., Chaudron, M. R. V., and Muskens, J. (2006).
In practice: UML software architecture and design de-
scription. IEEE Software, 23(2):40–46.
Lientz, B. P., Swanson, E. B., and Tompkins, G. E. (1978).
Characteristics of application software maintenance.
Communications of the ACM, 21(6):466–471.
Malavolta, I., Lago, P., Muccini, H., Pelliccione, P., and
Tang, A. (2013). What industry needs from architec-
tural languages: A survey. IEEE Transactions on Soft-
ware Engineering, 39(6):869–891.
McNutt, A. M. (2023). No grammar to rule them all:
A survey of json-style dsls for visualization. IEEE
Transactions on Visualization and Computer Graph-
ics, 29(1):160–170.
Medvidovic, N. and Taylor, R. N. (2000). A classification
and comparison framework for software architecture
description languages. IEEE Transactions on Soft-
ware Engineering, 26(1):70–93.
Morgan, R., Grossmann, G., and Stumptner, M. (2017).
VizDSL: Towards a graphical visualisation language
for enterprise systems interoperability. In 2017 In-
ternational Symposium on Big Data Visual Analytics
(BDVA), pages 1–8.
Object Management Group (2019). Meta Object Facil-
ity (MOF) Core Specification, Version 2.5.1. https:
//www.omg.org/spec/MOF/2.5.1/PDF.
Rentz, N., Dams, C., and von Hanxleden, R. (2020). Inter-
active visualization for OSGi-based projects. In 2020
Working Conference on Software Visualization (VIS-
SOFT), pages 84–88, Adelaide, Australia. IEEE.
Rentz, N. and von Hanxleden, R. (2024). SPViz: A
DSL-driven approach for software project visualiza-
tion tooling. CoRR, abs/2401.17063.
Riva, C. (2004). View-based Software Architecture Recon-
struction. Dissertation, Technische Universit
¨
at Wien.
Schneider, C., Sp
¨
onemann, M., and von Hanxleden, R.
(2013). Just model! – Putting automatic synthe-
sis of node-link-diagrams into practice. In Proceed-
ings of the IEEE Symposium on Visual Languages and
Human-Centric Computing (VL/HCC ’13), pages 75–
82, San Jose, CA, USA. IEEE.
Shahin, M., Liang, P., and Ali Babar, M. (2014). A system-
atic review of software architecture visualization tech-
niques. Journal of Systems and Software, 94:161–185.
The OSGi Alliance (2020). OSGi Core Release 8 Specifica-
tion. https://docs.osgi.org/download/r8/osgi.core-8.0.
0.pdf.
Wiggerts, T. A. (1997). Using clustering algorithms in
legacy systems remodularization. In Baxter, I. D.,
Quilici, A., and Verhoef, C., editors, Proceedings of
the Fourth Working Conference on Reverse Engineer-
ing, pages 33–43. IEEE Computer Society.
IVAPP 2025 - 16th International Conference on Information Visualization Theory and Applications
974
