
Optimizing Morphological Design in High-Density Residences in
Hong Kong to Enhance Mental Health
Zijun Wang
School of Landscape Architecture, Beijing Forestry University, China
Keyword: High-Density Urban Living, Mental Well-Being, Urban Morphology, Visual Exposure, Thermal Comfort,
Wallacei Optimization.
Abstract: This study addresses the challenges of enhancing mental well-being in high-density residential environments,
with a specific focus on Hong Kong. Employing a 3D model in Rhino and parametric design in Grasshopper,
we used the Wallacei plugin for multi-objective optimization to balance four critical factors—visual exposure,
direct sun hours, Universal Thermal Climate Index (UTCI) standard deviation, and building volume—across
four building typologies: East-West oriented dot-and-row forms, North-South oriented dot-and-row forms,
crossing layouts, and loop-shaped layouts. This process generated six locally optimal configurations for each
typology. We then examined how variations in building morphology and street configurations influenced
these factors and, in turn, emotional responses. The results indicate that wider streets and a greater number of
street intersections enhance visual emotional impact, while narrower streets yield a lower UTCI standard
deviation, thereby improving thermal comfort. Typological differences underscore the need for context-
specific design strategies to balance these factors. Our findings provide insights for optimizing building
configurations to promote emotional well-being in high-density urban settings.
1 INTRODUCTION
1.1 Context
High-density urban living, especially in cities such as
Hong Kong, poses unique challenges to mental well-
being owing to limited open spaces, extreme urban
density, and various environmental stressors. (Wong
et al., 2016).
A growing body of research has examined the
relationship between urban environmental factors—
such as visual exposure, greenery, and thermal
comfort—and mental health. Building on this
foundation, the present study explores the specific
impact of building typologies and morphology on
mental well-being in high-density environments.
1.2 Research Gap
Although prior studies have examined the influence
of urban morphology on microclimates and energy
efficiency, there is a paucity of research on using
morphological designs to balance key factors—such
as visual exposure, sunlight exposure, thermal
comfort, and residential density—relative to mental
health in high-density residential areas.
1.3 Research Aim
The primary aim of this research is to use parametric
modeling to control building morphologies and street
configurations, evaluating the combined impact of
different morphologies across various typologies on
visual and thermal exposure—factors that directly
affect environmental comfort.
The ultimate goal is to enhance mental health in
high-density urban settings.
1.4 Framework
The framework of the study is as follows: after the
introduction, the second section will provide a
literature review covering four key areas relevant to
the study. The methodology follows, consisting of
three steps: parametric modeling, environmental
simulation, and multi-objective optimization.
In the parametric modeling step, four building
typologies will be parameterized. The primary
decision variables that influence these typologies will
114
Wang, Z.
Optimizing Morphological Design in High-Density Residences in Hong Kong to Enhance Mental Health.
DOI: 10.5220/0013341600003953
In Proceedings of the 14th International Conference on Smart Cities and Green ICT Systems (SMARTGREENS 2025), pages 114-121
ISBN: 978-989-758-751-1; ISSN: 2184-4968
Copyright © 2025 by Paper published under CC license (CC BY-NC-ND 4.0)

be defined, and relevant constraints—such as
dimensional limits and design features—will be
identified for each variable.
For environmental indicators simulation and
quantification, the Isovist plugin in Grasshopper will
first be used to generate five visual exposure metrics
for each layout, while Ladybug will be employed to
calculate thermal metrics. Basic operations will also
be performed to determine the overall volume.
Notably, a mathematical model will establish the
relationship between visual metrics and visual
emotional value, while thermal metrics and volume
will serve as direct optimization objectives.
The key step, multi-objective optimization, will
utilize the Wallacei multi-objective optimization tool,
incorporating the NSGA-II (Non-dominated Sorting
Genetic Algorithm II). This tool will balance
environmental indicators and identify configurations
that maximize positive mental health outcomes.
Simulations will be conducted for each building
typology, yielding six representative locally optimal
solutions per typology. A post-hoc analysis will then
be performed on these solutions within each building
type, uncovering consistent findings.
Last by not
least, a conceptual approach to exploring the
improvement saturation effect will be proposed,
which could be used for further investigation in the
future.
2 LITERATURE REVIEW
2.1 Mental Health and Urban Density
Urban living and city-based upbringing affect human
neural responses to social stress. (Lederbogen et al.,
2011). Crowding, noise, and prolonged exposure to
dense environments further exacerbate stress and
anxiety (Tost et al., 2015).
Urban planning increasingly focuses on
enhancing visual and thermal comfort to mitigate
these stressors (Liu et al., 2024).Urban parks, for
example, enhance visual openness and regulate local
climates in dense settings (Chiesura, 2004), while
abundant greenery aids stress recovery (Ulrich et al.,
1991) and improves overall emotional well-being
(Xiang et al., 2021), particularly benefiting older
adults (Luo et al., 2024). These findings align with the
concept of “affective atmospheres,” which suggests
that urban green spaces optimized for visual and
thermal comfort can effectively reduce stress (Deitz
et al., 2018).
However, integrating green spaces often conflicts
with the demand for additional living areas in high-
density cities, such as Hong Kong. This trade-off
necessitates alternative strategies, such as optimizing
building morphologies and street layouts.
2.2 Visual Exposure and Emotion
Visual exposure plays a key role in emotional well-
being in dense urban environments.
Visual openness has been shown to reduce stress
(Stamps, 2005), while individuals' perceptions of it
significantly shape emotional responses (Yang et al.,
2024). In addition, building forms influence visibility
in crowded settings (Giseop et al., 2019); specifically,
moderate building heights, combined with visible
green spaces, enhance emotional comfort (Lindal et
al., 2013). Together, these findings highlight the
importance of designing urban spaces that enhance
visibility to promote mental well-being.
2.3 Thermal Comfort and Emotion
Thermal comfort is critical for mental well-being,
particularly in densely populated areas with limited
climate control.
Specifically, open spaces and vegetation help
improve thermal comfort by reducing the urban heat
island effect (Wang et al., 2021), which in turn
positively influences both physical and emotional
well-being (Yan et al., 2023). Moreover, the
configuration of streets and buildings is essential for
thermal comfort: narrower streets and taller buildings
provide shading that reduces direct sun exposure
(Wang et al., 2023), while layouts that minimize
temperature fluctuations further enhance comfort (Xu
et al., 2019)
2.4 Quantification and Optimization
To optimize urban design for mental well-being, tools
such as Rhino and Grasshopper, along with plug-ins
like IsoVist, Ladybug, and Wallacei, are invaluable
for balancing visual and thermal comfort in high-
density settings.
IsoVist expands visibility analysis by capturing
three-dimensional spatial relationships, helping to
evaluate how building heights and layouts influence
accessibility and psychological comfort. Originally
developed for 2D analysis (Benedikt, 1979) and later
enhanced for 3D relationships, IsoVist is now a key
tool in assessing emotional well-being (Giseop et al.,
2019).
Ladybug supports climate-based simulations to
assess thermal comfort and sunlight exposure across
urban layouts, allowing urban designers to refine their
Optimizing Morphological Design in High-Density Residences in Hong Kong to Enhance Mental Health
115
designs for improved environmental comfort (Wang
et al., 2023).
Wallacei, a genetic algorithm, facilitates multi-
objective optimization to enhance spatial efficiency
(Xu et al., 2019). In our study, it plays a crucial role
in balancing visual exposure, thermal comfort, and
urban density in high-density urban environments.
3 METHODOLOGY
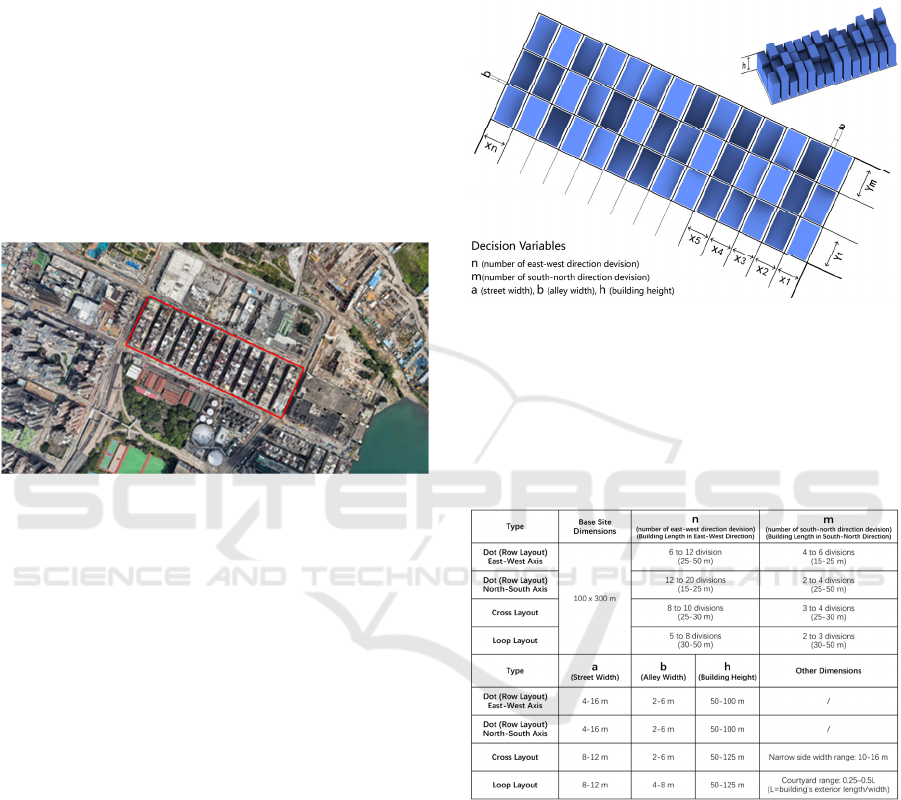
3.1 Site Selection
The experimental site is located in To Kwa Wan,
Hong Kong, within a residential zone.
Figure 1: Site location.
Chosen for its redevelopment potential, the area
features low-density buildings with large footprints
that may be replaced by higher-density developments
to improve housing capacity and environment. The
site’s layout comprises regular residential buildings
arranged in long, parallel rows along narrow streets
and alleys, typical of older urban districts in Hong
Kong. With a low floor area ratio (FAR), extensive
ground coverage, and minimal building height
variation, the area provides an ideal setting for testing
different building typologies and exploring how high-
density redesigns can optimize visual exposure,
thermal comfort, and living space to enhance
residents’ emotional well-being. The site location is
shown in Figure 1.
3.2 Parametric Modeling
Hong Kong’s high-density urban environment is
characterized by four typical building typologies:
East-West oriented dot-and-row forms, North-South
oriented dot-and-row forms, crossing layouts, and
loop-shaped layouts. To explore their design
potential, these typologies were parameterized and
simplified for testing. Figure 2 provides an example
of the East-West oriented dot-and-row form, with key
variables involved in parametric modeling including
n (number of divisions along the east-west direction),
m (number of divisions along the north-south
direction), a (street width), b (alley width), and h
(building height).
Figure 2: Five decision variables.
These five variables serve as the decision
variables for the multi-objective optimization. The
parameter constraints for these variables were derived
from map distance calculations in Hong Kong and
supported by relevant architectural research. The
dimensional details are shown in Figure 3.
Figure 3: Parameter constraints.
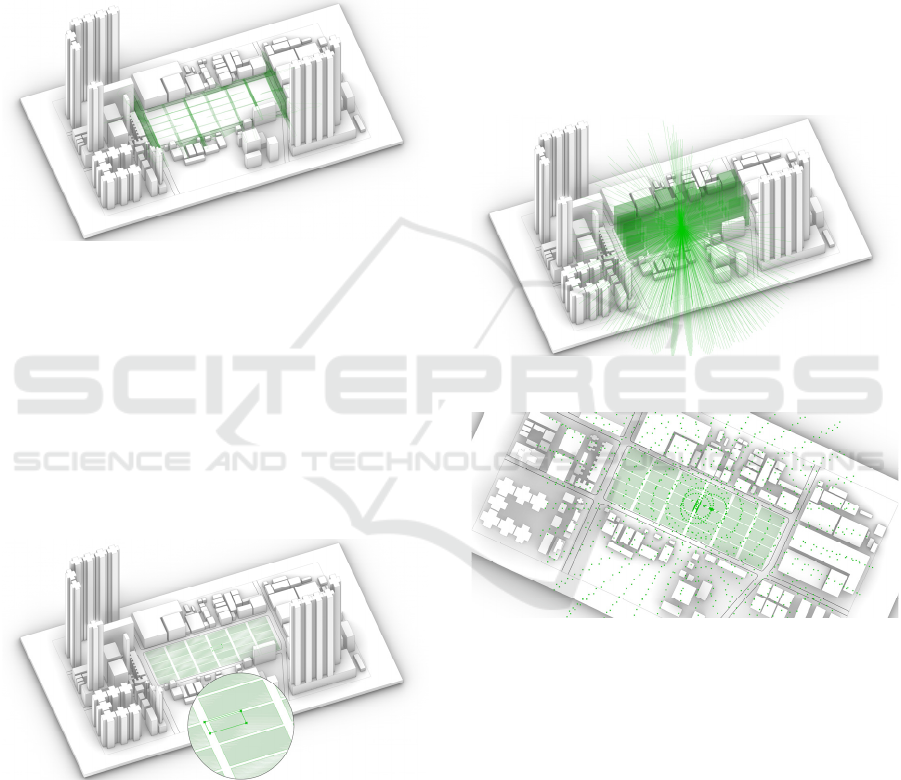
3.3 Visual Exposure Metrics
Visual exposure was analyzed using the IsoVist plug-
in in Grasshopper, enabling both 2D and 3D isovist
calculations to simulate visibility across the
experimental site. The goal was to understand how
different building forms, along with variations in
street and alley dimensions, affect the visual
experience of residents in a high-density setting.
2D Isovist Calculations: The 2D analysis involved
placing observation points uniformly across the site,
SMARTGREENS 2025 - 14th International Conference on Smart Cities and Green ICT Systems
116
excluding building interiors to focus solely on the
external visual experience. This approach ensured
comprehensive coverage of the experimental area,
enabling the calculation of average visibility in terms
of ground-level access to streets and open spaces.
Using the IsoVist 2D tool, three key metrics—drift
magnitude, mean radial, and compactness—were
generated to support the subsequent Emotional Value
Calculation. The results of the 2D Isovist calculations
are shown in Figure 4.
Figure 4: 2D Isovist Calculations
3D Isovist Calculations: For the 3D spatial
analysis, four key observation points were selected to
capture diverse visibility perspectives within the
dense residential layout. In high-density areas with
tall, closely packed buildings, street-level visibility is
often limited to nearby structures; therefore, the four
central points are representative of most viewing
angles. This strategy ensures a balanced assessment
while optimizing computational efficiency. The four
observation points are shown in the figure 5.
Figure 5: Four observation points for 3D.
The four points include: street-alley intersection,
street midpoint, alley midpoint and building center.
When the building layout changes, the street–alley
intersection point can be replaced with the midpoint
of the building's interior. This adjustment ensures that
observation points remain consistent and adaptable,
as both serve as diagonal anchors within a rectangular
layout, preserving their role throughout the analysis.
For each layout type, the 3D visual exposure score is
calculated as the average of the values from all four
observation points, regardless of building type. This
approach ensures a consistent basis for comparing
different layouts. For loop-shaped layouts with
courtyards, the interior point adds a unique visibility
perspective, enabling an evaluation of how the
courtyard influences overall visibility compared to
layouts with more restricted internal sightlines.
Building on this, 3D Isovist analysis calculates
two supplementary metrics—3D object proportion
and 3D visual volume—to further quantify visibility.
Figures 6 and 7 illustrate the 3D IsoVist visibility
and effective collision points.
Figure 6: 3D IsoVist visibility.
Figure 7: Effective collision points.
The emotional value, derived from these visibility
parameters, was calculated using an existing Multiple
Linear Regression (MLR) model developed by Xiang
et al. This model estimates emotional responses to
visual exposure by linking isovist parameters to
psychological comfort based on environmental
psychology studies. The MLR coefficients for each
parameter were applied to compute the overall visual
comfort score.
Y=1/n
∑
(0.528a
i
-0.178b
i
+0.29c
i
-0.304d
i
+0.461e
i
)
n: total number of observation points randomly placed on
the site, a: drift magnitude, b: mean radial, c: compactness,
d: 3d object proportion, e: 3d visual volume
Optimizing Morphological Design in High-Density Residences in Hong Kong to Enhance Mental Health
117
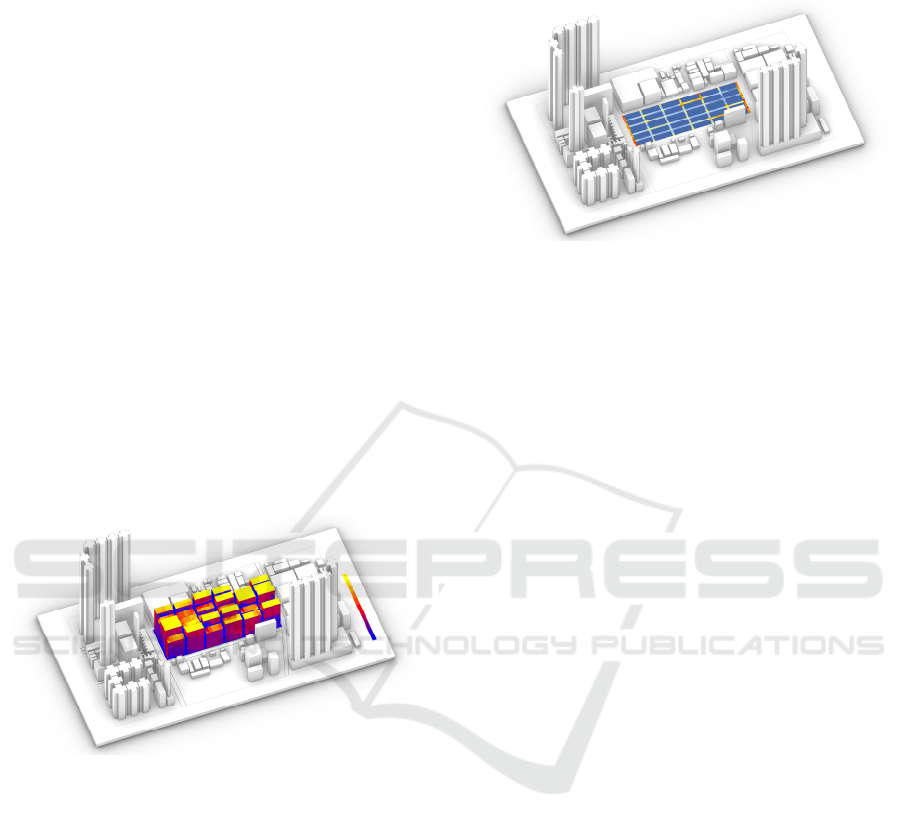
3.4 Thermal Comfort Metrics
Thermal comfort was assessed using two primary
metrics: direct sunlight hours and the standard
deviation of UTCI (Universal Thermal Climate
Index). These metrics help quantify residents' thermal
comfort in relation to the built environment and
weather conditions, particularly important in a hot
climate like Hong Kong.
Direct Sunlight Hours: The Ladybug plug-in in
Grasshopper was used to simulate direct sunlight
exposure on the site, incorporating the experimental
buildings, surrounding structures, and local climate
conditions. The simulation accounted for building
heights and orientations (East-West and North-South)
to estimate sunlight exposure for both the buildings
and the streets. The site was divided into a 10-meter
grid to balance precision with computational
efficiency. By including outdoor spaces alongside
building facades, the analysis aimed to capture thermal
comfort across the entire neighborhood. The focus was
on minimizing excessive sunlight exposure, which can
significantly reduce thermal comfort in hot climates.
Figures 8 illustrates the direct sunlight hours.
Figure 8: Direct Sunlight Hours.
UTCI Standard Deviation: The Universal Thermal
Climate Index (UTCI) measures thermal comfort by
accounting for factors like air temperature, humidity,
and wind speed. In this study, the standard deviation
of UTCI values was used to evaluate temperature
variability across the site, prioritizing spatial
consistency over average UTCI. Using the Ladybug
plug-in in Grasshopper, the site was divided into a 5-
meter grid, with UTCI values calculated for each grid
cell to capture localized temperature variations in
outdoor areas. This approach enabled a detailed
analysis of how design elements—such as building
dimensions, orientation, and spacing—affect thermal
stability. Examining UTCI standard deviation helped
identify areas prone to sudden temperature changes,
offering insights into how design adjustments can
promote stable outdoor thermal comfort. Figures 9
illustrates the UTCI standard deviation.
Figure 9: UTCI Standard Deviation.
3.5 Building Volume
The total building volume was calculated to reflect the
density and massing of the proposed morphologies.
As density is critical in urban planning, this metric
was essential for balancing high-density residential
needs with emotional well-being. Building volume
for each morphology was determined based on height,
footprint, and spatial configuration, ensuring that the
designs met density requirements.
3.6 Optimization with Wallacei
Metrics for visual exposure, thermal comfort (direct
sunlight and UTCI deviation), and building volume
were calculated and optimized using the Wallacei
plug-in. This tool employed a genetic algorithm to
balance competing factors—visual access, thermal
comfort, and building density—across four building
typologies. The optimization process aimed to
maximize visual exposure, minimize excessive
sunlight, maintain stable thermal comfort, and
achieve higher density.
4 EXPERIMENTAL RESULTS
4.1 Overview
Using Wallacei X, which integrates the built-in
genetic algorithm with NSGA-II (Non-dominated
Sorting Genetic Algorithm II), each of the four
typologies underwent 15 generations, with 30
individuals per generation.
Taking the East-West Oriented Dot and Row form
as an example (Figure 10), the first column illustrates
the evolution of the curve from red (initial
generations) to blue (subsequent generations), while
SMARTGREENS 2025 - 14th International Conference on Smart Cities and Green ICT Systems
118
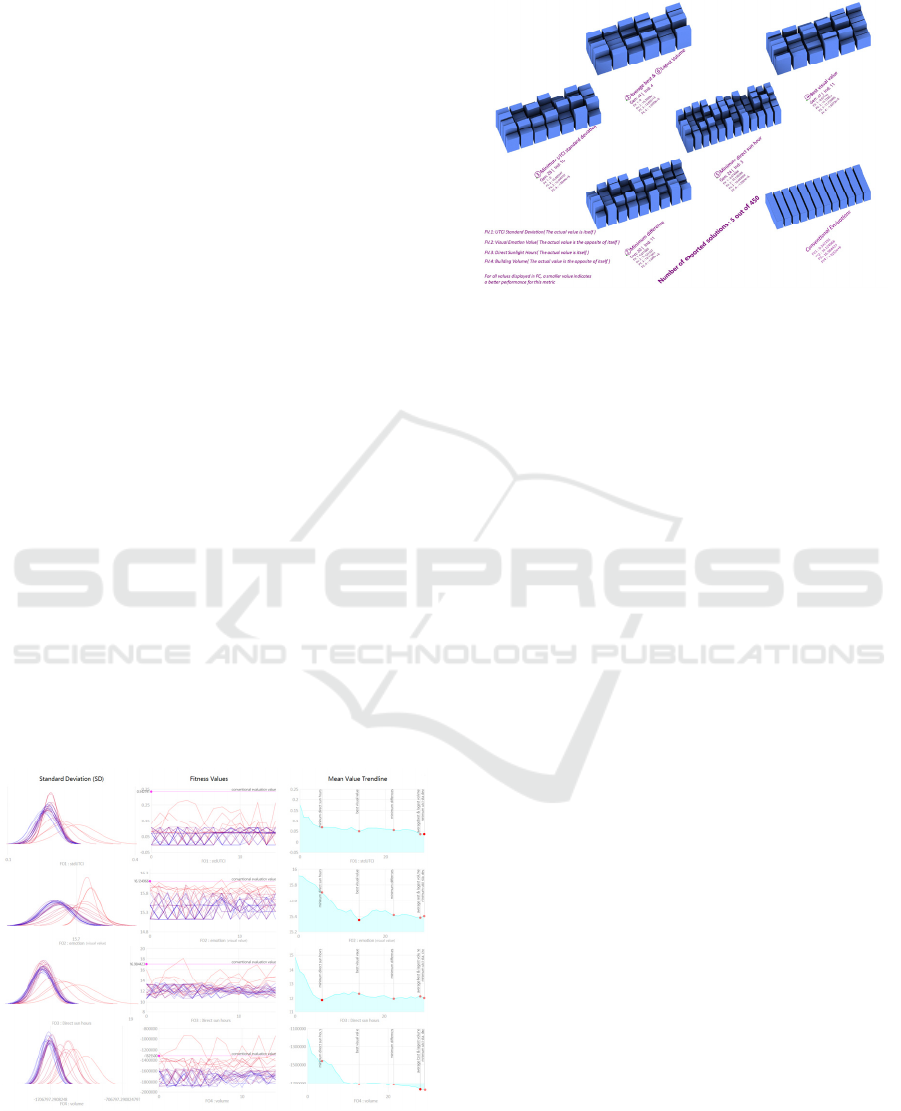
the left-to-right progression indicates progressively
better results.
The second column shows the changes in the
values of each optimization objective, where the
values decrease from red to blue, reflecting improved
optimization outcomes. The conventional evaluation
values are also annotated on the graph, demonstrating
that the majority of optimized results are lower than
the initial values, thus validating the effectiveness of
the optimization.
The third column depicts the trend of the objective
variables across generations, showing a gradual
reduction, which further supports the success of the
optimization process. Additionally, it also highlights
the specific values of six outstanding individuals and
the time they first appear.
Similarly, the other three typologies were also
optimized, and six local optimal individuals were
selected for each typology, including the Average
Best, Minimum Difference, and the local optima for
the four key criteria (Minimum UTCI Std. Dev., best
visual emotion value, minimum direct sun hours, and
largest volume). After obtaining the final shapes of
the selected individuals, a preliminary analysis was
conducted to explore the relationship between the
individual shapes and the four indicators.
This analysis examined the impact of street (alley)
width and number on visual exposure, UTCI standard
deviation, and direct sunlight hours, as well as the
influence of typology-specific differences on these
factors. Additionally, the conventional building
shapes and the corresponding evaluation values were
also presented across all four groups of results to
further validate the reliability of the optimization
outcomes.
Note: The lower the value shown in the image, the better the
corresponding indicator. The value of building volume should
be converted to a positive number for practical use.
Figure 10: Result of the Wallacei genetic algorithm.
4.2 East-West Oriented Dot and Row
Figure 11: Local Optimal Solutions (Type 1).
Street Width Impact: Comparing configurations ①
and ④, we find that with the same number of streets
and alleys, wider streets improve the visual emotion
value (p<0.05).
Number of Streets and Alleys: With consistent
street width (①, ②, ③, ⑤), an increase in street
count enhances the visual emotion value, indicating
that a higher street density may promote emotional
well-being.
Sunlight and UTCI: Consistent street width (①,
②, ③, ⑤) shows that more streets correlate with
longer minimum direct sun hours, impacting thermal
comfort. However, the effect on UTCI Std. Dev. is
inconsistent.
Building Dimensions: With the same number of
streets and alleys ( ① vs. ④ ), larger buildings
mitigate direct sun exposure but increase UTCI Std.
Dev.
All optimized results for the four indicators are
below the conventional values, demonstrating the
effectiveness of the optimization.
4.3 North-South Oriented Dot and Row
Street Width and Emotion Value: Similar to East-
West forms, wider streets (④ vs. ⑤) enhance visual
emotion value.
Street Count and Emotion Value: With consistent
alley width, more streets increase visual emotion
value, suggesting a positive relationship between
urban density and emotional well-being.
Contradiction in UTCI: The negative effect of
street width on UTCI Std. Dev. contradicts the
findings from Experiment 1, highlighting the need for
further investigation into this discrepancy.
Optimizing Morphological Design in High-Density Residences in Hong Kong to Enhance Mental Health
119
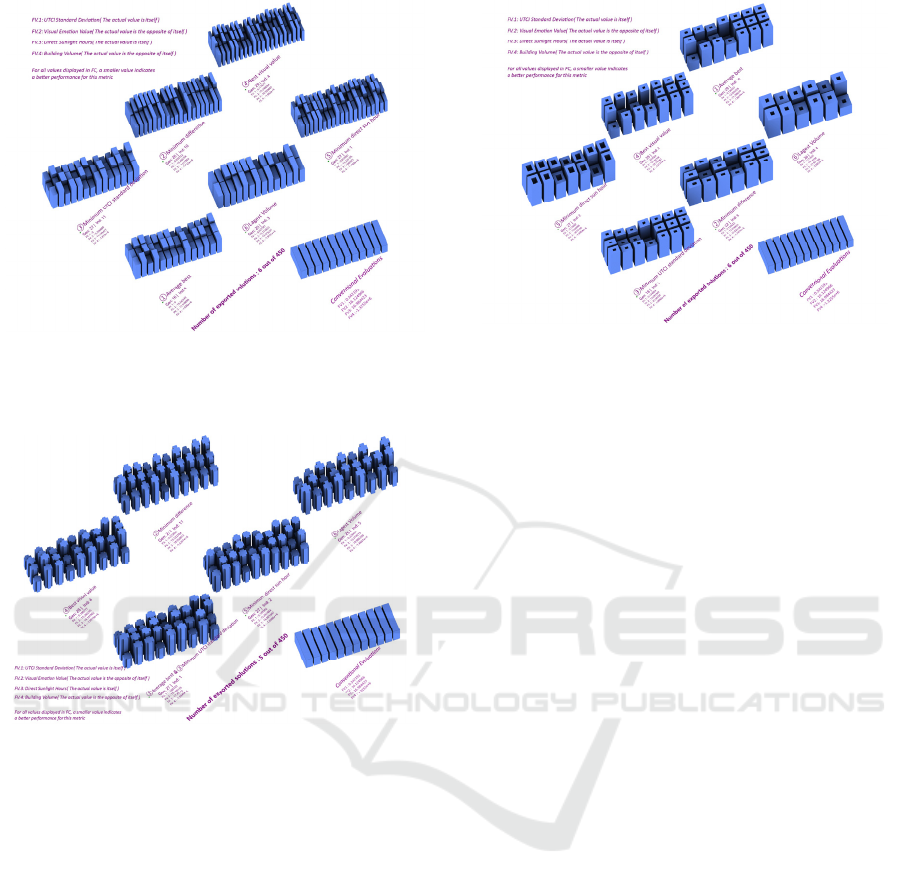
Figure 12: Local Optimal Solutions (Type 2).
4.4 Crossing Layouts
Figure 13: Local Optimal Solutions (Type 3).
Street Width and Visual Emotion: Wider streets (①
vs. ④) improve visual emotion value, aligning with
other layouts.
Street Count and Thermal Comfort: Increasing
street count with consistent width improves direct sun
exposure but has an inconsistent impact on UTCI Std.
Dev.
Building Dimensions As observed in other
layouts, larger buildings mitigate direct sun exposure
but increase UTCI Std. Dev.
4.5 Loop-Shaped Layouts
Street Width and Emotion Value: Wider streets (①
vs. ④) enhance visual emotion value.
Street Count and UTCI: An increase in street
count positively affects UTCI Std. Dev., which
contrasts with findings from other experiments,
indicating a complex relationship.
Figure 14: Local Optimal Solution (Type 4).
Atrium Scale Impact: Atrium scale has a more
significant positive impact on visual emotion value
than street count, suggesting the importance of open
spaces in dense urban areas.
5 DISCUSSIONS
By comparing the six locally optimal solutions for
each of the four building typologies, a clear pattern
emerged: wider streets and higher street counts
enhance visual emotion values, while narrower streets
help stabilize UTCI Std. Dev., improving thermal
comfort. Typology-specific differences were also
noted. For example, loop-shaped layouts with atriums
had a greater positive impact on visual emotion value
than street count. These findings highlight the
importance of adjusting designs for individual
typologies while adhering to broader principles.
However, the results were validated only within a
limited sample. To explore the potential thresholds of
influence—such as when changes in decision
variables lead to saturation—we propose further
investigation. Wallacei genetic algorithm propagates
optimal offspring, meaning that decision variables
favorable to the objectives appear more frequently,
concentrating high-quality solutions. We plan to
analyze the optimization data to track variable
frequencies. Preliminary analysis offers three key
thresholds for further investigation: at what street
widths and intersection counts do visual value
improvements saturate, and at what widths does
thermal comfort reach saturation? Given Wallacei's
discrete selection method, we propose reclassifying
street widths into smaller intervals (e.g., 0.5 meters)
from 4 meters to 16 meters, resulting in 24 intervals.
This approach will help track and compare the
SMARTGREENS 2025 - 14th International Conference on Smart Cities and Green ICT Systems
120

frequency of intervals, improving accuracy in
identifying the ranges where saturation effects occur.
6 CONCLUSIONS
This study explored how optimizing building
morphologies and street configurations improves
mental well-being in high-density areas by balancing
visual exposure, thermal comfort, and urban density.
However, the study has limitations. The small dataset
may limit generalizability, and the emotional value
model (MLR) may not fully reflect local conditions.
Additionally, the simplified parametric models and
focus on Hong Kong may reduce applicability to other
regions. Future research could address these
limitations by exploring growth thresholds,
expanding the dataset, refining the emotional value
model, and incorporating more detailed urban
representations to validate and extend the findings.
REFERENCES
Wong, C. S. M., Chan, W. C. (2016). Living Environment
and Psychological Distress in the General Population of
Hong Kong. Procedia Environmental Sciences, 36, 78-
81. ISSN 1878-0296.
Lederbogen, F., Kirsch, P., Haddad, L. (2011). City living
and urban upbringing affect neural social stress
processing in humans. Nature, 474, 498–501.
Tost, H., Champagne, F. A., Meyer-Lindenberg, A. (2015).
Environmental influence in the brain, human welfare
and mental health. Nat Neurosci, 18(10), 1421-1431.
Liu, Z., Liu, C. (2024). The association between urban
density and multiple health risks based on interpretable
machine learning: A study of American urban
communities. Cities, 153, 105170. ISSN 0264-2751.
Chiesura, A. (2004). The role of urban parks for the
sustainable city. Landscape and Urban Planning, 68(1),
129-138. ISSN 0169-2046.
Ulrich, R. S., Simons, R. F., Losito, B. D., Fiorito, E., Miles,
M. A., Zelson, M. (1991). Stress recovery during
exposure to natural and urban environments. Journal of
Environmental Psychology, 11(3), 201-230. ISSN
0272-4944.
Xiang, L., Cai, M., Ren, C., Ng, E. (2021). Modeling
pedestrian emotion in high-density cities using visual
exposure and machine learning: Tracking real-time
physiology and psychology in Hong Kong. Building
and Environment, 205, 108273. ISSN 0360-1323.
Luo, W., Chen, C., Li, H., Hou, Y. (2024). How do
residential open spaces influence the older adults’
emotions: A field experiment using wearable sensors.
Landscape and Urban Planning, 251, 105152.
Deitz, M., Notley, T., Catanzaro, M., Third, A., Sandbach,
K. (2018). Emotion mapping: Using participatory
media to support young people's participation in urban
design. Emotion, Space and Society, 28, 9-17.
Stamps, A. E. (2005). Isovists, Enclosure, and Permeability
Theory. Environment and Planning B: Planning and
Design, 32(5), 735-762.
Yang, S., Dane, G., van den Berg, P., Arentze, T. (2024).
Influences of cognitive appraisal and individual
characteristics on citizens’ perception and emotion in
urban environment: model development and virtual
reality experiment. Journal of Environmental
Psychology, 96, 102309.
Giseop, K. I. M., Ayoung, K. I. M., Youngchul, K. I. M.
(2019). A new 3D space syntax metric based on 3D
isovist capture in urban space using remote sensing
technology. Computers, Environment and Urban
Systems, 74, 74-87.
Lindal, L. P. J., Hartig, T. (2013). Architectural variation,
building height, and the restorative quality of urban
residential streetscapes. Journal of Environmental
Psychology, 33, 26-36. ISSN 0272-4944.
Wang, W., Liu, K., Zhang, M., Shen, Y., Jing, R., Xu, X.
(2021). From simulation to data-driven approach: A
framework of integrating urban morphology to low-
energy urban design. Renewable Energy, 179, 2016-
2035. ISSN 0960-1481.
Yan, T., Jin, H., Jin, Y. (2023). The mediating role of
emotion in the effects of landscape elements on thermal
comfort: A laboratory study. Building and
Environment, 233, 110130.
Wang, J., Liu, W., Sha, C., Zhang, W., Liu, Z., Wang, Z.,
Du, X. (2023). Evaluation of the impact of urban
morphology on commercial building carbon emissions
at the block scale – A study of commercial buildings in
Beijing. Journal of Cleaner Production, 408, 137191.
ISSN 0959-6526.
Xu, X., Yin, C., Wang, W., Xu, N., Hong, T., Li, Q. (2019).
Revealing Urban Morphology and Outdoor Comfort
through Genetic Algorithm-Driven Urban Block
Design in Dry and Hot Regions of China. Sustainability,
11(13), 3683.
Benedikt, M. L. (1979). To take hold of space: Isovists and
isovist fields. Environment and Planning B: Planning
and Design, 6(1), 47-65.
Optimizing Morphological Design in High-Density Residences in Hong Kong to Enhance Mental Health
121
