
Agent-Based Simulation Modeling for Sustainable Chemical Production
and Resource Management
Afshin Poorkhanalikoudehi
1
, Thorsten Wack
2 a
, Sebastian Kliesow
2 b
, Martin Distelhoff
2
and Goerge Deerberg
1,2
1
FernUniversit
¨
at in Hagen, Universit
¨
atsstraße 47, 58097 Hagen, Germany
2
Fraunhofer-Institut f
¨
ur Umwelt-, Sicherheits- und Energietechnik UMSICHT
Osterfelder Straße 3, 46047 Oberhausen, Germany
Keywords:
Sustainable Chemical Production, Resource Optimization, Energy Efficiency, Pareto Optimization, Resource
Availability-Based Selection, Industrial Network, Multi-Objective Optimization.
Abstract:
This study investigates the optimization of resource allocation and energy efficiency within a sustainable chem-
ical production network using three distinct methods: Resource Availability-Based Selection, Pareto-based
Selection, and Pareto Optimization. Each method was analyzed based on its ability to manage energy con-
sumption, production efficiency, and resource utilization across multiple iterations. The Resource Availability-
Based Selection method prioritized available resources in storage, while the Pareto-based Selection introduced
input price considerations. Pareto Optimization, the most advanced approach, balanced production efficiency
and cost-effectiveness, resulting in the highest overall performance. Findings demonstrate that multi-objective
optimization, particularly Pareto Optimization, enhances operational efficiency and sustainability. The study’s
implications suggest adopting advanced optimization strategies to achieve energy efficiency and sustainabil-
ity goals in the chemical industry. Additionally, recommendations for future research include incorporating
real-time market dynamics, logistical factors, and renewable energy sources into the model to further enhance
decision-making.
1 INTRODUCTION
In recent years, the chemical industry has faced in-
creasing pressure to adopt more sustainable practices
due to environmental and economic considerations.
Sustainable chemical production (SCP) minimizes
environmental impact while optimizing resource uti-
lization, ensuring long-term viability (Haleem et al.,
2023; Mishra et al., 2023). Traditional evaluation
methods often fail to capture the complexity of in-
teractions in production systems. To address this,
the purpose of this study is to develop and analyze
an agent-based modeling and simulation (ABMS)
framework for sustainable chemical production and
resource management. By simulating interactions
between production facilities, markets, and resource
providers, the study aims to optimize production pro-
cesses, reduce waste, and enhance sustainability.
a
https://orcid.org/0009-0000-3839-4429
b
https://orcid.org/0009-0008-4509-0413
2 LITERATURE REVIEW
Agent-Based Modeling and Simulation (ABMS) has
emerged as a powerful tool for analyzing complex
systems, particularly in resource allocation and sup-
ply chain management. Its ability to model au-
tonomous agents and their interactions provides valu-
able insights into system dynamics and performance.
In supply chain networks, ABMS has been inte-
grated with the Supply Chain Operations Reference
(SCOR) model to enhance the modeling of distributed
supply chain systems (Long, 2014). This integra-
tion allows for a more comprehensive analysis of sup-
ply chain processes and performance metrics. Addi-
tionally, ABMS has been combined with reinforce-
ment learning to optimize stochastic supply chains,
particularly in managing supplier disruptions (Aghaie
and Hajian Heidary, 2019). This simulation-based
optimization approach has proven effective in han-
dling uncertainties within supply chains. Further-
more, ABMS has been applied to model Liquefied
Poorkhanalikoudehi, A., Wack, T., Kliesow, S., Distelhoff, M., Deerberg and G.
Agent-Based Simulation Modeling for Sustainable Chemical Production and Resource Management.
DOI: 10.5220/0013339600003970
In Proceedings of the 15th International Conference on Simulation and Modeling Methodologies, Technologies and Applications (SIMULTECH 2025), pages 147-158
ISBN: 978-989-758-759-7; ISSN: 2184-2841
Copyright © 2025 by Paper published under CC license (CC BY-NC-ND 4.0)
147
Natural Gas (LNG) import terminals, demonstrating
its effectiveness in supply chain management for en-
ergy sectors (Venkataramanan and Srinivasan, 2024).
These studies highlight the capability of ABMS to
evaluate real-world scenarios and disruptions, rein-
forcing its value in complex supply chain manage-
ment.
In chemical production, ABMS enables the explo-
ration of various scenarios, including the effects of
different resource management strategies on produc-
tion efficiency and environmental sustainability (Helo
and Rouzafzoon, 2023; Zhou et al., 2024). This capa-
bility is particularly valuable in the context of sustain-
able development, where ABMS facilitates the bal-
ancing of economic, environmental, and social ob-
jectives. Additionally, ABMS supports the integra-
tion of real-time data and adaptive strategies, making
it a powerful tool for managing dynamic and com-
plex industrial environments (Ionescu et al., 2024).
Recent studies have demonstrated its effectiveness in
optimizing production processes, enhancing resource
allocation, and improving decision-making under un-
certainty (Zhu et al., 2023).
These studies collectively demonstrate the versa-
tility and efficacy of ABMS in addressing various
challenges in resource allocation and supply chain
management. By capturing the behaviors and interac-
tions of individual agents, ABMS facilitates a deeper
understanding of complex systems, leading to more
informed and effective decision-making.
3 CASE STUDY: SCP MODEL
The sustainable chemical production (SCP) model
is a comprehensive agent-based simulation frame-
work designed to optimize and manage chemical pro-
duction and resource allocation within an industrial
ecosystem. The model is composed of various inter-
connected components and agents, each representing
a specific function within the system. The primary
agents in the SCP model include facilities (such as re-
actors, storage units, and treatment plants), markets,
and suppliers. Each facility agent is characterized by
its input and output materials, storage capacities, op-
erational costs, and production scales (Figure 1). The
model simulates the dynamic interactions between
these agents, focusing on their decision-making pro-
cesses related to purchasing raw materials, producing
goods, and selling outputs in response to market con-
ditions.
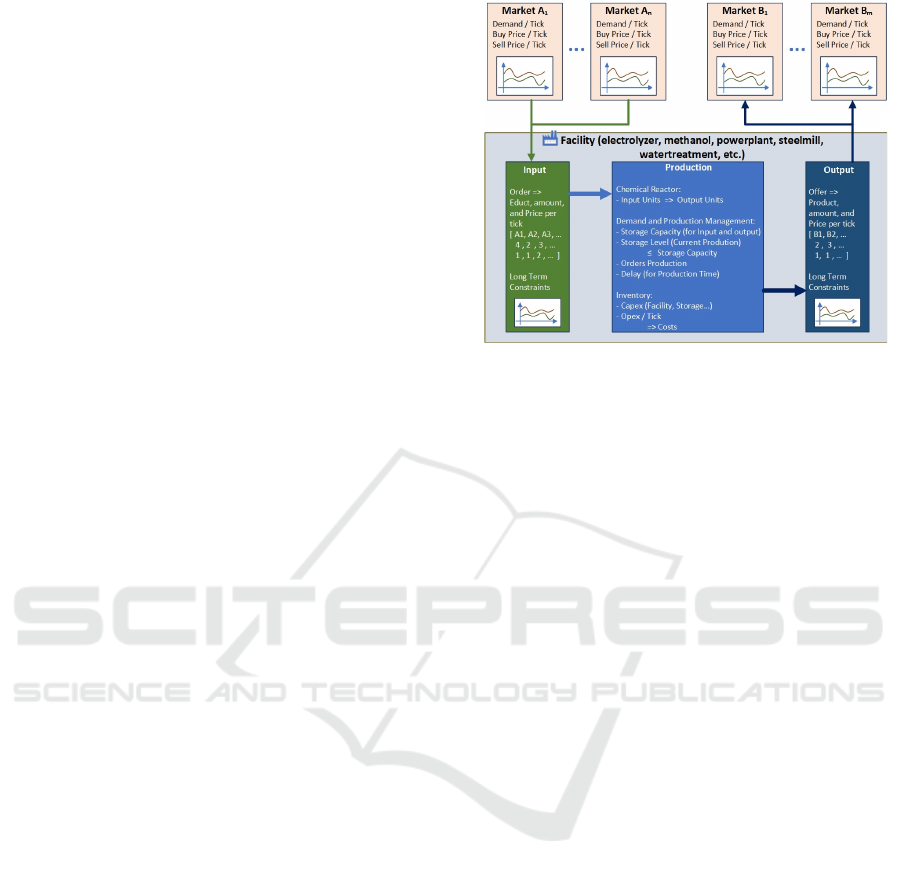
Figure 1 illustrates the structural components and
interactions within the SCP model, emphasizing re-
source flows between key agents such as facilities
Figure 1: Resource Flow and Decision-Making in the SCP
Model. The diagram illustrates the exchange of raw mate-
rials, intermediate products, and final outputs among facili-
ties, markets, and suppliers, highlighting key interactions in
production, purchasing, and sales.
(e.g., methanol plants, electrolyzers), markets, and
suppliers. Arrows represent the movement of raw
materials (e.g., CO
2
, H
2
, coal), intermediate prod-
ucts (e.g., methanol, treated water), and final out-
puts. The model integrates dynamic decision-making
for purchasing, production, and sales while ensuring
that storage levels remain within capacity limits. By
capturing resource exchanges alongside market inter-
actions, this representation underscores the model’s
capability to optimize resource allocation, production
efficiency, and sustainability in chemical production.
Remarks on Markets:
• Prices derive from time series (selling prices typi-
cally differ from purchase prices). Each product’s
price (e.g., for CO
2
) is dynamically derived from
time series data sourced directly from external
files, allowing for realistic variations over time.
• Demand is influenced by factors that are repre-
sented through time series data.
Remarks on Input Facility:
• Demand is decided from own production, use of
storage, and market purchases.
• Demand is influenced by factors represented in a
time series.
• Long-term constraints can necessitate purchases
(e.g., purchase contracts).
• Market prices are influenced by factors that can be
represented through time series data (which often
differ from selling prices).
SIMULTECH 2025 - 15th International Conference on Simulation and Modeling Methodologies, Technologies and Applications
148
Remarks on Output Facility:
• Production is limited by facility capacity.
• Selling price is calculated as Totex (Capex +
Opex), with Opex influenced by input prices.
• Long-term constraints may necessitate production
despite unfavorable market prices (e.g., supply
contracts).
• Market prices are influenced by factors that can be
represented through time series data (which often
differ from purchase prices).
In industrial financial modeling, the selling price
of a product is often calculated based on Totex, which
consists of Capex (Capital Expenditure) and Opex
(Operational Expenditure). Capex represents the in-
vestment in long-term assets, such as infrastructure,
while Opex covers the ongoing costs of production,
including input prices. Opex is particularly sensitive
to fluctuations in market prices for raw materials and
energy, making it a dynamic component. By combin-
ing Capex and Opex, Totex reflects the total cost of
ownership, guiding pricing strategies to ensure prof-
itability and sustainability. This comprehensive ap-
proach aids in financial planning and resource man-
agement.
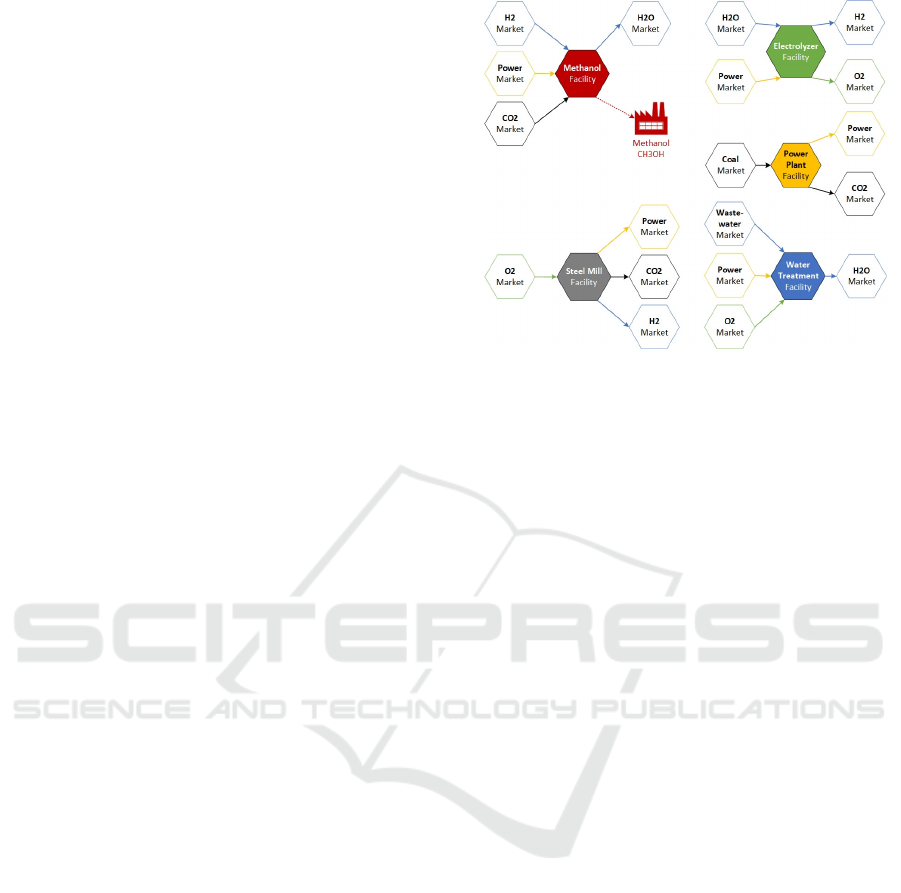
Facilities within the SCP model, such as methanol
plants and electrolyzers, play crucial roles in trans-
forming raw inputs into valuable chemical prod-
ucts. For example, the methanol facility converts car-
bon dioxide (CO
2
) and hydrogen (H
2
) into methanol
(CH
3
OH) and water (H
2
O), while the electrolyzer fa-
cility produces hydrogen from water using electric-
ity (Figure 2). These facilities operate under con-
straints such as production times, capacities, and eco-
nomic factors like operating expenses and market
prices. The model uses advanced decision-making al-
gorithms, including Pareto-based selection and Pareto
Optimization, to optimize the facilities’ operations,
ensuring efficient resource use and maximizing eco-
nomic returns. This holistic approach allows the SCP
model to provide insights into the sustainability and
economic viability of chemical production processes,
making it a valuable tool for industrial resource man-
agement.
Figure 2 provides a detailed view of various facil-
ities within the SCP model, including methanol facil-
ities, electrolyzer, power plant, steel mill, and water
treatment. It showcases the input and output relation-
ships for these facilities, such as the coal market in-
put and power and CO
2
market outputs for the power
plant. This illustration highlights how the model is
generalized to other facilities like ethanol, urea, and
biomass, offering a comprehensive depiction of the
interconnected industrial ecosystem.
Figure 2: Real-world Representation of Facility Interac-
tions.
The SCP model is chosen for its comprehensive
approach to simulating and optimizing chemical pro-
duction and resource management. Its ability to in-
corporate various facilities such as methanol plants,
electrolyzers, power plants, and water treatment units
allows for a detailed analysis of the interactions be-
tween different production processes and resource
flows. By simulating these interactions, the SCP
model helps identify inefficiencies and opportunities
for optimization, making it a powerful tool for en-
hancing sustainability in chemical production.
In the broader context of sustainable chemical
production, the SCP model addresses critical chal-
lenges such as resource utilization, energy efficiency,
and environmental impact. By integrating real-time
data and adaptive decision-making strategies, the
model provides insights into how different production
strategies affect overall sustainability. This holistic
perspective is essential for developing practices that
balance economic, environmental, and social objec-
tives, aligning with the goals of sustainable develop-
ment. The SCP model’s ability to simulate complex
industrial ecosystems and optimize resource manage-
ment makes it a valuable asset in the pursuit of sus-
tainable chemical production.
4 METHODOLOGY
4.1 Agent-Based Simulation Modeling
Agent-Based Modeling and Simulation (ABMS) is a
computational framework that enables the represen-
tation of autonomous agents, each with distinct at-
tributes and decision-making capabilities, to simulate
interactions within a system. In the context of sus-
Agent-Based Simulation Modeling for Sustainable Chemical Production and Resource Management
149

tainable chemical production, ABMS provides a de-
tailed and dynamic representation of industrial facil-
ities, markets, and resource flows. This approach is
particularly valuable for capturing the complexity of
interconnected industrial ecosystems, where multiple
facilities, such as methanol plants, electrolyzers, and
power plants (Figure 3), interact through material and
energy exchanges. By simulating these interactions,
ABMS allows for an in-depth analysis of production
processes, resource allocation, and market dynamics.
This capability is essential for evaluating the impact
of different decision-making strategies on resource
utilization, energy efficiency, and overall environmen-
tal sustainability, making ABMS a powerful tool for
optimizing industrial operations in real-world scenar-
ios.
Figure 3: Geospatial Distribution of Facilities.
Figure 3 presents the geospatial distribution of
facilities introduced in Section 3, illustrating their
spatial relationships within the industrial ecosystem.
Each facility is represented by a colored circle, main-
taining consistency with the color scheme in Figure 2,
to depict its location. This spatial representation en-
ables the analysis of logistical constraints, transporta-
tion costs, and regional resource availability, which
influence decision-making within the simulation. The
geospatial component is implemented using MESA-
GEO’s GeoSpace() function in Python, allowing fa-
cilities to interact dynamically based on their loca-
tions. By incorporating spatial constraints, the model
ensures a more realistic representation of industrial
operations, considering factors such as material trans-
portation and facility proximity in resource allocation
strategies.
During each simulation run, market and facility
agents are activated in a partially randomized order,
consistent with standard agent-based modeling ap-
proaches. Market agents, such as the hydrogen mar-
ket, operate passively without initiating actions or
making independent decisions. Instead, they serve
as intermediaries that regulate economic interactions
within the simulation. Their primary functions in-
clude calculating new prices at each time step based
on historical time series data, generating statistical in-
sights at the market level rather than for individual fa-
cilities, and managing market offers, effectively act-
ing as a centralized commodity exchange. By main-
taining an updated list of market offers, these agents
provide a structured platform for facilities to engage
in transactions, ensuring a realistic representation of
industrial market dynamics.
Facility agents, such as electrolyzers, actively en-
gage in decision-making and execute key operational
processes. These agents determine their output prod-
uct offers, setting quantities and prices before listing
them on the market, while also incorporating spatial
attributes such as location to account for transporta-
tion costs and delivery times. Additionally, facility
agents procure necessary input materials by selecting
from market offers based on predefined needs, prefer-
ences, and optimization strategies, including Pareto-
based selection. Their role extends beyond market
interactions, as they continuously initiate production
cycles, converting inputs into outputs at rates defined
by industrial profiles contributed by project partners.
This dynamic decision-making structure allows the
simulation to capture the complexities of industrial
operations, resource management, and economic be-
havior within a multi-agent system.
The objective of the simulation is to analyze
system-wide developments when each facility agent
independently optimizes its own outcomes while be-
ing influenced by market conditions. Facility agents
operate autonomously, making decisions based on
production efficiency, cost minimization, and re-
source availability. Their interactions are shaped by
market forces, particularly through pricing and supply
fluctuations, reflecting real-world industrial dynam-
ics. Additionally, facilities can establish long-term
agreements, fostering strategic partnerships that in-
fluence resource allocation and production efficiency.
These interactions may lead to the emergence of pro-
duction clusters or supply chains that naturally de-
velop under given conditions. By identifying such
emergent patterns, the simulation provides valuable
insights into industrial self-organization, supporting
the design of more efficient and resilient production
networks.
In the ABMS framework, reactors simulate the
transformation of raw materials and energy into prod-
ucts across industrial facilities. Their efficiency de-
pends on production capacity, technological con-
straints, and market conditions like resource availabil-
ity and pricing. This dynamic interaction enables re-
alistic modeling of industrial operations and resource
optimization. Table 1 outlines reactor configurations,
SIMULTECH 2025 - 15th International Conference on Simulation and Modeling Methodologies, Technologies and Applications
150

detailing inputs and outputs that drive the simulation.
Market agents play a crucial role in managing
price dynamics, regulating the availability of goods,
and facilitating transactions within the simulation.
The system distinguishes between input and out-
put prices, incorporating market fluctuations into the
decision-making processes of facility agents. This in-
tegration ensures that pricing strategies reflect real-
world economic conditions, allowing agents to re-
spond dynamically to changing supply and demand.
By enabling strategic interactions and accounting for
price volatility, the market framework enhances the
adaptability and realism of the model, providing a
more accurate representation of industrial market be-
havior.
ABMS enables the integration of real-time data
and adaptive decision-making, which are essential
for optimizing chemical production processes. By
simulating various scenarios and their long-term ef-
fects, ABMS helps identify strategies that balance
economic viability with environmental and social ob-
jectives. Its ability to model complex systems, cap-
ture dynamic interactions, and provide comprehen-
sive analyses makes it a valuable tool for advancing
sustainable chemical production. This approach sup-
ports the development of optimized production strate-
gies that enhance resource efficiency while minimiz-
ing environmental impact, offering insights beyond
those achievable through traditional modeling meth-
ods.
4.2 Model Specifications
The Sustainable Chemical Production (SCP) model is
designed with specific agents, behaviors, interactions,
and environmental contexts to simulate and optimize
chemical production processes.
Agent Behavior. Each facility within the model acts
as an autonomous agent with unique properties and
decision-making processes. For example, a methanol
plant agent has attributes (Figure 2) such as input
materials (e.g., CO
2
and H
2
), output products (e.g.,
methanol and water), production capacity, and op-
erational costs as stated in Section 3. These agents
follow specific rules and algorithms to decide on the
purchase of raw materials, the quantity of production,
and the sale of finished goods.
Interactions. Interactions between agents are gov-
erned by market dynamics and resource flows. Fa-
cilities interact with market agents to procure raw
materials and sell their products. For instance, the
power plant facility buys coal from the market and
sells power and CO
2
(Figures 1 and 2). These trans-
actions are influenced by market prices, availabil-
ity of resources, and contractual obligations. The
model also simulates internal interactions where out-
puts from one facility (e.g., hydrogen from the elec-
trolyzer) serve as inputs for another (e.g., methanol
production).
Environment. The model operates within a simu-
lated industrial ecosystem that includes various mar-
kets and environmental factors. Markets are modeled
to provide time-series data on prices and demand, en-
suring realistic economic conditions. Environmen-
tal constraints such as storage capacities, production
limits, and resource availability are defined in the fa-
cilities’ configuration files and actively enforced dur-
ing simulations to reflect real-world limitations. This
ensures agents operate within these constraints, dy-
namically adjusting their decisions based on factors
like available storage space and production capabili-
ties. Additionally, the model’s environment accounts
for long-term constraints such as purchase and sup-
ply contracts, which influence facility operations and
decision-making processes (Figure 3).
By incorporating detailed agent behaviors, com-
plex interactions, and realistic environmental con-
ditions, the SCP model provides a comprehensive
framework for analyzing and optimizing sustainable
chemical production processes. This enables the
identification of strategies that enhance resource effi-
ciency, reduce environmental impact, and ensure eco-
nomic viability.
4.3 Data Collection
The data collection process in this agent-based mod-
eling and simulation (ABMS) involves gathering and
analyzing key variables to understand the dynamics of
sustainable chemical production. The model utilizes
the MESA framework in Python, which allows for the
simulation of complex interactions between various
agents, including facilities and markets. Data collec-
tion is integrated within the simulation process, cap-
turing detailed information at each step of the model’s
execution.
4.3.1 Sources and Methods of Data Collection
Data are collected from several sources, including the
internal states of agents (such as production levels,
energy consumption, and storage capacities) and ex-
ternal market factors (like price fluctuations and de-
mand). The simulation continuously gathers data on
these variables throughout the iterations, enabling a
comprehensive analysis of the system’s behavior over
time. Key metrics such as total energy consumed, to-
tal energy produced, and financial transactions (pur-
chases and sales) are tracked using MESA’s built-in
Agent-Based Simulation Modeling for Sustainable Chemical Production and Resource Management
151
Table 1: Summary of Reactor Inputs and Outputs in Various Facilities.
Facility Input Output Reactor Type
Methanol Plant (Sollai et al., 2023) CO
2
, H
2
, Power CH
3
OH, H
2
O Chemical
Electrolyzer (El-Shafie, 2023) H
2
O, Power H
2
, O
2
Electrolysis
Power Plant (Okunlola et al., 2023) Coal CO
2
, Power Combustion
Steel Mill (Singh et al., 2022) O
2
H
2
, CO
2
, Power Metallurgical
Water Treatment (Fadillah et al., 2024) Wastewater, Power, O
2
H
2
O Filtration
DataCollector() functionality. This data is then
stored for further analysis and visualization, allow-
ing for the assessment of performance indicators criti-
cal to sustainable chemical production. The collected
data provides insights into the efficiency of different
strategies and helps identify areas for optimization
within the system.
4.4 Algorithm
Following the detailed specifications of the agents in
Section 4.2, the core computational framework for
the simulation is described using an algorithm that
governs how facilities and markets interact, allocate
resources, and optimize production. The algorithm
serves as the backbone for managing agent behavior,
resource flows, and decision-making within the simu-
lation environment.
The simulation model operates by first initializing
all agents, facilities such as methanol plants, power
plants, and water treatment plants, as well as markets
for key commodities like carbon dioxide (CO
2
), water
(H
2
O), hydrogen (H
2
), oxygen (O
2
), wastewater, and
coal. The agents operate based on their defined roles,
interacting through the market system to purchase or
sell resources. The algorithm for resource optimiza-
tion in the simulation is broken down into the follow-
ing steps:
1. Initialize Agents and Markets. At the begin-
ning of each simulation run, facilities and markets
are initialized based on predefined configurations
stored in external JSON files. Each facility in the
SCP model (Sections 3 and 4) is assigned oper-
ational parameters, including input requirements,
production capacity, available storage, and finan-
cial characteristics. Markets are dynamically in-
fluenced by time series data sourced from exter-
nal CSV files and account for fluctuating mate-
rial prices, providing realistic price variability for
agents’ decision-making.
2. Resource Availability Check. Facilities assess
their available resources stored onsite, such as
water, CO
2
, wastewater, and coal, and determine
their current production capabilities based on re-
source availability. This step ensures that the pro-
duction level does not exceed what is sustained by
the available inputs.
3. Market Interaction. Each facility engages with
the market to purchase the required resources if
the current storage is insufficient. Facilities also
sell their output (e.g., methanol, power) to the re-
spective markets. Prices and availability in the
market influence these transactions, following a
Pareto optimization or resource-based selection
method.
4. Production and Optimization. Once the neces-
sary resources are secured, the facility initiates
production, with output levels adjusted accord-
ing to the “Resource Availability-Based Selec-
tion”, “Pareto-based Selection”, or “Pareto Op-
timization” strategies (outlined in Sections 5.1.1
to 5.1.3). For instance:
• In the Resource Availability-Based Selection,
production is directly tied to the amount of re-
sources available in storage.
• In the Pareto-based Selection and Pareto Op-
timization methods, production decisions are
based on balancing multiple factors like input
costs and resource availability to maximize ef-
ficiency.
5. Data Collection and Analysis. After each simu-
lation step, the system collects data (Section 4.3)
on key variables such as total energy consumed,
total energy produced, prices of purchased and
sold resources, and the amount of materials traded
in the market. These values are recorded for
later analysis to measure the performance of each
method over the simulation iterations.
6. Repeat Process. The simulation iterates through
multiple steps, where agents continuously assess
their resource needs, engage in the market, and
adjust production outputs, reflecting real-world
industrial processes.
The algorithm implements a multi-objective op-
timization strategy, with a particular focus on the
Pareto-based methods that balance trade-offs be-
tween cost minimization and production maximiza-
tion. This approach to structured decision-making
SIMULTECH 2025 - 15th International Conference on Simulation and Modeling Methodologies, Technologies and Applications
152

enables the simulation to identify optimal strategies
for resource allocation, supporting sustainable chem-
ical production objectives. By detailing this com-
putational framework, the algorithm systematically
models agent interactions and operations within the
SCP model, accurately simulating real-world indus-
trial processes while effectively integrating resource
constraints and market dynamics.
5 RESULTS AND DISCUSSION
This section presents the findings from simulating
three decision-making methods in a cross-industrial
network for sustainable chemical production. The
simulation, conducted over 100 iterations per method,
evaluates key metrics such as energy consumption,
production efficiency, price sales, and purchases
across various facilities, including methanol plants,
electrolyzers, power plants, steel mills, and water
treatment units. Data outputs were systematically
recorded in CSV files, capturing facility-market in-
teractions. The model incorporates a diverse range
of industrial facilities, differentiated by scale and ca-
pacity, to reflect real-world operations. It includes 40
methanol production plants (25 small, 10 medium,
and 5 large), 20 electrolyzers (15 small, 5 medium),
12 medium-sized power plants, 5 large steel mills,
and 10 medium water treatment facilities. These con-
figurations, informed by industrial data, contribute to
a realistic representation of an interconnected indus-
trial ecosystem. Figure 3 visualizes the spatial distri-
bution of these facilities within the simulation envi-
ronment.
5.1 Simulation Outputs
5.1.1 Resource Availability-Based Selection
The Resource Availability-Based Selection method
optimizes facility operations by adjusting production
output to match the availability of resources in stor-
age. By ensuring that the facility’s inputs are aligned
with current storage levels, this method reduces the
risk of resource overuse or shortages, promoting ef-
ficient and stable production. It focuses on balanc-
ing input availability with production demands, mak-
ing it well-suited for environments where maintaining
continuous operation without disruptions is a prior-
ity. This approach operates independently of external
market factors, such as fluctuations in input prices.
In the method, the production output of a facil-
ity is determined by aligning available resource levels
with the required reactor inputs for production. The
production process is generalized as follows:
P
out put
= min(
R
input1
r
input1
,
R
input2
r
input2
, ...)
Where:
• P
out put
represents the maximum production out-
put, such as methanol, power, or other products
depending on the facility.
• R
input1
, R
input2
, ... denote the available quantities
of required resources (e.g., carbon dioxide, hydro-
gen, water, or coal) in the facility’s storage.
• r
input1
, r
input2
, ... represent the input requirements
for each resource per unit of production.
For example, a methanol facility requires reactor in-
puts like carbon dioxide, hydrogen, and power, while
a power plant primarily relies on coal. This method
identifies the bottleneck resource for any facility and
adjusts the production output accordingly, ensuring
efficient use of available resources without exceeding
operational constraints.
During the steps, this method demonstrated a
steady increase in both energy consumption and pro-
duction, though its overall efficiency plateaued when
compared to more advanced optimization techniques.
Energy consumption grew from 5, 299 megawatt-
hours (MWh) at the start to over 508, 000 MWh by
the final iteration, while energy production reached
254, 485 MWh (Table 2). Additionally, the total
amount of carbon dioxide purchased consistently ex-
ceeded the amount sold, with the gap widening as the
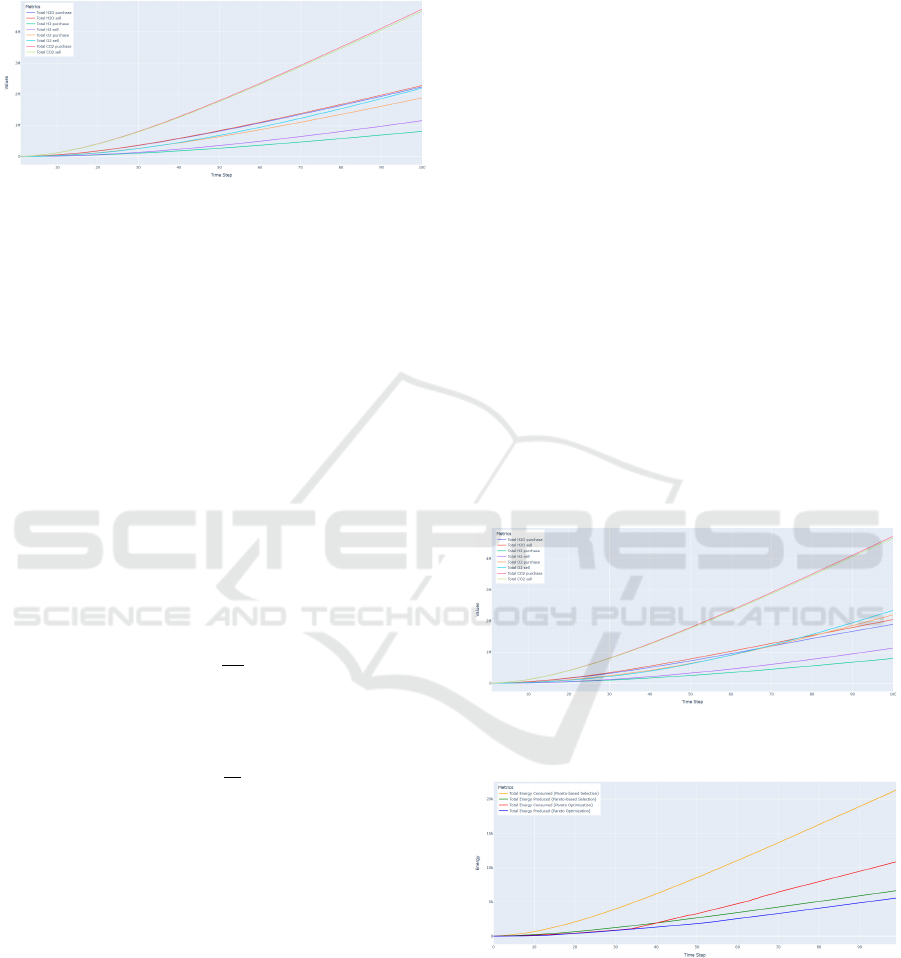
number of iterations increased (Figure 4).
Figure 4: Comparison of Total CO
2
Purchase and Sell in
Three Methods.
In conclusion to this section, clarifying the abbre-
viations and measurement units in Tables 2, 3, and 4
is essential to maintain consistency and facilitate clear
interpretation of the data presented. “Total Energy
Consumed” refers to the energy used by the facili-
ties, measured in megawatt-hours (MWh), while “To-
tal Energy Produced” indicates the energy generated
by the facilities, also measured in MWh. The tables
also report water transactions, with “Total H
2
O Pur-
chase” and “Total H
2
O Sell” reflecting the quantities
of water purchased and sold, measured in liters (L).
Agent-Based Simulation Modeling for Sustainable Chemical Production and Resource Management
153
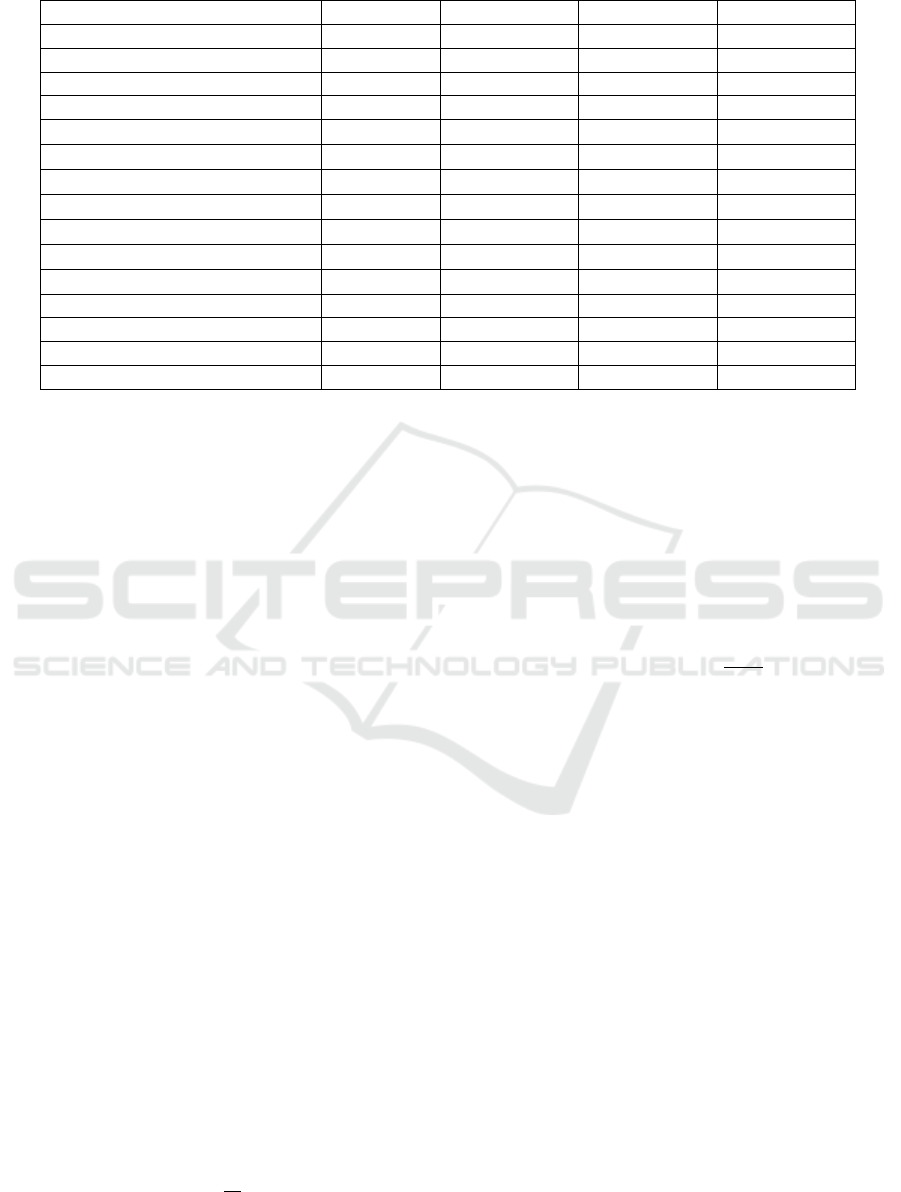
Table 2: Summary Statistics of Energy, Prices, and Material Transactions (Resource Availability-Based Selection method).
Field Min Max Mean Std Dev
Total Energy Consumed (MWh) 5,299.0 508,280.6 265,912.4 144,395.2
Total Energy Produced (MWh) 2,231.8 254,485.6 127,184.9 73,861.7
Total H
2
O Purchase (L) 22,473.0 2,183,441.9 1,172,773.8 614,694.2
Total H
2
O Sell (L) 13,369.2 2,160,537.2 1,088,608.8 625,706.8
Total H
2
Purchase (m
3
) 2,696.9 1,388,470.3 687,796.8 412,387.1
Total H
2
Sell (m
3
) 7,737.3 2,161,159.4 1,074,404.4 641,651.2
Total O
2
Purchase (m
3
) 8,452.8 3,977,244.7 1,891,612.6 1,185,319.0
Total O
2
Sell (m
3
) 13,242.7 4,064,658.7 1,980,978.3 1,193,471.9
Total CO
2
Purchase (m
3
) 49,811.8 8,642,920.5 4,323,469.0 2,521,670.9
Total CO
2
Sell (m
3
) 34,190.0 5,923,805.7 2,977,017.8 1,731,421.6
Total CH
3
OH Sell (m
3
) 7,838.0 4,204,812.0 2,029,045.8 1,235,886.6
Total Coal Purchase (kg) 5,655.8 802,230.4 403,925.5 231,973.2
Total Wastewater Purchase (L) 10,494.0 1,883,808.0 956,280.2 543,677.6
Total Price Sales (Euro) 632,019.8 207,936,053.7 103,164,904.6 60,782,915.7
Total Price Purchases (Euro) 2,608,095.5 376,430,049.9 189,182,797.3 109,385,501.7
For gases like hydrogen, oxygen, and carbon diox-
ide, the terms “Total H
2
Purchase/Sell”, “Total O
2
Purchase/Sell”, and “Total CO
2
Purchase/Sell” de-
note the quantities of these gases traded in cubic me-
ters (m
3
). Similarly, “Total CH
3
OH Sell” represents
methanol sold in cubic meters (m
3
), “Total Wastewa-
ter Purchase” specifies the volume of wastewater ac-
quired, measured in liters (L), while “Total Coal Pur-
chase” specifies the amount of coal acquired, mea-
sured in kilograms (kg). “Total Price Sales” repre-
sents the total revenue generated from sales in euros,
and “Total Price Purchases” captures the total expen-
diture on purchasing resources, also in euros. These
clarifications ensure the correct interpretation of the
numerical data in the corresponding tables. To ensure
clarity in interpreting the table data, the first line of
each table includes the columns “Field”, “Min” (mini-
mum values), “Max” (maximum values), “Mean” (av-
erage values), and “Std Dev” (standard deviation).
This structure provides a comprehensive view of the
data’s range and variability, supporting detailed anal-
ysis of each field’s statistical distribution.
5.1.2 Pareto-Based Selection
In the Pareto-based Selection method, production op-
timization is achieved by considering both resource
availability and market prices. Mathematically, the
production amount P is determined by the available
amounts of each resource R
i
, their respective input re-
quirements I
i
, and the market price M
i
for each re-
source. The potential production limits L
i
for each
resource i are calculated as:
L
i
=
R
i
I
i
,
Next, the bottleneck resource is identified as the one
with the smallest production limit, which sets the
maximum feasible production amount:
P
max
= min(L
i
),
This maximum production amount is further adjusted
by considering the influence of market prices. The
final production amount P
ad justed
is calculated by tak-
ing the minimum of the production amount and the
price-adjusted resource availability:
P
ad justed
= min(
R
i
I
i
.M
i
),
Here, R
i
represents the available resource quantity, I
i
the input requirement for each unit of production,
and M
i
the market price for the resource. This opti-
mization ensures that production is both cost-efficient
and resource-efficient, balancing the availability of re-
sources and economic factors.
This approach led to a marked increase in to-
tal energy consumption and production, with energy
output in later stages reaching up to 6, 640 MWh.
Additionally, total sales and purchases were signifi-
cantly higher, reflecting heightened economic activ-
ity within the system. By integrating both market dy-
namics and resource constraints, this strategy enabled
more effective resource utilization. Notably, the sim-
ulation showed that energy production was approx-
imately one-quarter of energy consumption, with the
total energy consumed reaching 21, 329 MWh and en-
ergy produced at 6, 640 MWh by the final iteration
(Table 3). Furthermore, the quantities bought and
sold for key commodities, such as carbon dioxide, wa-
ter, hydrogen, and oxygen, remained nearly balanced
(Figure 5), indicating stable trading patterns across
multiple iterations. For instance, the total amounts
SIMULTECH 2025 - 15th International Conference on Simulation and Modeling Methodologies, Technologies and Applications
154
of carbon dioxide purchased and sold were closely
aligned, a trend also observe for other commodities,
with minimal variation over repeated cycles.
Figure 5: Commodity Transactions (Water, Hydrogen, Oxy-
gen, and CO
2
) Across Iterations for Pareto-based Selection.
5.1.3 Pareto Optimization
The Pareto Optimization method employs multi-
objective optimization to balance resource procure-
ment, production, and sales while ensuring Pareto ef-
ficiency where no resource is improved at the expense
of another. This approach minimizes procurement
costs, maximizes production efficiency, and optimizes
profits while accounting for constraints such as stor-
age capacity, market prices, demand fluctuations, and
resource availability. The production amount P is de-
termined by balancing available resources R
i
, input
requirements I
i
and market prices M
i
. Initially, the
available resources are adjusted for market price dif-
ferences, yielding the price-weighted resource avail-
ability:
R
′
i
=
R
i
M
i
,
Next, the ratios ρ
i
of available resources to their input
requirements are calculated as:
ρ
i
=
R
′
i
I
i
,
The bottleneck resource, which has the smallest ratio,
limits the production amount. Thus, the maximum
production amount P
max
is given by the resource with
the smallest ratio:
P
max
= min(ρ
i
),
This method ensures a Pareto-efficient production,
meaning no single objective (e.g., minimizing cost
or maximizing output) is improved without worsen-
ing another. By factoring in both resource availability
and price adjustments, the method achieves optimal
resource utilization and economic performance.
The algorithm first calculates resource availability
relative to market prices, giving priority to more af-
fordable resources. It then determines the maximum
feasible production amount by identifying bottleneck
resources, which are the limiting factors in produc-
tion. The Pareto optimization balances resource al-
location based on these constraints, ensuring that the
selected production plan optimizes cost-effectiveness
and production efficiency. This approach is more
sophisticated than basic selection methods as it in-
tegrates market dynamics and capacity limits, ulti-
mately leading to an efficient allocation of resources
across the facility network.
This approach achieved the highest total price
sales and the lowest price purchases, optimizing the
balance between energy consumption and production.
For example, in the final stages of the simulation,
total energy consumption surpassed 10, 842 MWh,
while total energy production reached 5, 565 MWh
(Table 4). Notably, this optimization technique led to
a considerable reduction in raw material purchases,
which positively impacted the operational cost and
resource utilization across the network. Similar to
the Pareto-based Selection method, the purchase and
sell in this approach follow a balanced and system-
atic resource allocation process (Figure 6). However,
in terms of energy consumption and production, the
Pareto Optimization method demonstrates a superior
efficiency, achieving more optimal energy usage than
other methods (Figure 7).
Figure 6: Commodity Transactions (Water, Hydrogen, Oxy-
gen, and CO
2
) Across Iterations for Pareto Optimization.
Figure 7: Comparison of Energy Purchase and Sell in
Pareto-based Selection and Pareto Optimization Methods.
Each method displayed distinct trade-offs be-
tween energy efficiency, production capacity, and
economic performance, making the Pareto Optimiza-
tion approach the most effective strategy for sus-
tainable production. The results indicate that ad-
vanced decision-making methods can significantly re-
Agent-Based Simulation Modeling for Sustainable Chemical Production and Resource Management
155

Table 3: Summary Statistics of Energy, Prices, and Material Transactions (Pareto-based Selection).
Field Min Max Mean Std Dev
Total Energy Consumed (MWh) 11.0 21,329.4 9,078.5 6,612.2
Total Energy Produced (MWh) 4.0 6,640.6 2,829.5 2,055.5
Total H
2
O Purchase (L) 984.9 2,232,767.8 915,167.9 690,953.1
Total H
2
O Sell (L) 1,012.1 2,277,045.6 933,788.2 704,521.6
Total H
2
Purchase (m
3
) 132.2 807,743.9 312,888.3 250,393.8
Total H
2
Sell (m
3
) 268.7 1,149,619.6 430,642.3 356,096.9
Total O
2
Purchase (m
3
) 397.0 1,879,904.0 740,961.1 582,796.3
Total O
2
Sell (m
3
) 516.3 2,193,816.2 824,005.5 680,273.7
Total CO
2
Purchase (m
3
) 2,455.5 4,725,099.6 1,983,431.5 1,463,308.7
Total CO
2
Sell (m
3
) 2,407.7 4,663,713.8 1,955,090.6 1,444,190.4
Total CH
3
OH Sell (m
3
) 40.9 2,095,473.4 699,146.8 648,522.5
Total Coal Purchase (kg) 267.0 475,919.5 202,648.7 147,454.9
Total Wastewater Purchase (L) 673.2 1,197,079.5 509,335.3 370,882.9
Total Price Sales (Euro) 16,518.9 138,659,035.2 48,956,108.98 42,909,722.9
Total Price Purchases (Euro) 122,871.4 223,658,461.6 95,048,939.4 69,299,005.8
Table 4: Summary Statistics of Energy, Prices, and Material Transactions (Pareto Optimization).
Field Min Max Mean Std Dev
Total Energy Consumed (MWh) 0.0 10,842.7 4,001.4 3,511.0
Total Energy Produced (MWh) 0.0 5,565.6 2,171.4 1,736.1
Total H
2
O Purchase (L) 846.0 1,888,945.6 801,317.3 594,864.5
Total H
2
O Sell (L) 882.0 2,042,219.5 861,946.5 639,048.3
Total H
2
Purchase (m
3
) 130.3 797,192.7 302,807.7 245,726.9
Total H
2
Sell (m
3
) 260.6 1,128,242.0 409,677.3 347,200.5
Total O
2
Purchase (m
3
) 343.0 2,194,182.1 807,061.6 678,033.65
Total O
2
Sell (m
3
) 446.0 2,337,957.8 823,313.3 721,073.3
Total CO
2
Purchase (m
3
) 2,418.9 4,716,858.8 1,979,621.4 1,459,026.9
Total CO
2
Sell (m
3
) 2,418.9 4,661,324.5 1,954,031.7 1,441,608.1
Total CH
3
OH Sell (m
3
) 0.0 2,078,860.0 688,369.8 644,578.1
Total Coal Purchase (kg) 252.7 474,804.7 202,517.3 147,283.7
Total Wastewater Purchase (L) 540.0 1,092,150.0 474,468.3 342,149.0
Total Price Sales (Euro) 12,347.7 131,024,730.2 45,056,517.7 40,638,311.4
Total Price Purchases (Euro) 114,409.6 221,473,197.2 94,073,347.6 68,913,709.8
duce costs and improve resource utilization in the in-
dustrial networks.
5.2 Analysis
The Resource Availability-Based Selection method
shows a steady rise in energy consumption and pro-
duction over the iterations (Section 5.1.1). However,
its efficiency plateaus when compared to more ad-
vanced methods. This behavior is attributed to the
method’s dependence on available resources in stor-
age, which, although ensuring that the facility does
not exceed its input constraints, limits optimization
potential. The method lacks flexibility in handling
dynamic market prices or external factors, making it
less responsive to changes in resource costs. As a re-
sult, energy consumption increases to 508,000 MWh
by the final step, while energy production peaks at
254,485 MWh. Additionally, discrepancies in mate-
rial transactions, particularly in CO
2
purchases and
sales, highlight the limitations of this approach in bal-
ancing resource inflows and outflows effectively.
The Pareto-based Selection method, designed to
optimize production by considering both resource
availability and market prices, demonstrates signifi-
cant improvements in efficiency (Section 5.1.2). This
approach achieves better resource allocation by mini-
mizing costs and maximizing production outputs. For
instance, by factoring in market dynamics, the method
maintains a closer balance between energy consump-
tion and production, with the final energy consump-
tion exceeding 21,000 MWh and production reaching
SIMULTECH 2025 - 15th International Conference on Simulation and Modeling Methodologies, Technologies and Applications
156

6,640 MWh. Material transactions, such as water, hy-
drogen, oxygen, and carbon dioxide, show more sta-
bility in terms of purchase and sell quantities, lead-
ing to more balanced operations. The results confirm
that the Pareto-based approach outperforms simpler
resource allocation strategies by effectively leverag-
ing market conditions alongside resource availability.
The Pareto Optimization method further refines
the multi-objective approach by focusing on maxi-
mizing production efficiency while minimizing op-
erational costs (Section 5.1.3). This method consis-
tently produces the most optimal results, with en-
ergy consumption reaching over 10,800 MWh and en-
ergy production nearing 5,565 MWh by the final step.
Notably, the method achieves a significant reduction
in raw material purchases compared to the previous
approaches, as it strategically prioritizes cheaper re-
sources and ensures that each production decision is
Pareto-optimal. This leads to overall improvements
in network efficiency, with the total purchase and
sell amounts for various commodities closely aligned.
The superior performance of Pareto Optimization, in
comparison to the other two methods, demonstrates
its capability in managing resource constraints and
market fluctuations effectively.
In conclusion, while all three methods have their
merits, Pareto-based Selection and Pareto Optimiza-
tion clearly outperform the Resource Availability-
Based approach, particularly in scenarios involving
dynamic markets. Pareto Optimization, in particular,
achieves the most efficient balance between energy
consumption, production, and material transactions,
making it the most effective method for large-scale
industrial applications.
5.3 Implications
The simulation framework developed in this study has
significant implications for both sustainable chemical
production and broader industrial applications. By
employing the Resource Availability-Based Selection
method, facilities can align production with available
input resources, minimizing energy consumption and
resource waste while improving overall efficiency.
This approach reduces environmental impact, particu-
larly in resource-intensive industries, by ensuring op-
erations remain within input constraints. Similarly,
the Pareto-based Optimization strategy enables facil-
ities to balance multiple objectives, such as minimiz-
ing raw material purchases and maximizing produc-
tion, ultimately lowering operational costs and emis-
sions. These strategies enhance economic viability
while promoting sustainability and regulatory compli-
ance. Beyond chemical production, the framework’s
adaptability extends to industries such as logistics,
energy, and supply chain management. In logistics,
resource-aligned decision-making can optimize trans-
portation routes and inventory control, reducing costs
and inefficiencies. In the energy sector, Pareto-based
optimization can balance energy generation and con-
sumption based on resource availability, fuel costs,
and environmental factors, providing a valuable tool
for managing renewable energy fluctuations. Addi-
tionally, in global supply chains, where resource costs
and availability vary regionally, the framework opti-
mizes inventory levels and production schedules, en-
suring efficient and sustainable operations. These
diverse applications highlight the model’s flexibility
in improving resource management and sustainability
across multiple industries.
5.4 Future Research
While this study provides valuable insights into re-
source optimization and energy efficiency in sustain-
able chemical production, several limitations high-
light areas for future research. The model simpli-
fies market conditions, assuming stable input prices
and supply chains, which may not reflect real-world
volatility. Additionally, it focuses on a limited set of
materials, excluding catalysts, secondary emissions,
and waste management complexities. Spatial assump-
tions, though accounting for geographic distribution,
overlook transportation logistics and regional price
variations critical for large-scale operations. Further-
more, the model does not distinguish between renew-
able and non-renewable energy sources or consider
energy transmission losses, limiting its sustainability
assessment. Economic and regulatory factors, such
as taxes and subsidies, are also omitted, restricting its
policy applicability. Future research should integrate
dynamic market conditions, refine spatial logistics,
incorporate renewable energy considerations, and ex-
pand material scope to enhance the model’s realism
and applicability in industrial sustainability.
6 CONCLUSIONS
This study explored the optimization of resource allo-
cation and energy efficiency within sustainable chem-
ical production networks using three distinct meth-
ods: Resource Availability-Based Selection, Pareto-
based Selection, and Pareto Optimization. Each
method demonstrated unique strengths in manag-
ing resource inputs and energy consumption. The
Resource Availability-Based Selection method fo-
cused on aligning production output with available
Agent-Based Simulation Modeling for Sustainable Chemical Production and Resource Management
157

resources in storage, resulting in a steady increase in
energy consumption and production over time. How-
ever, it exhibited limitations in maximizing efficiency
compared to more advanced methods. The Pareto-
based Selection method balanced input prices with re-
source availability, leading to more efficient produc-
tion outcomes and higher economic activity. Lastly,
the Pareto Optimization approach, as the most ad-
vanced method, consistently minimized operational
costs while maximizing production efficiency, yield-
ing the highest total price sales and demonstrating op-
timal energy use.
The findings highlight the significance of multi-
objective optimization in improving resource man-
agement and production processes in chemical indus-
tries. By leveraging Pareto Optimization, companies
can achieve a more balanced approach to energy use
and resource allocation, ultimately enhancing both
economic and environmental sustainability. However,
the study also acknowledges that real-world complex-
ities, such as market fluctuations and logistical con-
straints indicating areas for further improvement.
Based on the results, it is recommended that
chemical production facilities adopt multi-objective
optimization techniques like Pareto Optimization to
enhance operational efficiency and sustainability. Fu-
ture research should focus on incorporating dynamic
market conditions, transportation logistics, and re-
newable energy sources into optimization models.
Additionally, considering regulatory and economic
factors, such as carbon pricing and subsidies, will of-
fer a more comprehensive view of sustainability in
chemical production. By adopting these improve-
ments, industries can better align with global sustain-
ability goals while maintaining economic viability.
ACKNOWLEDGEMENTS
We would like to thank all our partners of the project
Carbon2Chem
®
for the pleasant and successful in-
terdisciplinary collaboration. Also, we would like to
thank the Federal Ministry of Education and Research
(BMBF) for funding the project Carbon2Chem
®
(project number 03EK3037D).
REFERENCES
Aghaie, A. and Hajian Heidary, M. (2019). Simulation-
based optimization of a stochastic supply chain con-
sidering supplier disruption: Agent-based model-
ing and reinforcement learning. Scientia Iranica,
26(6):3780–3795.
El-Shafie, M. (2023). Hydrogen production by water elec-
trolysis technologies: A review. Results in Engineer-
ing, page 101426.
Fadillah, G., Alarifi, N. T., Suryawan, I. W. K., and Saleh,
T. A. (2024). Advances in designed reactors for water
treatment process: A review highlighting the designs
and performance. Journal of Water Process Engineer-
ing, 63:105417.
Haleem, A., Javaid, M., Singh, R. P., Suman, R., and Qadri,
M. A. (2023). A pervasive study on green manufactur-
ing towards attaining sustainability. Green Technolo-
gies and Sustainability, 1(2):100018.
Helo, P. and Rouzafzoon, J. (2023). An agent-based sim-
ulation and logistics optimization model for manag-
ing uncertain demand in forest supply chains. Supply
Chain Analytics, 4:100042.
Ionescu, S¸., Delcea, C., Chirit¸
˘
a, N., and Nica, I. (2024). Ex-
ploring the use of artificial intelligence in agent-based
modeling applications: A bibliometric study. Algo-
rithms, 17(1):21.
Long, Q. (2014). Distributed supply chain network mod-
elling and simulation: integration of agent-based dis-
tributed simulation and improved scor model. Inter-
national journal of production research, 52(23):6899–
6917.
Mishra, K., Siwal, S. S., Nayaka, S. C., Guan, Z., and
Thakur, V. K. (2023). Waste-to-chemicals: Green so-
lutions for bioeconomy markets. Science of The Total
Environment, 887:164006.
Okunlola, A., Davis, M., and Kumar, A. (2023). Assess-
ing the cost competitiveness of electrolytic hydrogen
production from small modular nuclear reactor-based
power plants: A price-following perspective. Applied
Energy, 346:121290.
Singh, V., Buelens, L. C., Poelman, H., Saeys, M., Marin,
G. B., and Galvita, V. V. (2022). Carbon monoxide
production using a steel mill gas in a combined chem-
ical looping process. Journal of Energy Chemistry,
68:811–825.
Sollai, S., Porcu, A., Tola, V., Ferrara, F., and Pettinau, A.
(2023). Renewable methanol production from green
hydrogen and captured co2: A techno-economic as-
sessment. Journal of CO2 Utilization, 68:102345.
Venkataramanan, V. S. and Srinivasan, R. (2024). Agent-
based dynamic simulation for supply chain manage-
ment of lng import terminals. Industrial & Engineer-
ing Chemistry Research, 63(6):2750–2768.
Zhou, L., Chen, G., Zheng, M., Gao, X., Luo, C., and
Rao, X. (2024). Agent-based modeling methodology
and temporal simulation for natech events in chemi-
cal clusters. Reliability Engineering & System Safety,
243:109888.
Zhu, M., Yang, G., Jiang, Y., and Wang, X. (2023). Agent-
based modeling for water–energy–food nexus and its
application in ningdong energy and chemical base.
Sustainability, 15(14):11428.
SIMULTECH 2025 - 15th International Conference on Simulation and Modeling Methodologies, Technologies and Applications
158
