
Designing Actionable and Interpretable Analytics Indicators for
Improving Feedback in AI-Based Systems
Esther F
´
elix
1 a
, Elaine De Oliveira
2 b
, Ilmara M. M. Ramos
2
, Mar Perez-Sanagustin
1 c
,
Esteban Villalobos
1 d
, Isabel Hilliger
3 e
, Rafael Ferreira Mello
4 f
and Julien Broisin
1 g
1
Universite de Toulouse - IRIT - CNRS, France
2
Universidade Federal do Amazonas, Brazil
3
Pontificia Universidad Cat
´
olica de Chile, Chile
4
CESAR, Brazil
Keywords:
Feedback, Learning Analytics, Card Sorting, Human-Computer Interaction, User-Centered Approach.
Abstract:
In AI-based educational systems, transparency and understandability are particularly important to ensure re-
liable human-AI interaction. This paper contributes to the ongoing research on developing analytics for AI-
based educational systems by delivering feedback throughout indicators that learners can easily interpret and
act upon during their studies. Specifically, this paper introduces a mixed methods study that examines the
types of indicators that ought to be incorporated into the feedback offered by an AI-based system designed to
help students develop competencies in programming. Building upon prior work in Human-Centered Design,
the card sorting technique was used to collect both qualitative and quantitative data from 31 Computer Sci-
ence students. We created 16 cards that presented students with different indicators to explain the reasoning
behind the system’s decisions and feedback. These indicators were displayed in different formats (visual and
textual representations; temporal vs. non-temporal and social vs. non-social reference frames). Our goal was
to discover the most interpretable and actionable method for delivering feedback to learners. Our study found
low consensus among students. Overall, students found indicators based on social comparison to be less ac-
tionable and interpretable compared to those without; and textual indicators were perceived as less actionable
and interpretable than visual ones.
1 INTRODUCTION
1.1 Designing Effective Feedback for
Learning Analytics in AI-Based
Educational Systems
The growing availability of educational data has led
to increasingly complex statistical models, promis-
ing significant improvements in learning. However,
their effectiveness relies on how clearly and action-
a
https://orcid.org/0009-0007-6905-8939
b
https://orcid.org/0000-0003-2884-9359
c
https://orcid.org/0000-0001-9854-9963
d
https://orcid.org/0000-0002-6026-3756
e
https://orcid.org/0000-0001-5270-7655
f
https://orcid.org/0000-0003-3548-9670
g
https://orcid.org/0000-0001-8713-6282
able their outputs are for students. In Learning An-
alytics, a key challenge is designing feedback indi-
cators that are both interpretable and actionable, en-
abling students to adjust their behaviors effectively to
improve learning outcomes (
´
Alvarez et al., 2022).
These goals align with the field of Explainable
Artificial Intelligence (XAI), which focuses on fos-
tering user trust and understanding in educational AI
systems (Khosravi et al., 2022). Specifically, within
the technology-enhanced learning (TEL) community,
explainability is seen as a critical area for explo-
ration and development of solutions aimed at enhanc-
ing the transparency of AI-based educational sys-
tems, thus fostering transparent and trustworthy inter-
actions between humans and AI in learning environ-
ments (Sharples, 2023). However, beyond explain-
ability, it is essential that indicators are also action-
able: that is, they enable students to take concrete
steps to improve their learning.
428
Félix, E., De Oliveira, E., Ramos, I. M. M., Perez-Sanagustin, M., Villalobos, E., Hilliger, I., Mello, R. F. and Broisin, J.
Designing Actionable and Interpretable Analytics Indicators for Improving Feedback in AI-Based Systems.
DOI: 10.5220/0013294300003932
In Proceedings of the 17th International Conference on Computer Supported Education (CSEDU 2025) - Volume 1, pages 428-435
ISBN: 978-989-758-746-7; ISSN: 2184-5026
Copyright © 2025 by Paper published under CC license (CC BY-NC-ND 4.0)

1.2 Towards Actionable and
Interpretable Feedback
Across previous research in TEL, incorporating ex-
plainability into Artificial Intelligence in Education
(AIED) systems means offering ”actionable” expla-
nations (Khosravi et al., 2022). Actionability refers
to the extent to which information supports and en-
courages students in modifying their behavior effec-
tively. Therefore, the explanations delivered to users
should facilitate the initiation of corrective actions or
feedback loops in response to their activities (Jørnø
and Gynther, 2018). In line with this, as proposed
by Winne (2021), explanations should not only clar-
ify how results are derived, but also be coupled with
feedback that motivates individuals to reflect or take
action. Actionability is inevitably related to the stu-
dents’ capacity to interpret the indicators they are pro-
vided with, as interpretability is defined as a high un-
derstandability of the information presented.
This is were the concepts of actionability and in-
terpretability are key for providing explainable AI-
based systems for end users. In the field of Learn-
ing Analytics, research have extensively focus on
dashboards to effectively transform trace data into
”actionable insights” able to change students’ be-
haviour (
´
Alvarez et al., 2022). Still, previous research
shows that the indicators proposed in this objective
of promoting actionable insight often fail to induce
a change in the students’ behaviour (Jørnø and Gyn-
ther, 2018; Villalobos et al., 2023), emphasizing the
need to investigate how to make indicators more in-
terpretable and actionable (van Leeuwen et al., 2022).
2 CONTEXT, OBJECTIVES AND
RESEARCH QUESTION
Our study was conducted in a Brazilian university,
as part of a joint research project between Brazil
and France. Both French and Brazilian universities
use tools for computer science students, in which
AI-based feedback can be implemented. This study
builds on a prior investigation conducted in a French
university, where students interacted with an AI-
based programming tool that used unsupervised ma-
chine learning to classify their programming behav-
iors into distinct profiles. These profiles were deter-
mined based on engagement and performance met-
rics such as code submission frequency, error rates,
and time spent between submissions. Feedback pro-
vided by the system included textual explanations: (1)
suggestions for improvement based on past behavior,
and (2) explanations of how the system classified their
profiles using the algorithm’s features (F
´
elix et al.,
2022).
The findings from this prior study revealed key
limitations. Students reported that the textual feed-
back provided was unattractive, difficult to interpret,
and insufficient to build trust in the system. Several
participants expressed a strong preference for graph-
ical explanations over textual ones. These observa-
tions suggest that while students value transparency,
the format and delivery of feedback play a critical role
in its effectiveness.
Considering these previous results and building
upon other research highlighting the role of explana-
tions in increasing system trust (Conati et al., 2021),
the present study aims to push our research forward
by creating actionable and interpretable explanations
to help build trust among students in our AI-based
programming learning environment. We employed
the card sorting technique as our approach to evalu-
ate the design for this type of feedback, so that it can
be implemented in future works in both France and
Brazil. The card sorting method is commonly used in
Human-Computer Interaction (HCI) to gather insights
into user-centered design practices, card sorting aids
in making informed decisions about designing indi-
cators (Spencer and Garrett, 2009). It examines how
individuals categorize various items, seeking to iden-
tify common patterns in their thought processes. Al-
though this method has been previously applied with
similar goals (Villalobos et al., 2023), prior works of-
ten proposed abstract indicators without practical ap-
plications.
Our main objective is to improve the feed-
back provided to students in our programming
tool by empirically evaluating how different de-
signs of indicators impact students’ ability to
engage with and interpret AI-driven feedback.
Specifically, we designed a collection of indica-
tors of diverse types—visual/textual, temporal/non-
temporal, social/non-social, high-performance/low-
performance. We then applied the card sorting
method used in previous studies (Villalobos et al.,
2023) to assess and compare the various indicator
designs that could be implemented in our AI-based
system for programming education. Students were
asked to arrange the cards along a two-dimensional
axis of interpretability and actionability. Therefore,
the main research question addressed is the follow-
ing: To what extent are the proposed indicator de-
signs understandable (interpretable and actionable)
depending on their type (visual/textual, temporal/non-
temporal, social/non-social, high-performance/low-
performance)?
Designing Actionable and Interpretable Analytics Indicators for Improving Feedback in AI-Based Systems
429
3 METHODS: CARDS DESIGN,
PARTICIPANTS, PROCEDURE
AND DATA COLLECTION
For our study, we chose a concurrent mixed-methods
approach that combines both qualitative and quantita-
tive data. We designed and conducted our card sorting
based on guidelines by Spencer and Garrett (2009),
to ensure we collected clear, useful insights. The in-
dicators and scenario selected are based on our pre-
vious study regarding explainability in a technology-
enhanced environment where programming student
learn coding skills (F
´
elix et al., 2022).
3.1 Cards Design
We developed 16 cards representing feedback indica-
tors, classified into key categories based on prior re-
search (Jivet et al., 2020; Molenaar and Wise, 2022;
Villalobos et al., 2023). First, temporal versus
non-temporal. As emphasized by Molenaar and
Wise (2022), including temporality helps contextual-
ize feedback. Temporal indicators provided weekly
data alongside comparisons to previous weeks (repre-
sented with line graphs), while non-temporal indica-
tors only displayed current data (using radar graphs).
Textual versions included or omitted references to
prior weeks accordingly. (2) Then, social versus non-
social. Based on Jivet et al. (2020), social indica-
tors included comparisons with the class, while non-
social indicators presented individual performance
only. Thirdly, following Vytasek et al. (2020), indi-
cators were designed to reflect how feedback would
appear for both high-achieving and low-achieving
students.
Each indicator was created in both textual and vi-
sual formats, as suggested by Villalobos et al. (2023),
resulting in 16 cards covering all combinations of the
studied dimensions. Table 1 outlines the card classi-
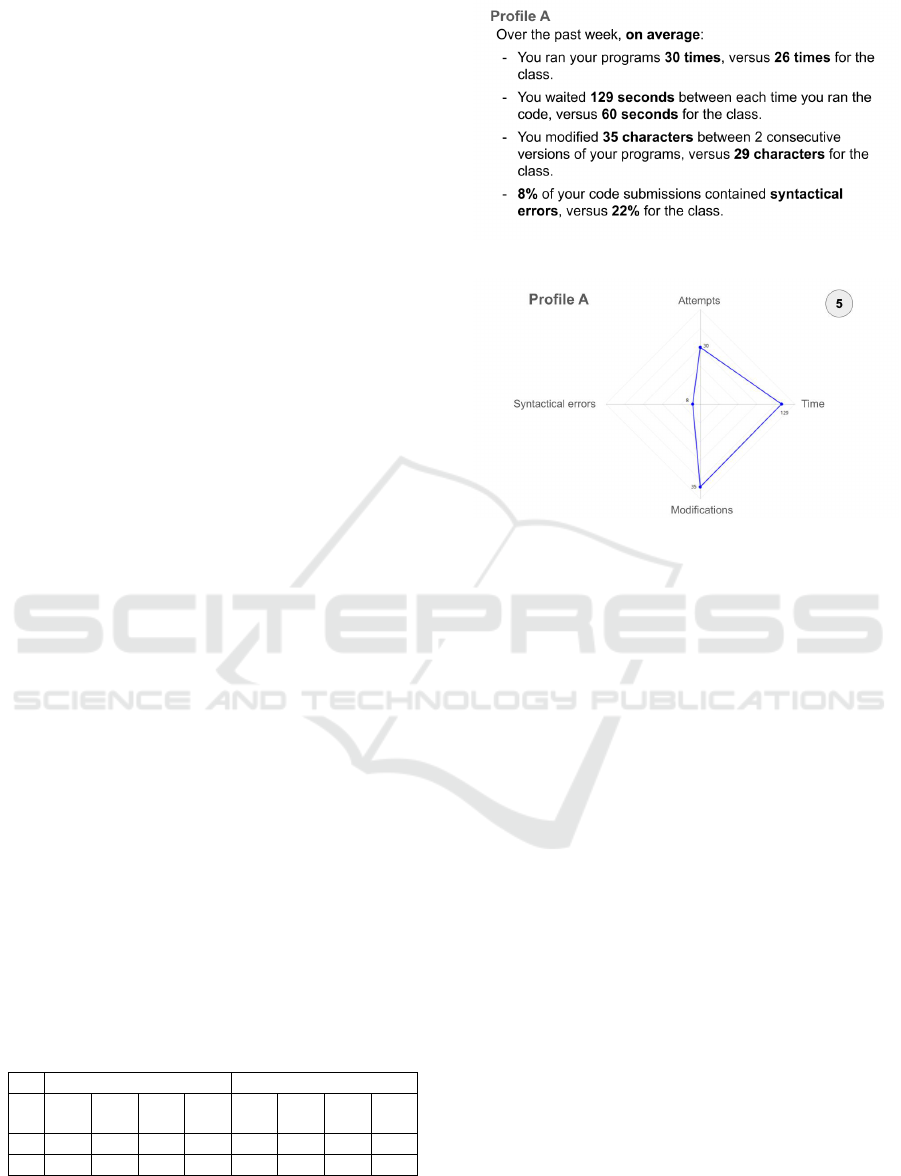
fications, and figures 1 and 2 provide examples. The
full card set is available upon request.
Table 1: Types of cards designed for the study, accord-
ing to the dimensions investigated (+ corresponds to high-
achiever, and - to low-achiver, V to Visual, T to Text, S to
Social and NS to Non-Social).
Non Temporal Temporal
S+ S- NS+ NS- S+ S- NS+ NS-
V C1 C3 C5 C7 C9 C11 C13 C15
T C2 C4 C6 C8 C10 C12 C14 C16
Figure 1: Card number 2 translated in English (C2): textual,
high-achiever, social comparison, non temporal.
Figure 2: Card number 5 (C5): graph, high-achiever, no
social comparison, non temporal.
3.2 Participants
A total of 31 computing students (18 men, 13 women)
from a public Brazilian university participated in
the study. This population was selected due to the
programming-specific nature of the indicators. Stu-
dents were recruited via email invitations, with partic-
ipation being voluntary and rewarded with extra ”re-
search” credits. Participants selected convenient time
slots and provided informed consent before joining
the study.
3.3 Procedure and Data Collection
We conducted four one-hour workshop sessions in
English and Portuguese. One researcher, fluent in En-
glish, led the session with support from a Portuguese-
speaking researcher to ensure students fully under-
stood the material and could ask questions. A third
researcher was in charge of taking pictures of the
students’ productions. All workshop sessions were
structured into different phases.
First, students were welcomed and thanked for
their participation, after which the researcher briefly
outlined the study’s objectives and explained the
workshop structure, presenting a scenario in which
participants, as programming students, interacted
with an AI-based platform providing feedback on
their programming profiles; this introduction included
CSEDU 2025 - 17th International Conference on Computer Supported Education
430
16 indicator cards alongside three explanatory cards
detailing the scenario (”You are a computer science or
software engineering student enrolled in a program-
ming course. The practical work takes place over
a period of several weeks on an online platform on
which you are required to solve exercises and write
short programs. The platform collects data which is
then processed by an artificial intelligence algorithm
that identifies your programming profile. This profile
corresponds to the strengths and weaknesses of your
programming style, and is accompanied by advice on
how to improve. As researchers, we want to know
what information is relevant to you, and what pre-
sentation of information is most understandable and
can lead you to take action to improve your way of
programming. The indicators we ask you to evalu-
ate could be provided to students corresponding to
one of two profiles”), an example of feedback for pro-
file A (”Congratulations! Over the past week, we’ve
seen that you’ve implemented some good strategies
for making effective progress. In particular, it seems
you took enough time to think about your programs
before writing them. Keep it up!”), and an example
of feedback for profile B (”We noticed that last week,
you have used a ”trial and error” strategy in your pro-
gramming. This means that you probably submitted a
lot of code with errors without taking the time to re-
flect on it. Try to spend more time to think about your
code before running it!”).
Then, each student reviewed the 16 cards over a
10-minute period, with an opportunity to ask clarify-
ing questions, before individually ranking the cards
on a two-dimensional grid, with the horizontal axis
representing actionability (”Not at all actionable” to
”Very actionable”) and the vertical axis representing
interpretability (”Not at all interpretable” to ”Very in-
terpretable”), ensuring that all participants evaluated
the cards uniformly (irrespective of their own aca-
demic performance, which was not considered in the
study).
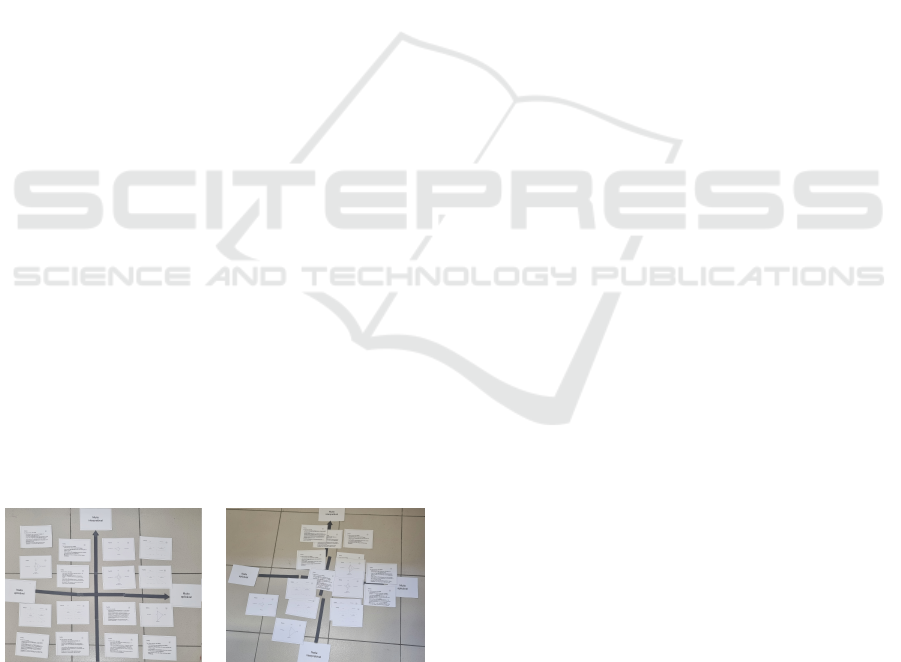
Figure 3: Examples of grids sorted by students.
Finally, after completing the card sorting, students
were asked to write a paragraph explaining the ra-
tionale behind their card placements, and researchers
collected both photographs of the final grids and the
written justifications for further analysis.
3.4 Analytical Methods
Quantitative Analysis. Photographs of the students’
grids were used to calculate two key metrics: the aver-
age ranking of different indicator types and the level
of agreement between students. Each card was as-
signed a score from 1 (lowest preference) to 16 (high-
est preference) based on its placement on the grid.
The rank scores allowed for statistical analysis, with
the Kendall Tau-b correlation coefficient employed to
measure agreement levels for interpretability and ac-
tionability across all pairs of students. The coefficient
values ranged from -1 (complete disagreement) to 1
(complete agreement).
Qualitative Analysis. Following the guidelines of
Nowell et al. (2017), the rationale paragraphs writ-
ten by students were analyzed using a six-step pro-
cess. First, the texts were translated from Portuguese
to English, enabling all researchers to review them.
Initial codes were then generated based on the de-
sign dimensions of the cards (text vs. visual, high-
performance vs. low-performance, social vs. non-
social, and temporal vs. non-temporal). Researchers
collaborated to identify three main themes: action-
ability, interpretability, and preferred indicators. Rel-
evant quotes were selected to support the themes, and
the frequency of codes and themes in the students’ re-
sponses was quantified to provide further insights.
4 RESULTS
Quantitative Results. The analysis of actionabil-
ity rankings revealed a weak level of agreement
among students, with an average Kendall Tau-b cor-
relation coefficient of 0.09. About 34.02% of stu-
dent pairs showed negative correlations, indicating re-
versed preferences. Visual indicators were preferred
over textual ones (mean scores of 9.14 and 7.90, re-
spectively), while temporal and non-temporal cards
scored similarly for actionability (both around 8.5).
Non-social indicators were favored over social ones
(9.95 vs. 7.05), and high-performance cards were
slightly preferred over low-performance ones (8.62
vs. 8.38).
For interpretability, the agreement among students
was also weak, with a mean Kendall Tau-b coeffi-
cient of 0.04. Visual indicators (9.04) were again
preferred over textual ones (7.96), and temporal in-
dicators were found more interpretable (9.20) than
non-temporal ones (7.80). Non-social cards (9.21)
were rated higher than social cards (7.79). High-
performance and low-performance cards were rated
similarly for interpretability (8.46 vs. 8.54).
Designing Actionable and Interpretable Analytics Indicators for Improving Feedback in AI-Based Systems
431

The most actionable and interpretable card was
Card 5, representing a visual, non-social, non-
temporal indicator for a high-achieving student. In
contrast, Card 4 (its textual counterpart) was rated the
least actionable, and Card 2 the least interpretable.
Figure 4 is a graphical representation of the cards
repartition, with for instance Card 5 in the top right
corner and Card 2 and 4 in the bottom left corner.
Figure 4: Repartition of the 16 cards in terms of actionabil-
ity and interpretability.
Qualitative Results. In the justifications provided by
students for their card ranking choices based on ac-
tionability and interpretability, we observed that 61%
of the participants (19 students) explicitly mentioned
the textual or visual aspect as a criteria used for their
choices. Among them, 3 students showed prefer-
ence towards texts (e.g. Student 15: ”I found the
written feedback better to understand, especially be-
cause many people have difficulty interpreting graph-
ics”) while 7 students were more positive towards
the graphs. The other students either only mentioned
those aspects as a criteria without providing details
on their reasoning (Student 5: ”I analysed the differ-
ence between the graphs and texts to distinguish be-
tween those that were very or not at all interpretable”),
or were more nuanced (for example, Student 6 finds
graphs more actionable but less interpretable).
Additionally, 61% (19 students) referenced the so-
cial comparison aspect. The vast majority (18) of
them were in favour of social comparison, with state-
ments such as ”compared to the average of the class is
easier to understand what I need to improve or I’m do-
ing good” (Student 24). Only one student stated that
”data that compare your performance with the class
can be discouraging” (Student 23).
Temporality was mentioned by 26% (8) of the stu-
dents. 5 students were in favour of information about
the evolution through time, while 3 students were
more nuanced or preferred no temporal information
(e.g. Student 24: ”The details of the weeks seemed
too much and hard to understand but I think is ac-
tionable to some extent because if the student knows
what they did differently in that week they can im-
prove/change”).
Finally, 13% (4 students) commented on the two
profiles, whether high- or low-performance. Among
those, 2 preferred cards represented high-achieving
profiles (e.g. Student 3: ”I chose the cards with the
highest number of errors as not actionable and inter-
pretable”), and 2 students cited the profiles as a cri-
teria when ranking the cards without explaining the
details.
5 DISCUSSION OF THE RESULTS
5.1 Comparison of the Dimensions
Textual vs Visual. Our study shows that there is a
preference of students’ for visual elements over tex-
tual elements in terms of both actionability and in-
terpretability. This findings aligns with the results
reported by Clark et al. (2004), K
¨
uhl et al. (2011)
and Kuhlmann and Fiorella (2022), who showed that
explanatory visuals are usually more effective than
text alone. However, these results are not entirely
consistent with the preferences students expressed in
their rationale. Some students found text easier to in-
terpret. Despite both representations conveying the
same information, some students perceived the texts
as more detailed. This aversion to graphs may stem
from varying levels of data literacy among students.
Indeed, research by Park and Jo (2015) indicates that
the ease of interpreting graphs can depend on a stu-
dent’s data literacy skills, explaining why some stu-
dents exhibit mixed feelings about graphs and prefer
textual information. In AI-based systems, were the
models are difficult to explain, adding text could po-
tentially help students with less data literacy compe-
tencies in trusting the system. While the study con-
firms a general preference for visual elements regard-
ing actionability and interpretability, it also uncovers
nuanced and contrasting preferences through quali-
tative data analysis. This suggests that promoting
students’ trust on AI-based feedback systems would
require further exploration on students’ preferences.
This also confirms the call from other researchers
about the need of personalizing AI-based educational
systems feedback (Ouyang and Jiao, 2021; Khosravi
et al., 2022). In summary, the study not only reaf-
firms the general preference for visual explainability
elements in terms of actionability and interpretability
but also delves into the nuanced and contrasting pref-
erences that emerge from the qualitative data. The
exploration of these preferences within the context of
data literacy provides valuable insights into the com-
plexities of how individuals interact with and interpret
different types of information representations.
CSEDU 2025 - 17th International Conference on Computer Supported Education
432

Social Comparison and Profiles. Contrary to prior
findings (Villalobos et al., 2023), our study revealed
that non-social cards were generally perceived as
more actionable than those incorporating social com-
parison. However, qualitative data showed that many
students viewed social comparison positively for its
ability to provide context and clarity. This dual-
ity highlights both the motivational potential of so-
cial comparison and its risks, as some students found
it discouraging or intimidating. For example, one
student remarked that comparing performance with
peers could reduce confidence.
These mixed responses align with existing re-
search, which identifies social comparison as a con-
tentious element in feedback design (Bayrak et al.,
2021; Vytasek et al., 2020). While some studies
report a preference for social comparison in dash-
boards (Bodily et al., 2018; Schumacher and Ifen-
thaler, 2018), others note its potential to generate neg-
ative emotions (Guerra et al., 2016). Preferences of-
ten depend on students’ goals, such as mastering a
subject versus merely passing a course (Jivet et al.,
2020; Villalobos et al., 2023). Our analysis found that
high-performance profiles with social comparison re-
ceived slightly higher scores than low-performance
profiles, suggesting that social comparison may be
more beneficial for high-achieving students. To mit-
igate its negative effects, feedback design should ac-
count for individual characteristics, such as academic
performance and personal goals (Vieira et al., 2018).
Offering options to personalize the inclusion or type
of social comparison could foster a more supportive
and effective learning experience, reducing the risk of
discouragement.
Temporality and Self-Regulation. Unlike previous
findings where temporal cards were preferred (Vil-
lalobos et al., 2023), our study found no global pref-
erence for temporality in terms of actionability. This
discrepancy may be due to differences in graph types
(line vs. radar), as students tend to prefer visual-
izations they find more familiar (Kuosa et al., 2016;
Clark et al., 2004; Sahin and Ifenthaler, 2021). While
some students appreciated temporal information for
tracking progress, others found it confusing, as noted
in one comment: ”although useful to see the evolu-
tion, it is not much interpretable.” Temporal indica-
tors were rated slightly higher for interpretability, par-
ticularly for high-performing profiles, suggesting that
students prefer comparing progress when their perfor-
mance is strong.
Previous findings indicated that framing indica-
tors in a temporal context facilitated self-regulated
learning by providing benchmarks for students to
track their progress (Villalobos et al., 2023). How-
ever, our study concentrates on shorter scenarios that
offer task-specific guidance, alongside detailed feed-
back and advice. This approach presents a nuanced
view of the impact of temporality, suggesting that di-
rect, task-oriented support can modify the perceived
significance of temporal indicators. This nuanced ap-
proach emphasizes the need to consider the specific
educational context and support mechanisms when
evaluating the role of temporal indicators in enhanc-
ing students’ trust in the system and therfore, on their
learning experiences.
5.2 Implications for Designing
Actionable and Interpretable
Indicators in AI-Based Systems
Our study provides valuable insights for designing
actionable and interpretable feedback indicators in
AI-based educational systems, with implications
for both researchers and practitioners. These impli-
cations address critical considerations such as the
format of indicators (visual vs. textual), the inclusion
of social comparisons, and the balance between
short-term and long-term feedback.
Visual vs. Textual Indicators. The results indicate
a clear preference for visual indicators over textual
ones in terms of both actionability and interpretabil-
ity. Visual formats, such as graphs, enable students to
quickly grasp key insights, making them particularly
effective for fostering actionable learning behaviors.
However, the study also highlights the diversity
of preferences, with some students finding textual
indicators easier to understand due to their perceived
detail and clarity. This suggests that a combined
approach is optimal: using visuals as the primary
medium to convey information, complemented by
textual explanations to support students with lower
data literacy.
Social vs. Individual Feedback. The study reveals
nuanced perspectives on social comparisons. While
non-social indicators were generally perceived as
more actionable, qualitative feedback shows that
many students appreciate social comparisons for
their ability to contextualize individual performance
within a group setting. However, the potential for dis-
couragement among low-performing students under-
scores the need for caution when incorporating social
elements. Designers should consider offering person-
alized options, allowing students to toggle between
social and individual views or tailoring the level of
social comparison based on the learner’s performance
and goals. For example, high-achieving students may
benefit more from comparative metrics, while low-
Designing Actionable and Interpretable Analytics Indicators for Improving Feedback in AI-Based Systems
433

performing students may respond better to indi-
vidual progress indicators.
Temporal Feedback: Single Session vs. Multi-
Session. Temporal indicators, which provide insights
into progress across sessions, were found to enhance
interpretability but elicited mixed reactions regarding
actionability. Some students valued the ability to
track long-term progress, while others found it
overwhelming or confusing. This highlights the
importance of designing temporal feedback with
user preferences in mind. Systems should offer
flexible temporal views, enabling learners to focus
on session-specific data when needed while also
being able to access historical trends for broader
self-regulation and reflection. For example, toggles
or filters can provide a seamless way to customize
temporal feedback according to individual learning
needs.
Recommendations for Dashboard Design. Given
that this dashboard will be implemented in a real-
world tool, the following recommendations can guide
its development: (1) prioritize visual representations:
use graphs and charts to present key insights, en-
suring they are intuitive and easy to interpret; (2)
provide textual explanations: complement visual
feedback with short textual summaries to enhance
understanding, especially for users with varying
data literacy; (3) enable personalization: allow
users to customize their dashboards by toggling
between social comparisons, temporal views, and
feedback formats, as personalization can improve
user engagement and align feedback with individual
learning goals (Smith, 2019); and (4) adapt feedback
to user profiles: consider learner-specific factors,
such as performance levels and preferences, to design
indicators that increase engagement.
Broader Implications for System Designers. From
a broader design perspective, our findings highlight
the need for feedback indicators in learning analytics
systems to (1) prioritize clarity and usability,
ensuring they are accessible to diverse users; (2) to
address data literacy by combining visuals and text
with explanatory resources to build trust; and (3) to
balance motivation and transparency, using social
comparisons thoughtfully and tailoring temporal
feedback to the learning context. The mixed reactions
to social comparison and preference for non-social
indicators emphasize the importance of personaliza-
tion, allowing learners to customize feedback based
on their preferences and goals. Adapting temporal
and comparison features to individual needs should
enhance engagement and learning outcomes. By
incorporating these principles, AI-based systems
should provide actionable, interpretable feedback that
fosters trust and transparency, aligning with the goals
of Explainable AI (XAI) in education to support all
stakeholders (Khosravi et al., 2022).
6 CONCLUSION AND FUTURE
WORK
This study is a contribution towards the understanding
on how AI-based educational systems can be empow-
ered with mechanisms to make their results more ex-
plainable through interpretable and actionable indica-
tors. Our findings reveal a nuanced preference among
learners for visual over textual indicators, highlight
the mixed responses to social comparison, and un-
derscore the importance of considering temporality
and learner profiles in the design of educational AI
systems. Importantly, our research underscores the
need for designing AI-based educational tools that
are not only technically effective but are also able to
make informed use of available data to encourage stu-
dents to change their behaviour for the better. More-
over, this research goes towards making AI-based sys-
tems transparent to students. This is necessary if stu-
dents are to have enough trust to follow the recom-
mendations and advice provided by these systems, as
without trust, ”analytics can have no influence on the
learning activity” (Wise et al., 2016).
Future work should explore the integration of per-
sonalized learning analytics that take into account in-
dividual learner characteristics, such as data literacy
levels and learning goals. The next step is to integrate
actionable and interpretable AI-based feedback into
tools used by students during a real course, in order
to assess the impact of this type of feedback on stu-
dents’ trust, understanding of the system, and on their
pedagogical outcomes. Moreover, there is a need for
studies to assess the long-term impact of different in-
dicator types on learning outcomes and student en-
gagement. As AI continues to be used in educational
contexts, ensuring that these systems are transparent,
understandable, and aligned with human learning pro-
cesses is essential for maximizing their educational
value and fostering an environment of trust and ef-
fective learning, and ourish the global dialogue on AI
regulation.
ACKNOWLEDGEMENTS
This work was supported by the STIC-AmSud LAFE
project.
CSEDU 2025 - 17th International Conference on Computer Supported Education
434

REFERENCES
Bayrak, F., Nuho
˘
glu Kibar, P., and Kocadere, S. A. (2021).
Powerful Student-Facing Dashboard Design Through
Effective Feedback, Visualization, and Gamification.
In Visualizations and Dashboards for Learning Ana-
lytics. Cham.
Bodily, R., Ikahihifo, T. K., Mackley, B., and Graham, C. R.
(2018). The design, development, and implementation
of student-facing learning analytics dashboards. Jour-
nal of Computing in Higher Education.
Clark, R., Lyons, C., and Hoover, L. (2004). Graphics for
learning: Proven guidelines for planning, designing,
and evaluating visuals in training materials. Perfor-
mance Improvement.
Conati, C., Barral, O., Putnam, V., and Rieger, L. (2021).
Toward personalized XAI: A case study in intelligent
tutoring systems. Artificial Intelligence.
F
´
elix, E., Amadieu, F., Venant, R., and Broisin, J. (2022).
Process and Self-regulation Explainable Feedback
for Novice Programmers Appears Ineffectual. Lecture
Notes in Computer Science, Cham.
Guerra, J., Hosseini, R., Somyurek, S., and Brusilovsky, P.
(2016). An Intelligent Interface for Learning Content:
Combining an Open Learner Model and Social Com-
parison to Support Self-Regulated Learning and En-
gagement. In Proceedings of the 21st International
Conference on Intelligent User Interfaces.
Jivet, I., Scheffel, M., Schmitz, M., Robbers, S., Specht, M.,
and Drachsler, H. (2020). From students with love:
An empirical study on learner goals, self-regulated
learning and sense-making of learning analytics in
higher education. The Internet and Higher Education.
Jørnø, R. L. and Gynther, K. (2018). What Constitutes an
‘Actionable Insight’ in Learning Analytics? Journal
of Learning Analytics.
Khosravi, H., Shum, S. B., Chen, G., Conati, C., Tsai, Y.-S.,
Kay, J., Knight, S., Martinez-Maldonado, R., Sadiq,
S., and Ga
ˇ
sevi
´
c, D. (2022). Explainable Artificial In-
telligence in education. Computers and Education:
Artificial Intelligence.
Kuhlmann, S. and Fiorella, L. (2022). Effects of instructor-
provided visuals on learner-generated explanations.
Educational Psychology.
Kuosa, K., Distante, D., Tervakari, A., Cerulo, L.,
Fern
´
andez, A., Koro, J., and Kailanto, M. (2016). In-
teractive Visualization Tools to Improve Learning and
Teaching in Online Learning Environments:. Interna-
tional Journal of Distance Education Technologies.
K
¨
uhl, T., Scheiter, K., Gerjets, P., and Gemballa, S. (2011).
Can differences in learning strategies explain the ben-
efits of learning from static and dynamic visualiza-
tions? Computers & Education.
Molenaar, I. and Wise, A. (2022). Temporal Aspects of
Learning Analytics - Grounding Analyses in Concepts
of Time. In The Handbook of Learning Analytics.
Nowell, L., Norris, J., White, D., and Moules, N. (2017).
Thematic Analysis: Striving to Meet the Trustworthi-
ness Criteria. International Journal of Qualitative.
Ouyang, F. and Jiao, P. (2021). Artificial intelligence in
education: The three paradigms. Computers and Ed-
ucation: Artificial Intelligence.
Park, Y. and Jo, I.-H. (2015). Development of the Learning
Analytics Dashboard to Support Students’ Learning
Performance. Journal of Universal Computer Science.
Sahin, M. and Ifenthaler, D. (2021). Visualizations and
Dashboards for Learning Analytics: A Systematic Lit-
erature Review. In Visualizations and Dashboards for
Learning Analytics, Advances in Analytics for Learn-
ing and Teaching.
Schumacher, C. and Ifenthaler, D. (2018). Features students
really expect from learning analytics. Computers in
Human Behavior.
Sharples, M. (2023). Towards social generative AI for ed-
ucation: theory, practices and ethics. Learning: Re-
search and Practice.
Smith, P. (2019). Engaging online students through peer-
comparison progress dashboards. Journal of Applied
Research in Higher Education.
Spencer, D. and Garrett, J. J. (2009). Card sorting: design-
ing usable categories. Brooklyn, N.Y.
van Leeuwen, A., Teasley, S., and Wise, A. (2022). Teacher
and Student Facing Learning Analytics.
Vieira, C., Parsons, P., and Byrd, V. (2018). Visual learning
analytics of educational data: A systematic literature
review and research agenda. Computers & Education.
Villalobos, E., Hilliger, I., P
´
erez-Sanagust
´
ın, M., Gonz
´
alez,
C., Celis, S., and Broisin, J. (2023). Analyzing Learn-
ers’ Perception of Indicators in Student-Facing An-
alytics: A Card Sorting Approach. In Responsive
and Sustainable Educational Futures, Lecture Notes
in Computer Science, Cham.
Vytasek, J. M., Patzak, A., and Winne, P. H. (2020). Ana-
lytics for Student Engagement. In Machine Learning
Paradigms: Advances in Learning Analytics, Intelli-
gent Systems Reference Library. Cham.
Winne, P. H. (2021). Open Learner Models Working
in Symbiosis With Self-Regulating Learners: A Re-
search Agenda. International Journal of Artificial In-
telligence in Education.
Wise, A. F., Vytasek, J. M., Hausknecht, S., and Zhao,
Y. (2016). Developing Learning Analytics Design
Knowledge in the “Middle Space”: The Student Tun-
ing Model and Align Design Framework for Learning
Analytics Use. Online Learning.
´
Alvarez, R. P., Jivet, I., P
´
erez-Sanagust
´
ın, M., Scheffel, M.,
and Verbert, K. (2022). Tools Designed to Support
Self-Regulated Learning in Online Learning Environ-
ments: A Systematic Review. IEEE Transactions on
Learning Technologies.
Designing Actionable and Interpretable Analytics Indicators for Improving Feedback in AI-Based Systems
435
