
Smart Rideshare Matching: Feasibility of Utilizing Personalized
Preferences
Shaguna Gupta
1,2 a
, Shi Feng
3
and B. Brian Park
4 b
1
Link Lab, University of Virginia, Charlottesville, Virginia, U.S.A.
2
School of Computer Science and Statistics, Trinity College Dublin, College Green, Dublin, Ireland
3
Link Lab, Department of Civil and Environmental Engineering, University of Virginia, Charlottesville, Virginia, U.S.A.
4
Link Lab, Departments of Civil & Environmental Engineering and Systems & Information Engineering,
University of Virginia, Charlottesville, Virginia, U.S.A.
Keywords:
Rideshare Matching, Big Data Analytics, Vehicular Telematics Data.
Abstract:
We investigated the feasibility of utilizing vehicular telematics data for ride-sharing matching. The main focus
was to use personalized preferences including home and workplace departure and arrival times. A case study
was conducted using the vehicular telematics commuting data between their home to the University of Virginia
(UVA) campus. Using data from April 2022, which captures vehicle trips, arrival times, and departure times
at UVA, this research analyzed vehicle trips over two weeks to identify individuals with similar commuting
schedule preferences. By clustering vehicles based on proximity and timing, we proposed a framework for
matching individuals who share similar arrival and departure schedule preferences and live in nearby locations,
thereby facilitating coordinated ride-sharing opportunities. The findings are presented through visualizations
illustrating ride-matching potential, particularly during peak commuting hours. The matching would offer
a convenient ride-sharing solution for UVA commuters while maintaining their commuting flexibility. This
approach could also offer a sustainable transportation solution that enhances travel efficiency, lowers environ-
mental impact, and supports the broader adoption of ride-sharing within academic and urban settings. The
proposed framework provides a scalable model for systematic ride-sharing implementation and could guide
future research and policy development for sustainable campus mobility solutions.
1 INTRODUCTION
Current transport-share systems or carpooling typi-
cally rely on users to actively request or offer a ride
and to coordinate the time and pickup location. Ser-
vices such as Lyft and Uber have addressed this prob-
lem by using location to provide ride services that are
convenient and on-demand. The on-demand and con-
venience aspects of transportation might also be the
main reason behind using personal cars as they allow
to combine commutes with other activities (e.g., pick-
ing up kids to and from school, running errands, go-
ing to off-campus meetings, etc.). This convenience,
however, comes at a great personal and societal cost,
including traffic congestion and parking demand. De-
spite various agencies’ incentives and discounts for
ride-sharing, this kind of service has not been widely
a
https://orcid.org/0000-0002-9361-3097
b
https://orcid.org/0000-0003-4597-6368
used in daily commuting for obvious reasons men-
tioned above as well as hassled coordination, schedul-
ing requirements, commitment, and having to actively
request or offer rides.
In this research, we conducted a case study us-
ing a university community to increase engagement
in ride-sharing by analyzing vehicular telematics data
made available by Wejo. The analyses mainly focused
on drivers’ commutes to the University of Virginia
(UVA) and the potential of matching based on their
arrival times to the University and departure times
to their work-to-home trips. The UVA is central-
ized around the Charlottesville area and faces chal-
lenges in managing traffic flow due to its limited park-
ing spots. As campus activities fully resumed in
2022, making a return to normalcy after the disrup-
tions caused by the COVID-19 pandemic, the flow of
traffic to and from the campus noticeably increased.
Because of the ever-increasing parking demands on
the campus, there is an opportunity to optimize traffic
482
Gupta, S., Feng, S. and Park, B. B.
Smart Rideshare Matching: Feasibility of Utilizing Personalized Preferences.
DOI: 10.5220/0013291400003941
In Proceedings of the 11th International Conference on Vehicle Technology and Intelligent Transport Systems (VEHITS 2025), pages 482-489
ISBN: 978-989-758-745-0; ISSN: 2184-495X
Copyright © 2025 by Paper published under CC license (CC BY-NC-ND 4.0)

flow using ride-sharing initiatives.
Ride-sharing can be an efficient mode of sustain-
able transport for work colleagues or people who live
in close proximity, especially in areas with limited
public transport, walking, or cycling options. Ride-
sharing or car-pooling can be beneficial for organi-
zations and individuals in terms of reduced travel
costs, improved parking efficiency, decreased traffic
congestion, and positive environmental impacts. Be-
sides, it can be a productive, greener, and more sus-
tainable choice for individuals and the wider com-
munity. This research presents an analysis of vehi-
cle trips to and from UVA over a two-week period in
April 2022, with the goal of identifying potential ride-
sharing opportunities based on personalized commut-
ing arrival/departure time preferences.
The key objectives of this analysis are to mainly
recommend ride-sharing suggestions based on timing
and proximity. By identifying individuals who arrive
at UVA at similar times and leave UVA at similar de-
parture times, the aim is to enable coordinated ride-
sharing opportunities that align with their schedules.
Furthermore, the study suggests ride-sharing options
for individuals commuting from and to nearby loca-
tions relative to each other to enhance convenience.
These criteria are used to group vehicles based on
their arrival and departure locations, both at UVA and
at their home locations before and after the UVA trips.
This research details the methodology used to
identify these ride-sharing opportunities, evaluates
the results obtained from the analysis, and presents
visualizations to support the findings. The insights
gained from this study could be instrumental in de-
veloping a systematic ride-sharing program that en-
hances the commuting experience for UVA students,
faculty, and staff. We expect that the approach used
in this research is applicable to many similarly sit-
uated communities and institutions, where optimiz-
ing transportation systems can significantly lower en-
vironmental impact, and improve overall travel effi-
ciency. This framework tailored to different settings
can serve as a versatile solution for fostering sus-
tainable and convenient commuting practices in ur-
ban and academic environments alike. The remain-
der of this paper is organized as follows. Section 2
summarized the status of existing literature related to
car sharing, followed by section 3 with data and ap-
proaches used to analyze the vehicular data. Section
4 presents feasibility evaluation and results, followed
by section 5 discussion, section 6 conclusions and
section 7 future work.
2 LITERATURE REVIEW
Interest in ride-sharing to address traffic, parking, and
energy issues in cities, companies, and college cam-
puses has driven extensive research on optimizing
models and understanding influencing factors. Our
study reviews current research on carpooling models,
preferences, and system improvements.
Studies have proposed models and algorithms
aimed to enhance car-sharing systems to benefit both
users and car-sharing companies. Focusing on the
user perspective, Narman et al. presented a model
that employs a two-layer matching system (Narman
et al., 2021), and Hussain et al. proposed a system
specifically designed to optimize car sharing frame-
work for employees in large organizations (Hussain
et al., 2022), while Masoud and Jayakrishnan in-
troduced a real-time algorithm to address the ride-
matching problem within a flexible ride-sharing sys-
tem (Masoud and Jayakrishnan, 2017). In the two-
layer model that Narman et al. developed, the first
layer matches riders based on personal characteris-
tics, such as safety, punctuality, and comfort. The sec-
ond layer limits wait times with personalized thresh-
olds. A machine learning-based recommendation sys-
tem achieved 90 percent accuracy in predicting rider
preferences, providing successful matches and trip
completions. Considering car sharing in large compa-
nies, Hussain et al. developed a framework that con-
siders factors like home location, target destination,
time windows, and personal behavior to optimize car-
pooling groups. The system updates schedules in real
time, offering flexible carpooling solutions. The pro-
posed framework efficiently manages recurrent travel
demand, especially for company employees. The
flexible system that Masoud et al. proposed allows
for dynamic, real-time matching and multi-hop rides,
considering users’ preferences and minimizing wait-
ing times. Their algorithm can also solve large-scale
ride-matching problems quickly, providing comfort to
riders through optimal routing and reducing the num-
ber of transfers. These studies developed innovative
models using algorithmic approaches to enhance user
experiences in car-sharing systems, fostering greater
participation and efficiency in car-sharing systems.
Some researchers have also concentrated on opti-
mizing road networks, particularly in relation to road
congestion and capacity. De Palma et al. focused
on the impact of dynamic congestion on carpool-
ing matching in their paper (de Palma et al., 2022).
The study considered scheduling preferences and dy-
namic congestion in its ride-sharing framework. Re-
sults showed optimal matching occurs when drivers
and passengers are sequenced by location, but differ-
Smart Rideshare Matching: Feasibility of Utilizing Personalized Preferences
483

ing arrival times complicate matching and may intro-
duce tardiness penalties. Considering users’ choice
of ride-sharing, destination, and path, Xingyuan Li
et al. presented a ride-sharing trip-assignment model
using a bi-level programming approach for optimiz-
ing the reserve capacity of road networks. The pro-
gramming was then formatted into a single-layer op-
timization problem (Li et al., 2024). They concluded
that subsidizing ride-sharing drivers can enhance road
capacity, rivaling the effects of road expansion with-
out ride-sharing. Incorporating dynamic congestion
and user preferences, these studies show that effec-
tive ride-sharing strategies can significantly improve
road networks and reduce congestion.
Other researchers have examined the social as-
pects of carpooling. Limited participation in carpool-
ing can be attributed to specific strategies employed
by ride-hailing companies, as well as concerns ex-
pressed by passengers. Naumov and Keith focused
on the economic and environmental impacts of ride-
hailing (Naumov and Keith, 2023). The study found
most ride-hailing trips, especially pooled rides, are
unprofitable due to subsidies. Adjusting pricing by
widening the gap between individual and pooled ride
costs could increase revenue, reduce vehicle miles
traveled, and benefit both companies and the urban
environment. Linchao Li et al. explored what influ-
ences college students’ views on carpooling by imple-
menting a multinomial logit model based on survey-
based data (Li et al., 2023). They concluded that con-
cerns about safety and cost are key reasons carpooling
is not popular among students. Safety and cost are pri-
mary concerns, a reliable carpooling information plat-
form for students could therefore increase support for
carpooling. These studies provided various insights
into how ride-sharing systems can be modeled, opti-
mized, and influenced by users’ preferences.
Despite the valuable findings provided by the re-
viewed studies, there exists a notable gap in the re-
search: few studies have utilized real-world vehicle
trajectory data that specifically capture drivers’ depar-
ture and arrival time preferences in their daily com-
muting trips. Most existing ride-sharing models rely
on simulations or survey data, which may not fully
reflect the dynamic nature of actual commuting pat-
terns. In addition, the integration of vehicle telematics
data has been under-explored in the context of opti-
mizing ride-sharing on university campuses commut-
ing patterns. To address this gap, our study proposes
an innovative approach that leverages real-world ve-
hicular telematics data to analyze commuting patterns
at the University of Virginia (UVA), and the poten-
tial for matching based on their arrival and depar-
ture times at UVA, which generates private route op-
tions for users. This research allows for more accu-
rate identification of potential ride-sharing opportuni-
ties based on the timing and availability of potential
vehicle trips on campus, which aims to reduce traf-
fic, improve efficiency, and create a more sustainable
transportation system in the city of Charlottesville.
3 MATERIALS AND METHODS
As noted, our research focuses on identifying patterns
where individual commuters arriving at and departing
from a university campus at similar times or from sim-
ilar locations could benefit from shared transporta-
tion. Leveraging trip data, including Trip IDs, Vehi-
cle IDs, ignition status, and geographical coordinates,
we can cluster vehicles based on their arrival and de-
parture times and locations. This allows us to pro-
pose ride-sharing opportunities that could reduce traf-
fic congestion, lower transportation costs, and con-
tribute to a more sustainable campus environment.
3.1 Vehicular Telematics Data
This research used vehicular telematics data made
available to the research team by the Virginia De-
partment of Transportation (VDOT). It is noted that
VDOT purchased the data from Wejo company. Out
of 26 weeks of data, this research utilized vehicle
trips for ten working days in April 2022, focusing
on Trip IDs, Vehicle IDs, ignition status, and geo-
graphical coordinates (latitude and longitude) to iden-
tify potential ride-sharing clusters. These ten consec-
utive weekdays were selected as other months were
affected by COVID-19 (some still teleworking during
Fall 2021) and many University academic activities
(e.g., Spring recess in March, graduation in May).
3.2 UVA Boundary
To accurately determine which trips were associated
with UVA, a boundary polygon was created to repre-
sent the UVA campus, including its parking lots (Uni-
versity of Virginia, 2023). This polygon was used to
filter trips that either started or ended within the UVA
boundary. Only trips that had their ignition turned
off (KEY OFF) within this boundary were consid-
ered as arriving at UVA, while trips that had their
ignition turned on (KEY ON) within the boundary
were considered as departures. Figure 1 shows the
UVA campus boundary on OpenStreetMap (Open-
StreetMap contributors, 2017) used to filter relevant
trips and this is being utilized to understand the ar-
rivals and departures in the subsequent sections.
VEHITS 2025 - 11th International Conference on Vehicle Technology and Intelligent Transport Systems
484
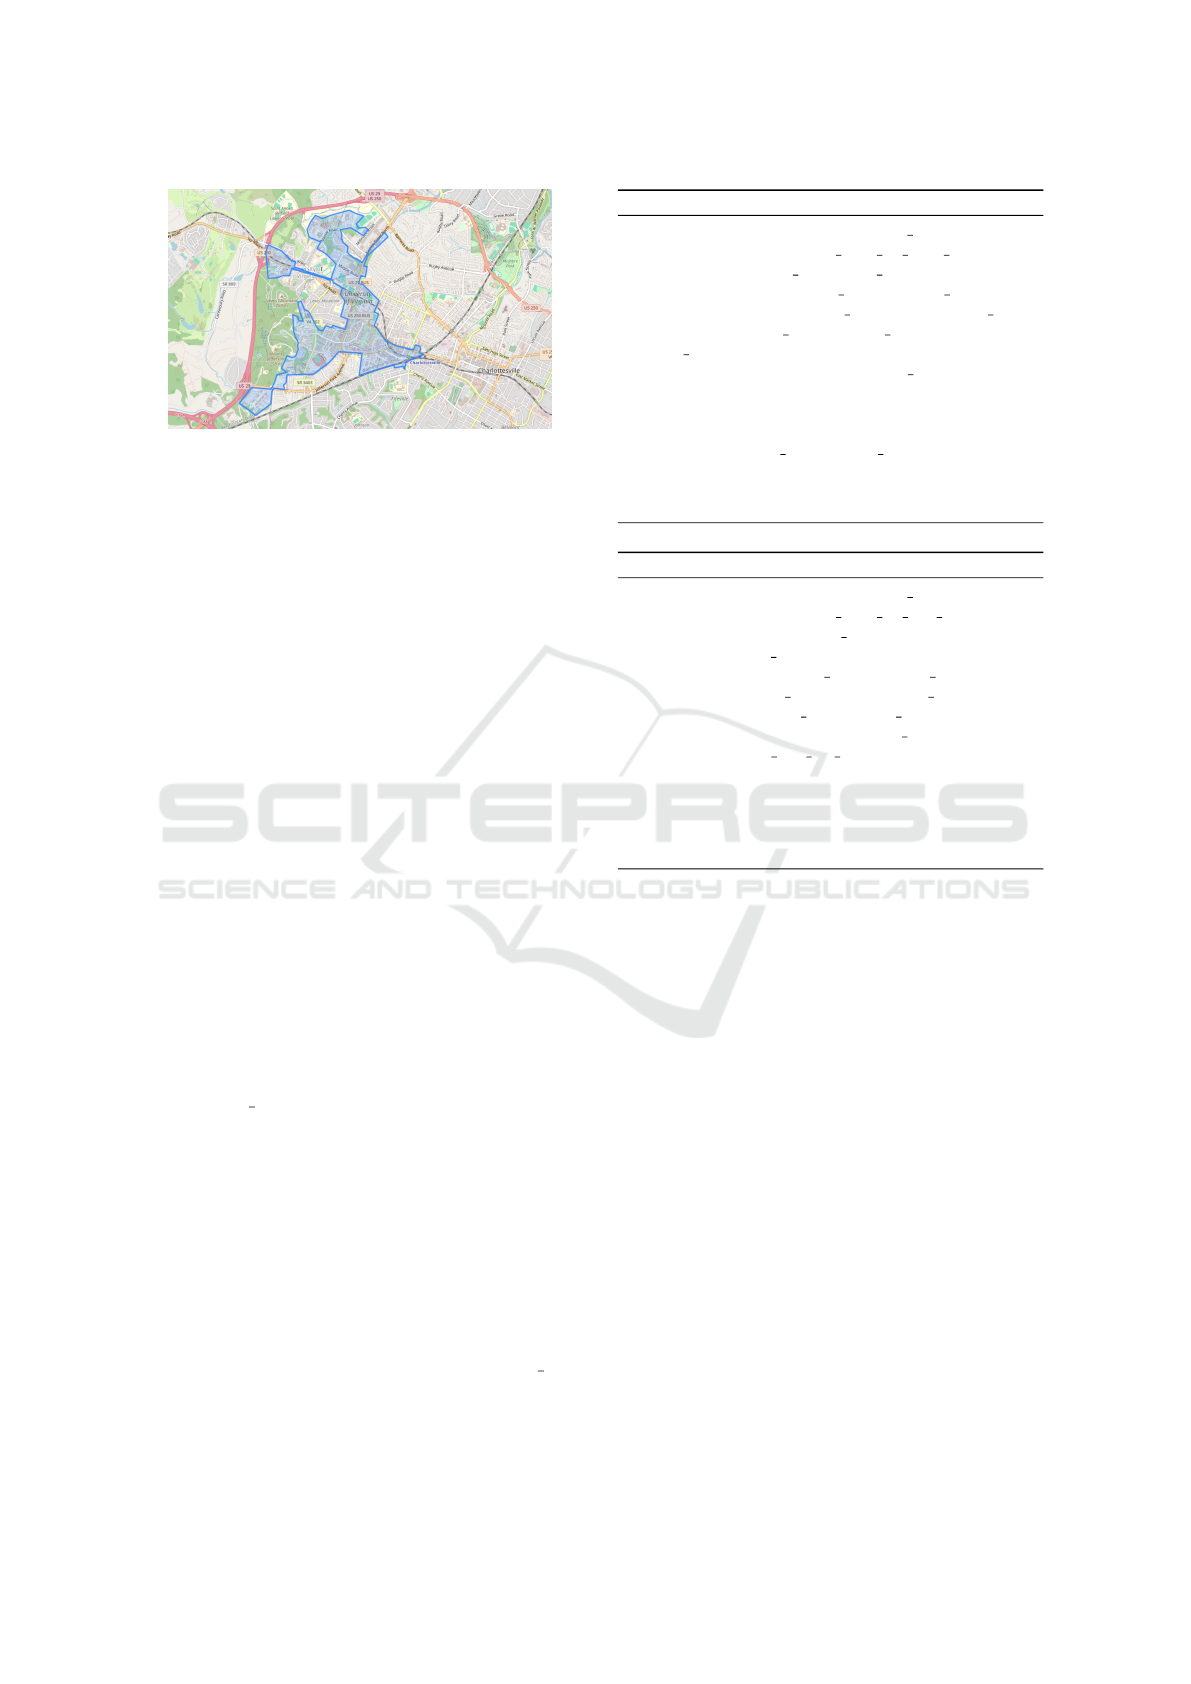
Figure 1: UVA Polygon Boundary.
3.3 Vehicle Operational Schedule
Understanding
The initial phase in the methodology involved loading
and transforming the data. Timestamps recorded in
Coordinated Universal Time (UTC) were converted
to Eastern Time (EDT) to align with the local time
zone at UVA. The data was then filtered to include
only relevant trips, specifically those between 5 AM
and 8 PM on weekdays, and within a predefined set of
valid postal codes within the 25-mile radius of UVA.
3.3.1 Arrival and Departure Schedule
Based on the UVA polygon boundary, the filtered data
was further processed to identify arrivals and depar-
tures at UVA. The study specifically analyzed trips
that ended or started within the UVA polygon area,
considering these as the first trip of the day to UVA
and the last trip of the day from UVA. Based on this,
we finalized the trips that arrived or departed.
• Arrivals Extraction Algorithm
This algorithm is designed to find the first trip
each vehicle makes to UVA on any given day.
A trip is classified as an arrival at UVA when
the vehicle’s ignition is turned off, represented by
the KEY OFF ignition status. The algorithm pro-
cesses data related to vehicle trips and extracts the
earliest instance of a vehicle arriving at UVA on
each day within the dataset. This approach filters
the dataset to include only trips where the vehi-
cle’s ignition was turned off (i.e., arrival events)
and then sorts the data by vehicle and timestamp.
• Departures Extraction Algorithm
This algorithm identifies the last trip for each ve-
hicle that departs from UVA on a given day. The
trip is considered a departure if the vehicle’s ig-
nition is turned on, represented by the KEY ON
ignition status. The algorithm identifies the last
trip departing from UVA for each vehicle on that
day. This is designed to primarily extract the first
Algorithm 1: First Trip Arrival Extraction Algorithm.
1: Input: DataFrame d f , Polygon uva polygon
2: Output: DataFrame f irst rows o f f irst tr ip
3: Convert Timestamp est to Trip Date (date only).
4: Filter rows where Ignition Status is KEY OFF.
5: Sort DataFrame by Vehicle ID and Timestamp est.
6: Group by Vehicle ID and Trip Date to get the first
Trip ID of the day.
7: Join the dataset with the first Trip ID to get the full
details of the first trip.
8: Convert d f to Pandas format for spatial filtering.
9: Convert back to Polars DataFrame.
10: Group by Vehicle ID and Trip Date to keep only the
first rows of the first trip.
11: Drop unnecessary columns.
12: Return the cleaned DataFrame.
Algorithm 2: Last Trip Departure Extraction Algorithm.
1: Input: DataFrame d f , Polygon uva polygon
2: Output: DataFrame f irst rows o f last tr ip
3: Create a new column Trip Date by extracting the date
from Timestamp est.
4: Filter d f where Ignition Status is KEY ON.
5: Sort d f by Vehicle ID and Timestamp est.
6: Group d f by Vehicle ID and Trip Date.
7: For each group, select the last Trip ID.
8: Join d f with last trip ids d f to get the last trip’s rows.
9: Convert df to Pandas for spatial filtering.
10: Convert the filtered DataFrame back to Polars.
11: Extract the last trip’s first row for each vehicle and day.
12: Drop unnecessary columns.
13: Return the resulting DataFrame.
row of the last recorded trip for vehicle departures
from a defined location based on its timestamp.
Both algorithms identify the first trip and last trip
of each vehicle arriving at and departing from
UVA on a given day. The key steps involve fil-
tering for relevant trips (ignition off/on), sorting,
grouping by vehicle and date, extracting the first
trip, and cleaning the dataset to remove unneces-
sary information. The algorithms also utilize Pan-
das and Polars for data manipulation and transfor-
mation.
3.3.2 Start and end Trip Schedule
• Start and End Point Extraction Algorithm
This code processes vehicle trip data by identify-
ing start and end points based on key events (key-
on and key-off) before and after vehicle arrivals
and departures at UVA. The process focuses on
merging, filtering, and ranking key-on and key-
off events to capture home locations by calculat-
ing distances between start and end trip locations.
Smart Rideshare Matching: Feasibility of Utilizing Personalized Preferences
485
Algorithm 3: Start-End Trip Points Extraction Algorithm.
1: Input: Arrival, Departure, Key-on, Key-off data, UVA
parking boundary.
2: Output: Excel with start/end trip points, arrival and
departure times, and distances.
3: Load data from Parquet files into Pandas DataFrames.
4: Convert Timestamp est to timezone-naive datetime.
5: Select Vehicle ID, Timestamp est, Date, Latitude,
Longitude and remove duplicate records.
6: Merge arrival d f with key-on events on Vehicle ID
and Date.
7: Keep the first three key-on events before each arrival.
8: Merge departure d f with key-off events on Vehicle ID
and Date.
9: Keep the first three key-off events after each departure.
10: Remove trip points within the UVA parking boundary.
11: Use Haversine formula to compute distances between
start to end trip points and arrival to departure points.
12: Merge cleaned arrivals and departures into a f inal d f
with vehicle IDs, dates, trip times, and distances.
13: Export final DataFrame as Excel.
3.4 Clustering Approach
The filtered data was further processed to identify po-
tential ride-sharing opportunities. The analysis in-
volved visualizing and clustering vehicles based on
spatial and temporal proximity at various stages of
their trips (Jain and Dubes, 1988). Three distinct clus-
ters were defined to gain insights into the ride-sharing
potential. The clustering logic grouped vehicles by:
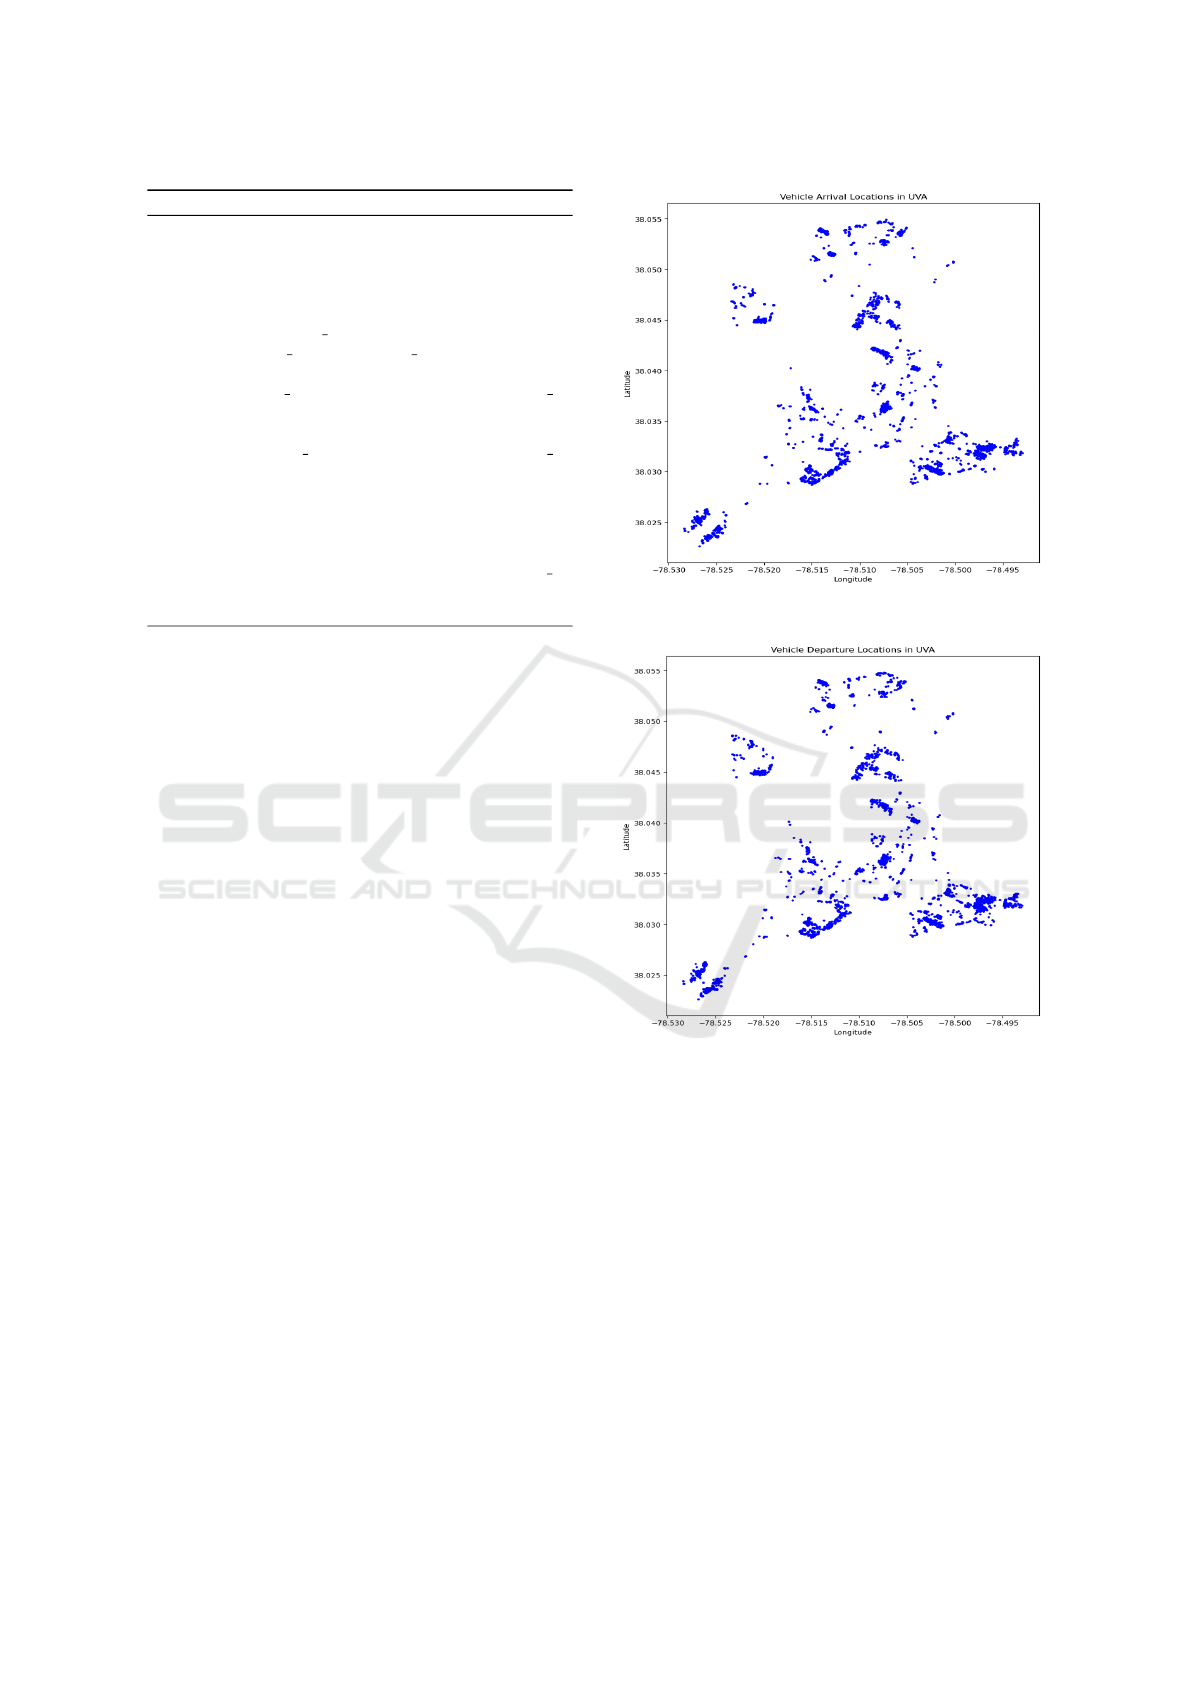
• Arrival Points: Vehicles arriving at UVA over the
duration of 10 days composes our arrival points.
This will lead to the potential for detecting ve-
hicles that arrive around the same time. The ar-
rivals spread across UVA boundary over 10 days
can be visualized to show the density of the vehi-
cles around UVA parking lots (Figure 2).
• Departure Points: The location of vehicles leaving
UVA over 10 days captures the departure points.
Again, departure points will help identify the ve-
hicles departing around the same time, offering a
chance to cluster and optimize ride-sharing for re-
turn trips. The departures spread across the UVA
boundary can be visualized as shown in Figure 3.
• Home-to-UVA Points: These points compose our
Home-to-UVA start locations highlighting where
vehicles begin their trips, which is crucial for
identifying potential ride-sharing clusters based
on spatial proximity referring to the vehicles de-
parting for UVA.
• UVA-to-Home Points: Vehicles departing from
UVA to return to home locations will compose
the UVA-to-Home end locations. This will enable
identifying vehicles returning to similar home lo-
Figure 2: Arrivals spread at UVA boundary.
Figure 3: Departures spread at UVA boundary.
cations at similar times, which will be key for op-
timizing ride-sharing on the return trip, reducing
the number of independent return trips.
3.4.1 Defining Clusters
1. Arrival Time Clustering: Vehicles arriving at
UVA within a similar time window (e.g., 15-30
minute intervals) could be grouped together. This
temporal clustering will help identify vehicles that
could potentially share rides to reduce the number
of trips to UVA.
2. Departure Time Clustering: Similarly, vehicles
departing from UVA within the same time win-
dows can be grouped to suggest ride-sharing for
VEHITS 2025 - 11th International Conference on Vehicle Technology and Intelligent Transport Systems
486
the return journey. This clustering will help iden-
tify those vehicles that leave UVA at similar times,
enabling ride-sharing for the trip home.
3. Home Location Clustering: This clustering in-
volved identification of start and final location
of the vehicles. Vehicles that started their trips
from nearby locations (e.g., within 2 miles of each
other) could be identified as potential ride-sharing
candidates. This was done for both the trip to
UVA and the return trip home. Therefore, vehi-
cles that begin their trips from nearby locations
heading toward UVA or leaving UVA for nearby
locations could be grouped together, suggesting
ride-sharing routes for both legs of the journey.
This analysis allowed us to group vehicles that
start and end their trips from and to nearby locations
respectively within a predefined radius (e.g., 2 miles)
or using a clustering algorithm such as K-means and
arrive at UVA and depart from UVA within the same
time window (Li and Chung, 2020).
4 EVALUATION AND RESULTS
The evaluation of the clustering process was con-
ducted by analyzing the number of vehicles that were
successfully grouped based on the defined criteria.
The results indicate several significant clusters of ve-
hicles that could benefit from ride-sharing, especially
during peak arrival and departure times. The analysis
identified several clusters of vehicles that could po-
tentially benefit from ride-sharing.
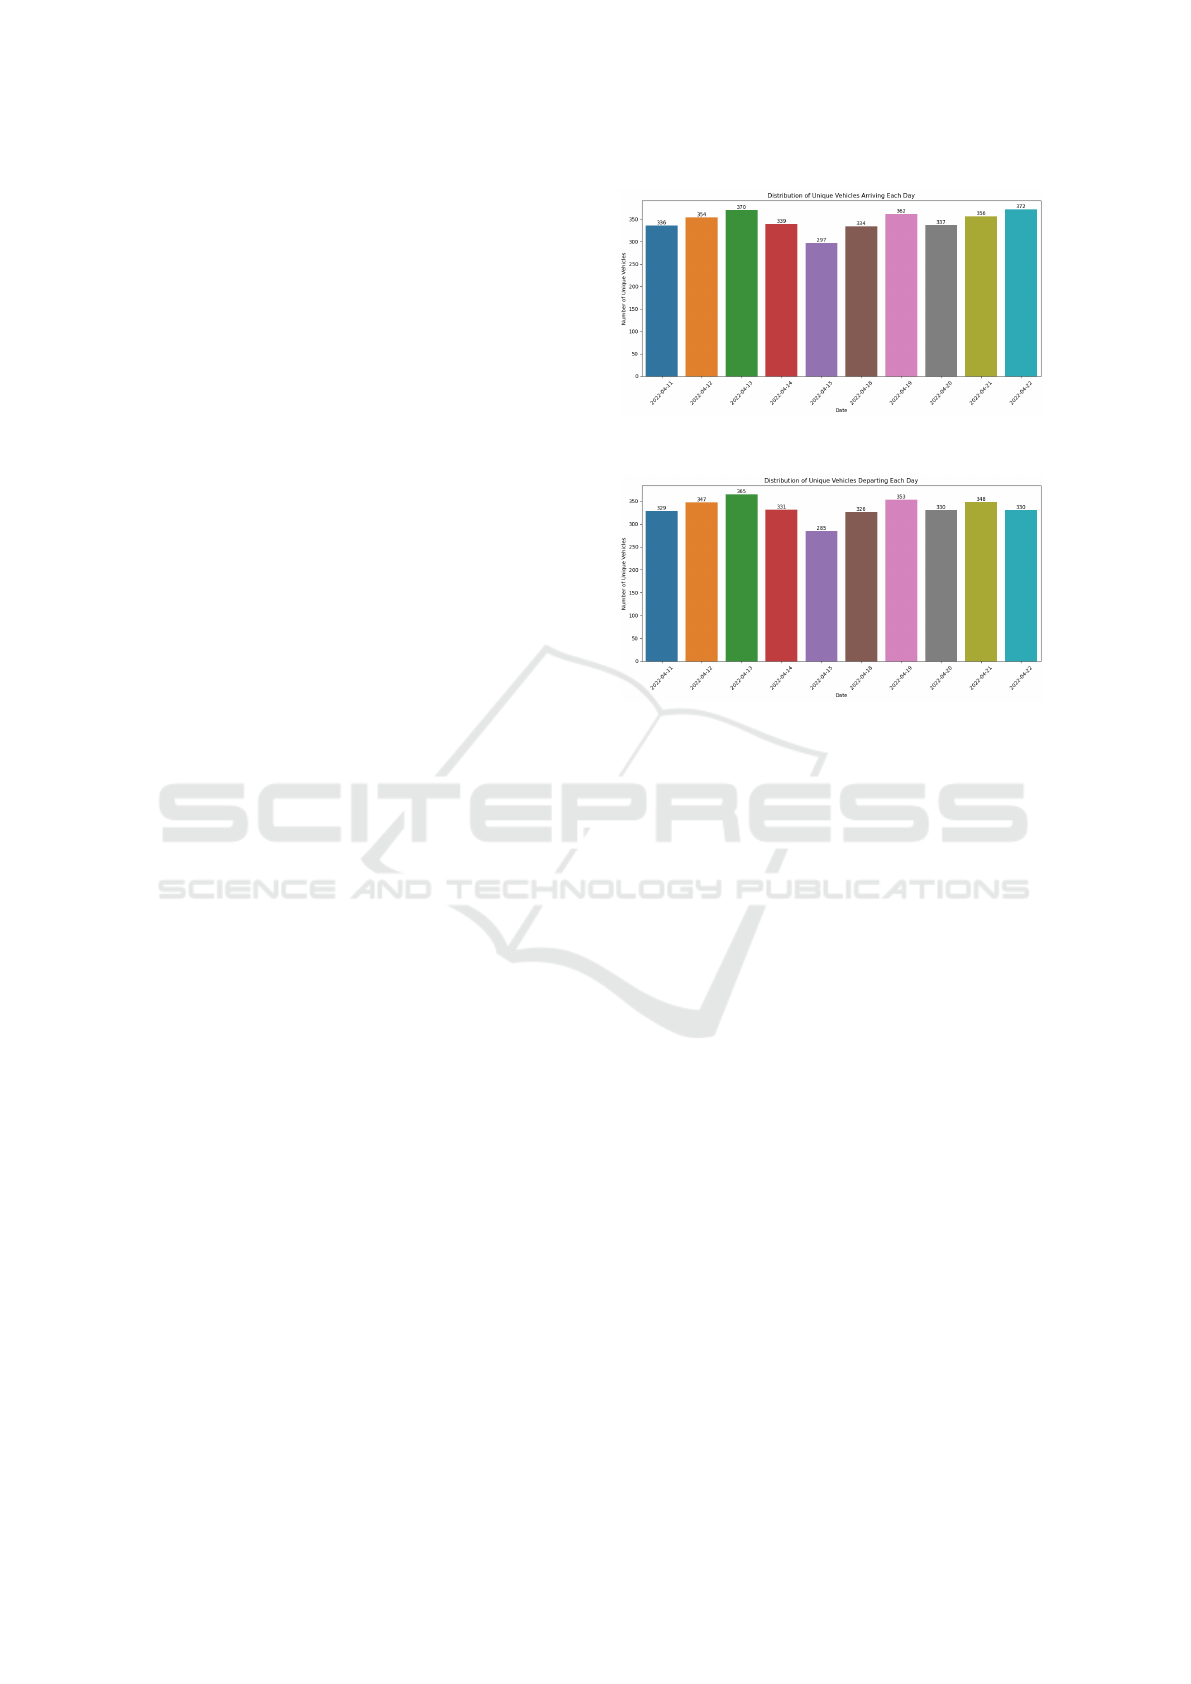
4.1 Evaluation Metric 1: Number of
Vehicles in Each Day Within 10
Days Bracket
The provided graphs show the daily number of unique
vehicle arrivals and departures at UVA over a 10-day
period in April 2022. In Figure 4, vehicle arrivals
ranged from a low of 297 on April 15 to a high of 372
on April 22, with some fluctuation observed through-
out the period. In Figure 5, vehicle departures ranged
from a minimum of 285 on April 15 to a maximum of
365 on April 13, indicating a similar level of day-to-
day variability. Overall, both arrivals and departures
exhibit peaks and troughs, but both the distribution
of the unique vehicle arrivals and departures follow a
similar pattern in the researched period.
Figure 4: UVA Unique Arrivals Each Day.
Figure 5: UVA Unique Departures Each Day.
4.2 Evaluation Metric 2: Number of
Vehicles in Each Hour for 10 Days
The following figures illustrate the hourly distribution
of vehicle arrivals and departures at UVA over the re-
searched 10-day period.
In Figure 6, arrivals have a peak during the morn-
ing hours, particularly between 7 AM and 9 AM,
with the highest number of unique vehicles observed
around 9 AM. After this peak, the number of ar-
rivals gradually decreases throughout the day until
the evening. Figure 7 shows departures, which ex-
hibit a different pattern with peaks occurring in the
late afternoon, particularly between 3 PM and 5 PM,
with a peak at around 4 PM. Departures steadily in-
crease from late morning until reaching their maxi-
mum, after which they decline towards the evening
hours. The data indicates that arrivals are concen-
trated in the morning while departures peak in the late
afternoon, suggesting typical commuting behavior.
4.3 Evaluation Metric 3: Number of
Vehicles in Every 30-Minute
Window for 10 Days
The following figures contain the number of unique
vehicle IDs arriving and departing at UVA in 30-
minute intervals across the researched 10-day period.
Smart Rideshare Matching: Feasibility of Utilizing Personalized Preferences
487
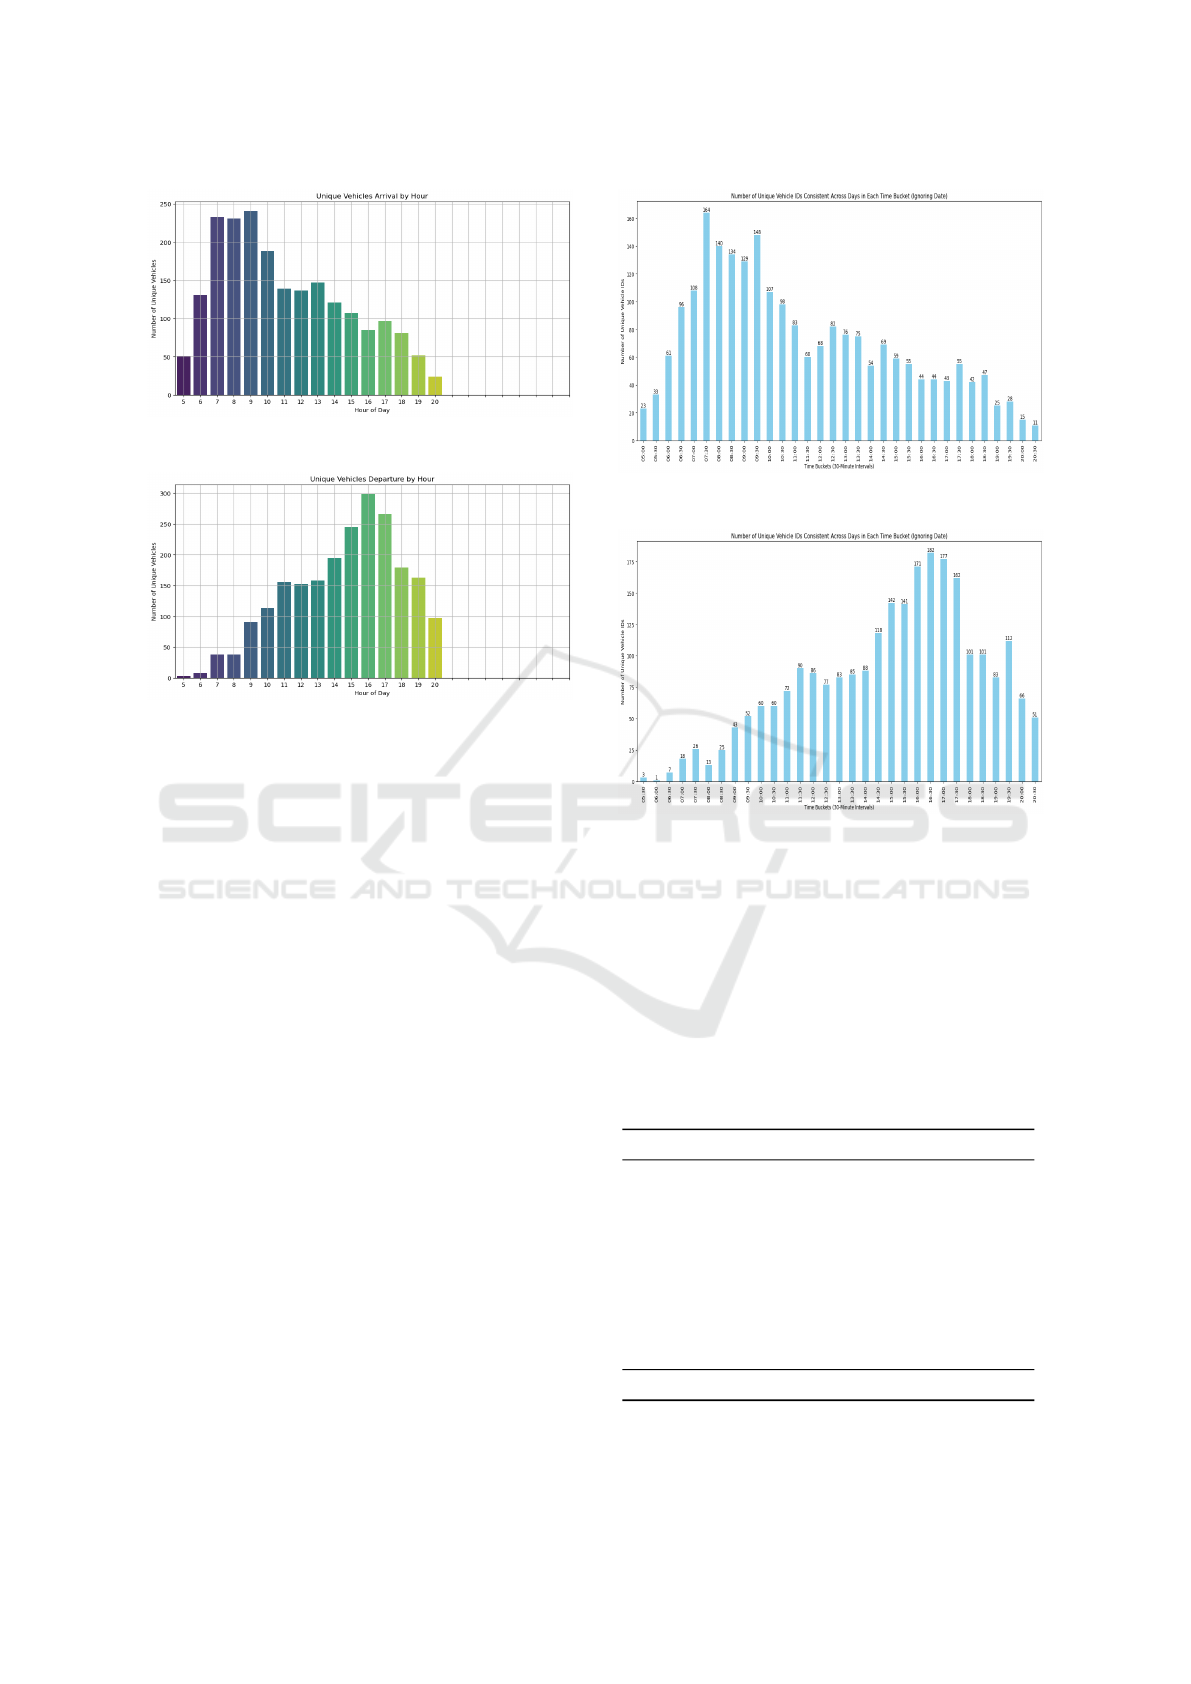
Figure 6: UVA Unique Arrivals per hour for 10 Days.
Figure 7: UVA Unique Departures per hour for 10 Days.
In Figure 8, the arrivals show a clear peak dur-
ing the morning hours, especially between 7:30 AM
and 9:30 AM, with the highest number reaching 164
around 7:30 AM. After this peak, the number of ar-
rivals steadily declines throughout the day, indicat-
ing that most arrivals happen in the early part of the
day. In Figure 9, the departure reveals a different
trend. Departures increase gradually throughout the
day, peaking between 4:00 PM and 5:30 PM, with the
highest number reaching 182 unique vehicle IDs at
4:30 PM. After this peak, the number of departures
decreases toward the evening hours. This pattern sug-
gests a typical commuting behavior where vehicles ar-
rive in the morning and depart in the late afternoon.
Arrival and Departure Clusters: Significant clus-
tering was observed for vehicles arriving and depart-
ing within 30-minute windows, indicating potential
for coordinated ride-sharing as shown in the figures.
4.4 Evaluation Metric 4: Vehicles
Distribution in Total 10 Days
Table 1 shows the distribution of vehicle counts for
the different number of days starting from 10 days to
9 days and so on, with each number of day’s absolute
count and corresponding percentage of the total. Row
with number of vehicles coming only 1 day out of a
total 10 days has the highest count at 375, making up
38.38% of the total. This may be due to the reason
Figure 8: UVA Unique Arrivals for 10 Days.
Figure 9: UVA Unique Departures for 10 Days.
of having travelers to the hospital or daily visitors to
the University for other purposes. As the total number
of days increases, their respective counts and percent-
ages generally decrease, with total days 10 showing
the lowest count at 76, which accounts for 7.78% of
the total percentage of vehicles. The Grand Total is
confirmed to be comprising 977 total unique vehicle
entries to UVA in 10 days. Similar pattern is seen for
vehicles exiting UVA in these days.
Table 1: Arrival Count Distribution by Vehicle ID and Days.
Total Days Count Percentage
10 76 7.78%
9 46 4.71%
8 35 3.58%
7 36 3.68%
6 46 4.71%
5 46 4.71%
4 72 7.37%
3 92 9.42%
2 153 15.66%
1 375 38.38%
Grand Total 977 100.00%
VEHITS 2025 - 11th International Conference on Vehicle Technology and Intelligent Transport Systems
488

5 DISCUSSION
While each day has around 300 vehicles arriving to
and departing from the UVA campus, it is noted that
UVA currently employs about 16,000 faculty and staff
and 7,000 UVA health employees. Given the Wejo
data is only available from newer vehicles made af-
ter 2015 and selected automakers, the study only
matched a small number of vehicles. As this study
focuses on the feasibility of ride-sharing using ve-
hicular telematics data, it is feasible to show ride-
sharing can be matched from these 300 vehicles. It is
possible that 300 vehicles matched daily could have
been over 20,000 vehicles, assuming around 90% of
around 23,000 employees commute by their personal
vehicle. Actual matching would be accomplished via
new sources of data, including ride-sharing App that
UVA plans to adopt in the near future.
6 CONCLUSIONS
This research highlighted the potential to match com-
muters for ride-sharing by leveraging vehicular telem-
atics data. Using the case study of the UVA campus,
we showcased the ride-sharing matching could reduce
traffic and improve transportation efficiency for in-
dividuals commuting to and from UVA. Leveraging
both individual preferences in commuting times and
their proximity criteria (i.e., home location and park-
ing lot), this study identified opportunities for ride-
sharing that could be implemented through a coor-
dinated system, thereby enhancing the overall com-
muting experience while contributing to sustainability
goals. The results suggested that a significant num-
ber of trips to and from UVA could be consolidated
through ride-sharing, leading to a more efficient and
sustainable transportation system on campus.
7 FUTURE WORK
Following the analysis of home location clusters, we
will focus on presenting the results of home loca-
tion clusters to explore their implications for optimiz-
ing ride-sharing routes to and from UVA. After fil-
tering and clustering trips that start or end at UVA
and preparing groups of vehicles, route overlap anal-
ysis could provide a deeper probability of providing
ride-sharing opportunities. Evaluating the overlap of
routes for vehicles within the same cluster to suggest
potential ride-sharing pairs or groups.
In addition, future work should also focus on
evaluating a larger, recent dataset to enhance ride-
sharing analysis. Incorporating an expanded dataset,
researchers could capture more travel patterns to find
temporal changes in commuting behavior and identify
emerging trends in ride-sharing demand. This would
allow a more comprehensive understanding of current
UVA commuting behaviors and facilitate the design
of more effective ride-sharing initiatives and policies.
ACKNOWLEDGMENTS
This research was funded by the SMARTER Univer-
sity Transportation Center and the Virginia Depart-
ment of Transportation provided data access to the
Wejo data. It is also supported by Science Foundation
Ireland through grant 18/CRT/6222 (ADVANCE).
REFERENCES
de Palma, A., Stokkink, P., and Geroliminis, N. (2022). In-
fluence of dynamic congestion with scheduling pref-
erences on carpooling matching with heterogeneous
users. Trans. Res. Part B: Methodol., 155:479–498.
Hussain, I., Knapen, L., Bellemans, T., Janssens, D., and
Wets, G. (2022). A matching framework for employ-
ees to support carpooling in the context of large com-
panies. IEEE Trans. Intell. Transp. Syst., 23(2):1159–
1170.
Jain, A. K. and Dubes, R. C. (1988). Algorithms for clus-
tering data. Prentice-Hall, Inc., USA.
Li, L., Zhang, H., and Gan, Z. (2023). Factors affecting
college students’ attitudes toward carpooling. Trans-
portation Safety and Environment.
Li, X., Cheng, Y., Peng, H., and Dai, X. (2024). Can
ridesharing improve the reserve capacity of trans-
portation network? IEEE Access, 12:73196–73209.
Li, Y. and Chung, S. H. (2020). Ride-sharing under travel
time uncertainty: Robust optimization and clustering
approaches. Computers & Industrial Engineering,
149:106601.
Masoud, N. and Jayakrishnan, R. (2017). A real-time algo-
rithm to solve the peer-to-peer ride-matching problem
in a flexible ridesharing system. Trans. Res. Part B:
Methodol., 106:218–236.
Narman, H. S., Malik, H., and Yatnalkar, G. (2021). An
enhanced ride sharing model based on human charac-
teristics, machine learning recommender system, and
user threshold time. J. Ambient Intell. Humaniz. Com-
put., 12(1):13–26.
Naumov, S. and Keith, D. (2023). Optimizing the economic
and environmental benefits of ride-hailing and pool-
ing. Prod. Oper. Manag., 32(3):904–929.
OpenStreetMap contributors (2017). Planet dump re-
trieved from https://planet.osm.org . https://www.
openstreetmap.org.
University of Virginia (2023). Updated parkingmastermap.
[Online; accessed October 15, 2024].
Smart Rideshare Matching: Feasibility of Utilizing Personalized Preferences
489
