
Association of Fractal Geometry and Data Augmentation Through GANs
and XAI for Classification of Histology Images
Vinicius Augusto Toreli Borgue
1 a
, Bianca Lanc¸oni de Oliveira Garcia
1 b
,
S
´
ergio Augusto Pelicano J
´
unior
1 c
, Guilherme Freire Roberto
2 d
, Guilherme Botazzo Rozendo
3 e
,
Leandro Alves Neves
1 f
, Alessandro Santana Martins
4 g
, Tha
´
ına Aparecida Azevedo Tosta
5 h
and Marcelo Zanchetta do Nascimento
6 i
1
Department of Computer Science and Statistics (DCCE), Sao Paulo State University (UNESP),
S
˜
ao Jos
´
e do Rio Preto, Brazil
2
Institute of Mathematics and Computer Science (ICMC), University of S
˜
ao Paulo (USP), Sao Carlos, Brazil
3
Department of Computer Science and Engineering (DISI), University of Bologna, Cesena, Italy
4
Federal Institute of Tri
ˆ
angulo Mineiro (IFTM), Ituiutaba, Brazil
5
Federal University of S
˜
ao Paulo (UNIFESP), S
˜
ao Jos
´
e dos Campos, Brazil
6
Faculty of Computer Science (FACOM), Federal University of Uberl
ˆ
andia (UFU), Uberl
ˆ
andia, Brazil
Keywords:
Generative Adversarial Networks, Explainable Artificial Intelligence, Handcrafted Fractal Features, Histology
Images.
Abstract:
In computer vision, one of the main challenges regarding the classification of histopathology images lies on
the low number of samples available in public image datasets. For the past year, the most common approaches
applied to handle this problem consisted of using geometric data augmentation to increase the dataset size.
Recently, the use of GANs to generate artificial images to increase the size of the training set for the classifica-
tion of histology images has been proposed. Despite obtaining promising results in the deep learning context,
there has not yet been much research regarding the use of these approaches in the context of handcrafted fea-
tures. In this paper, we propose the use of handcrafted features based on fractal geometry and GANs for data
augmentation for classifying four histology image datasets. The GANs were assisted by explainable artificial
intelligence (XAI) to enhance the quality of the generated images. The fractal features obtained from the
original and artificial images were given as input to six classifiers. After analyzing the results, we verified that,
despite obtaining the best overall performance, our method was only able to provide a slight improvement in
two datasets.
1 INTRODUCTION
With the advancement of high-resolution whole-slide
scanning equipment, pathology laboratories have
adopted the digitization of hematoxylin and eosin
a
https://orcid.org/0009-0005-5855-5126
b
https://orcid.org/0009-0007-3758-7457
c
https://orcid.org/0009-0001-3724-4557
d
https://orcid.org/0000-0001-5883-2983
e
https://orcid.org/0000-0002-4123-8264
f
https://orcid.org/0000-0001-8580-7054
g
https://orcid.org/0000-0003-4635-5037
h
https://orcid.org/0000-0002-9291-8892
i
https://orcid.org/0000-0003-3537-0178
(H&E) stained tissue sections for tissue analysis, aid-
ing in disease identification (Alajaji et al., 2023). The
digitization of high-resolution whole slides enables
the use of artificial intelligence (AI) techniques to im-
prove the accuracy and speed of the diagnostic pro-
cess, which is a time-intensive process that requires
the full focus and attention of the pathologists. As
discussed by (Rozendo et al., 2024), many studies
highlight the challenge of training AI models to an-
alyze histological images due to the limited num-
ber of labeled images available, owing to the high
cost of annotation and patient data privacy concerns.
The lack of labeled data can lead to model overfit-
ting. To balance the number of images in different
756
Borgue, V. A. T., Garcia, B. L. O., Pelicano Júnior, S. A., Roberto, G. F., Rozendo, G. B., Neves, L. A., Martins, A. S., Tosta, T. A. A. and Zanchetta do Nascimento, M.
Association of Fractal Geometry and Data Augmentation Through GANs and XAI for Classification of Histology Images.
DOI: 10.5220/0013280200003929
In Proceedings of the 27th International Conference on Enterprise Information Systems (ICEIS 2025) - Volume 1, pages 756-762
ISBN: 978-989-758-749-8; ISSN: 2184-4992
Copyright © 2025 by Paper published under CC license (CC BY-NC-ND 4.0)

classes, (Ryspayeva, 2023) proposed the use of gen-
erative adversarial networks (GANs) to generate syn-
thetic images, demonstrating that the technique can
improve model accuracy. In order to increase the
amount of colorectal cancer histological images avail-
able for training, (Jiang et al., 2023) proposed the
use of Multi-Scale Gradient (MSG-GANs) to gener-
ate synthetic images at different scales. The model
generates synthetic images that are filtered by a selec-
tion mechanism to remove images with class ambi-
guity, leading to an improvement in the model accu-
racy from 86.87% to 89.54%. The generator network
was optimized to produce images at various resolu-
tions, ensuring high-quality generated images. Facing
the same challenges, (Brancati and Frucci, 2024) pro-
posed using GANs to increase the number of available
breast tumor images for training. The proposed model
uses Conditional GANs to generate synthetic images,
not directly in terms of pixels but in terms of image
features such as texture and shape, reducing compu-
tational costs while preserving important information.
The use of fractal dimension (FD) has shown potential
in quantifying the morphological complexity of brain
tumours, providing a new method for glioma classifi-
cation. The study by (Battalapalli et al., 2023) inves-
tigated the potential of FD as a biomarker for classi-
fying low-grade and high-grade gliomas in magnetic
resonance images where the model achieved an ac-
curacy of 90% in classifying low-grade gliomas and
85% in classifying high-grade gliomas. Although the
study did not explore histological images, the applica-
tion of FD demonstrates the potential of fractal meth-
ods for extracting complex features. The proposed
method incorporates fractal dimension to extract fea-
tures from colorectal cancer histological images, gen-
erating synthetic images through GANs, which are
used to train a classification model. Moreover, the the
use of GANs assisted by explainable AI (XAI) tools
for enhance the quality of the generated images has
been explored successfully in (Rozendo et al., 2024),
however, this approach has not yet been studied in as-
sociation with handcrafted features.
The motivation behind this study arises from the
need to increase the number of histological images
available for training pathology classification mod-
els. The use of GANs to generate synthetic images
has been applied as a solution to the problem of low
availability of labeled data. Additionally, fractal di-
mension and its association with percolation theory
have been explored as ways to extract complex fea-
tures from histological images. The proposed method
combines these techniques to improve the accuracy of
pathology classification models. The expected contri-
butions of this work are:
1. The extraction of handcrafted fractal features
from histology GAN images;
2. Application of GANs as a data augmentation ap-
proach for histology datasets;
3. Association of XAI techniques and GAN to en-
hance the quality of the generated histology im-
ages.
Section 2 of the article describes the application
of the proposed approach on the selected datasets and
the details of the fractal feature extraction method as
well as the generation of the artificial images. Then,
in Section 3, the results are presented, along with a
comparative performance analysis between different
models. The conclusion is presented in Section 4.
2 MATERIAL AND METHODS
2.1 Datasets
The proposed approach was applied to four different
datasets, which were representative of three differ-
ent types of histological tissue: colorectal, breast and
liver, which are exemplified in Figure 1. The original
images were split into multiple patches with a 64×64
resolution without overlapping. The number of ob-
tained patches as well as an overview of each dataset
is presented in Table 1.
(a) (b) (c)
Figure 1: Samples from each type of histology tissue. (a)
colorectal tissue; (b) breast tissue; (c) liver tissue.
2.2 Method Overview
Our proposed method consists of three different
stages: first, artificial datasets are generated by train-
ing a GAN model using the original patches. Then,
fractal dimension, lacunarity and percolation features
are extracted from the original and artificial patches.
Finally, the generated feature vectors are given as
input to classical machine learning algorithms. An
overview of the proposed approach is shown in Fig-
ure 2, and each stage of the method is explained in the
following subsections.
Association of Fractal Geometry and Data Augmentation Through GANs and XAI for Classification of Histology Images
757
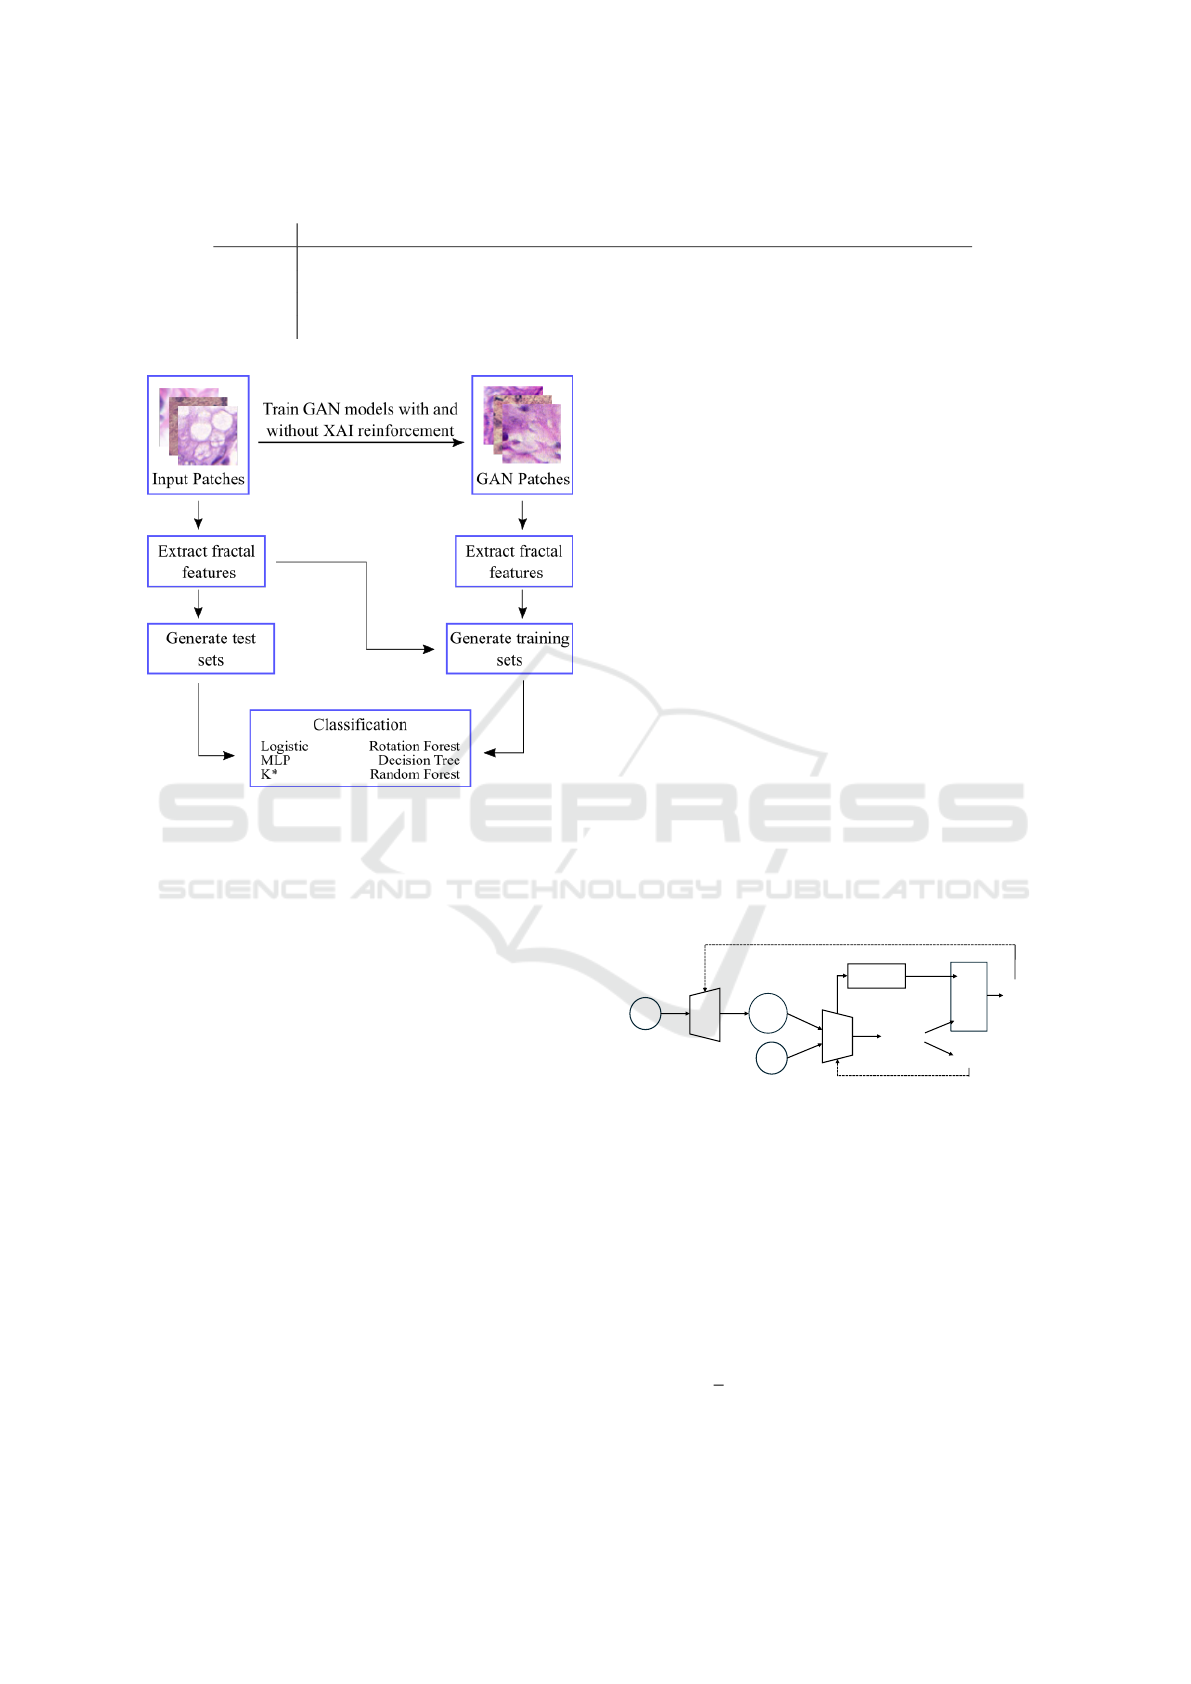
Table 1: Overview of the evaluated datasets.
Dataset Image Classes Samples Patches
UCSB Breast tumours 2 32+26 4,608+3,744
CR Colorectal tumours 2 74+91 4,664+5,736
LG Liver tissue 2 150+115 2,400+1,840
LA Liver tissue 4 100+115+162+152 1,600+1,840+2,592+2,416
Figure 2: Overview of the proposed approach.
2.3 Generating Artificial Patches
To generate artificial patches, we employed a method
called XGAN, which builds upon traditional Gener-
ative Adversarial Networks (GANs) by incorporating
Explainable Artificial Intelligence (XAI) techniques.
In a standard GAN setup, the system comprises
two main components: a generator (G) and a discrim-
inator (D). The generator G is responsible for cre-
ating synthetic images, starting from a random input
vector z. These generated images G(z) are designed
to resemble real data as closely as possible. The dis-
criminator D, on the other hand, acts as a classifier
that evaluates whether a given image is real (x, from
the original dataset) or synthetic (G(z), created by the
generator). The generator improves its output itera-
tively by learning to ”fool” the discriminator, while
the discriminator simultaneously learns to distinguish
real from fake.
The XGAN introduces an additional layer of in-
telligence to this interaction by leveraging XAI tech-
niques to make the discriminator’s decision-making
process transparent. Instead of the generator merely
relying on the discriminator’s binary feedback (real
or fake), it gains access to more detailed insights into
why the discriminator made its decision. These in-
sights, known as ”explanations,” highlight the fea-
tures of the image that the discriminator found most
important in making its classification.
By integrating these explanations (E) into the gen-
erator’s training process, XGAN allows the genera-
tor to understand and focus on the features that are
important for producing more realistic images. This
feedback loop is formalized in a custom loss function
(L
ed
G
), where the traditional adversarial loss (L
adv
G
) is
combined with the XAI-derived explanations to refine
the generator’s output:
L
ed
G
= L
adv
G
· E
For this work, we employed the RaSGAN (Rel-
ativistic Standard GAN) (Jolicoeur-Martineau, 2018)
and WGAN-GP (Wasserstein GAN Gradient Penalty)
(Gulrajani et al., 2017) models to establish the tradi-
tional adversarial loss functions. Additionally, we uti-
lized XAI techniques, including Saliency (Simonyan
et al., 2014), DeepLIFT (Shrikumar et al., 2019), and
Gradient⊙Input (Hechtlinger, 2016), to generate the
explanations (E) that guided the generator’s refine-
ment process. In Figure 3, a schematic of the pro-
posed XGAN model is illustrated.
z
G(z)
x
D
G
XAI
D(.)
E
ℒ
ℒ
ℒ
ed
adv
adv
G
G
D
∗
Figure 3: Schematic of the proposed XGAN model.
2.3.1 Adversarial Models
The loss function for the RaSGAN discriminator, de-
noted as L
RaSGAN
D
, was established as the combination
of the DCGAN loss and the relativistic discriminator
loss:
L
RaSGAN
D
= L
RaSGAN
D
+ L
rel
where the relativistic loss was defined as:
L
rel
= −
1
2
E
x∼p(x),z∼p(z)
[log(D(x) − D(G(z)))].
ICEIS 2025 - 27th International Conference on Enterprise Information Systems
758

As for the generator, the loss function L
RaSGAN
G
was
expressed as:
L
RaSGAN
G
= −
1
2
E
z∼p(z)
[log(1 − D(G(z)))]
−E
x∼p(x)
[log(D(x))]
In our WGAN-GP approach, the loss function for the
discriminator was formulated using the Wasserstein
distance (L
W
) along with a gradient penalty (L
GP
):
L
W GAN−GP
D
= −L
W
+ L
GP
In this formulation, L
W
captured the difference in ex-
pected outputs from the discriminator for real and
synthetic samples:
L
W
= E
x∼p(x)
[D(x)] − E
z∼p(z)
[D(G(z))]
And the L
GP
gradient penalty is represented as:
L
GP
= λE
ˆx∼p( ˆx)
[(∥∇
ˆx
D( ˆx)∥
2
− 1)
2
]
where ˆx denotes an interpolated sample created be-
tween real and generated data, and λ adjusts the
strength of the penalty. For the generator, the loss
function was given by the negative of the expected
output from the discriminator for the generated sam-
ples:
L
G
W GAN−GP
= −E
z∼p(z)
[D(G(z))]
2.3.2 XAI Methods
To obtain the Saliency explanation (E
Saliency
) for a
generated image G(z), we computed the gradient of
the discriminator’s output D(G(z)) with respect to the
input G(z):
E
Saliency
=
∂D(G(z))
∂G(z)
.
To implement the DeepLIFT method, we evaluated
the importance of input G(z) by comparing its impact
on the output with a baseline input x
0
, which was set
to minimal activation (zero). Denoting t as the output
neuron and η
1
, η
2
, . . . , η
n
as the neurons influencing t,
we define the difference in output as ∆t = t − t
0
. The
explanation E
DeepLIFT
is calculated as:
E
DeepLIFT
=
n
∑
i=1
C∆η
i
∆t = ∆t, (15)
where ∆η
i
represents the change in activations for
G(z) versus x
0
, and C∆η
i
∆t indicates how much ∆η
i
contributes to ∆t. Lastly, for the Gradient⊙Input ex-
planation (E
Gradient⊙Input
), we performed a multipli-
cation of the gradients with the input values:
E
Gradient⊙Input
=
∂D(G(z))
∂G(z)
⊙ G(z).
2.3.3 Fractal Features
In order to obtain handcrafted features from both the
original and artificial image sets, we apply the fea-
ture extraction techniques based on fractal geometry
as described in (Roberto et al., 2021). The three types
of fractal features extracted are: Fractal Dimension
(FD), which is a metric that accounts for how much
space is filled in a structure, such as an image; La-
cunarity (LAC), which is a measure complementary
to the FD, which accounts for how the space of a
fractal is filled; and Percolation (PERC), which eval-
uates properties such as the distribution of cluster and
the porosity of a structure. This is done by apply-
ing the multiscale and multidimensional approaches
proposed by (Ivanovici and Richard, 2010). The mul-
tiscale approach consists in applying the gliding-box
algorithm to evaluate all regions of the image at dif-
ferent scales, and the multidimensional approach con-
sists in evaluating pixel similarity levels inside a given
region sized L × L, considering the intensity of the
RGB color channels and the chessboard distance be-
tween each pixel and the center pixel of the region.
The local and global features are then obtained, which
results in a features vector composed of 100 local and
21 global features for each image.
2.3.4 Classification and Performance Evaluation
After obtaining all 121 features from the original and
artificial patches of the four evaluated datasets, we
prepared the training and test feature sets using a 10-
fold cross validation approach. The classifications
were performed on the Weka 3.8.6 platform. We
chose six classifiers that were representative of the
most common supervised learning approaches: Lo-
gistic (LOG), Multilayer Perceptron (MLP), K*, Ro-
tation Forest (RoF), Decision Tree (DT) and Random
Forest (Raf). All classifications were done using the
algorithm’s default parameters in Weka.
Since the datasets are not perfectly balanced, we
chose to use the area under the ROC curve (AUC) as
the evaluation metric. After classifying the feature
sets from all GAN and XAI associations of the four
datasets, we applied the Friedman’s non-parametric
test to verify the statistical significance of the obtained
results (Japkowicz and Shah, 2011). This test was per-
formed using the software Stats Direct.
3 RESULTS AND DISCUSSION
In this section, we present the results obtained from
the application of our proposed approach. Firstly, we
Association of Fractal Geometry and Data Augmentation Through GANs and XAI for Classification of Histology Images
759

present the AUC values obtained from the classifica-
tion of all four tested datasets. Then, we present a
statistical analysis using a non-parametric test. In all
tables, the best results are highlighted in bold.
The first evaluation was performed on the UCSB
dataset. The AUC values obtained from applying our
approach to the original and generated patches are
shown in Table 2. The best overall result was ob-
tained using only the original patches and the LOG
classifier, which provided an AUC value of 0.747. Re-
garding the application of our approach, the best re-
sult consisted of an AUC value of 0.740, which was
also obtained with the LOG classifier and associating
the WGAN-GP with the DeepLift explanation.
For the CR dataset, the best classification result
was an AUC value of 0.802, which was obtained from
the classification of the original patches using the RaF
classifier. This classifier was able to provide the best
AUC values in all of the nine evaluated scenarios for
this dataset. When our approach was applied, the best
result (0.799) was obtained using the RaSGAN with
InputXGrad explanations. These results are shown in
Table 3.
Finally, we evaluated the liver tissue datasets. For
the LG dataset, as shown in Table 4, the best AUC
value was obtained by applying our proposed method
using the WGAN-GP and either the DeepLift or In-
putXGrad explanations. With these combinations, the
AUC value of 0.924 was provided by the RaF classi-
fier. As for the LA dataset, the results shown in Table
5 show that the highest AUC value was obtained when
our approach was applied using the RaSGAN with
Saliency explanations. This combination provided an
AUC value of 0.912 using the MLP classifier.
In order to evaluate the statistical significancy of
these results, we applied the non-parametric Fried-
man test to calculate the average rankings of each of
the 54 tested combinations (classifier + GAN + ex-
planation method). The average ranking of each of
these combinations is shown in Table 6. The 10 high-
est rankings are highlighted in bold. The best average
ranking was achieved using the RaF classifier with
our approach by combining the RaSGAN and the In-
putXGrad explanations. In fact, the use of the InputX-
Grad explanations with the WGAN-GP was also able
to provide the second best average ranking with the
RaF classifier. All of the combinations evaluated with
this classifier were ranked in the Top-10, which indi-
cates that the RaF is able to consistently provide high
AUC values for these datasets.
However, when we apply 2-sided Conover test to
evaluate all pairwise comparisons between each of the
tested combinations, we verified that the performance
difference among the 10 best ranked treatments is
not statistically significant considering α < 0.05. For
instance, the p-value obtained when comparing the
combination that provided the best average ranking
obtained using our proposed approach (RaF + RaS-
GAN + InputXGrad) and the one obtained using only
the original images is P
k
= 0.638. This indicates that,
despite providing the best overall results, our method
only slightly improves the results obtained when only
the original patches are used.
4 CONCLUSION
In this work, we aimed to demonstrate the capabilities
of handcrafted features combined with data augmen-
tation, evaluating these methods for their potential to
improve diagnostic accuracy in histological images.
We applied two different types of Generative Adver-
sarial Networks (GANs) to datasets of colorectal tis-
sue (CR), breast tissue (UCSB), and liver tissue (LG
and LA), and then compared the test results of var-
ious types of classic machine learning algorithms in
the handcrafted features — as described in (Roberto
et al., 2021) — extracted from the datasets, with
and without artificial augmentation. Additionally, we
evaluated the contribution of explainable AI methods
applied during the generating phases and how they
could influence the resulting accuracy comparison.
To this end, RasGAN and WGAN-GP were imple-
mented with different XAI methods during the gener-
ating phase: DeepLift, InputXGrad, and Saliency, as
described in (Rozendo et al., 2024). Hence, to inves-
tigate whether the classic algorithms and GANs com-
bined with handcrafted features can obtain competi-
tive results in the classification of histological images
— which is noted in brain magnetic resonance images
(Battalapalli et al., 2023) — we conducted a com-
prehensive analysis on both original and augmented
datasets. This allowed us to evaluate the impact of
data augmentation on classification accuracy across
multiple tissue types and algorithm combinations.
The results were solid regarding the usage of
GANs, but the obtained AUC values suggest that the
improvement obtained with data augmentation is min-
imal, occurring only in a few select combinations of
datasets and algorithms. However, it fails to reach
the same level of improvement observed with the use
of GANs in (Jiang et al., 2023) and (Rozendo et al.,
2024). Otherwise, the performance of the differ-
ent classification algorithms regarding the presence
of data augmentation generally remains equal. As
observed in the UCSB dataset: the combination of
WGAN-GP surpasses or is equal to both RasGAN
and original implementations in RaF and MLP —
ICEIS 2025 - 27th International Conference on Enterprise Information Systems
760
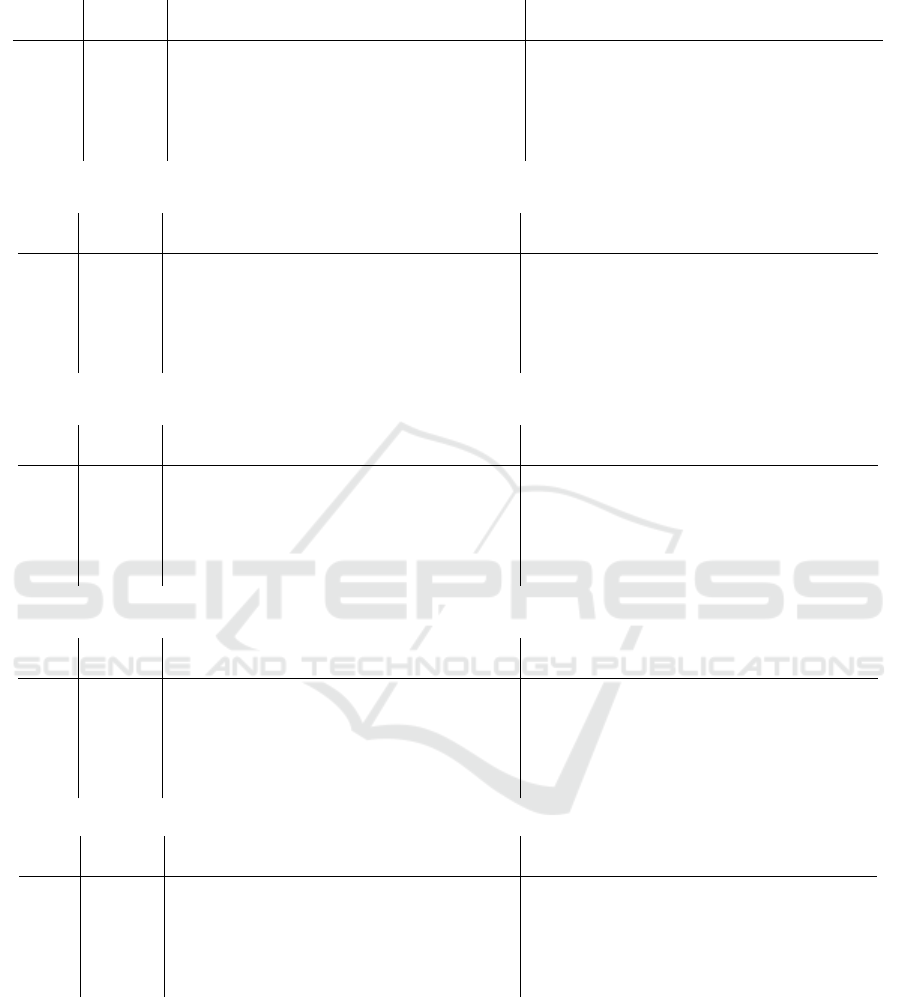
Table 2: AUC values obtained from the classification of the UCSB dataset.
UCSB Original
RaSGAN WGAN-GP
None Deep Lift Input XGrad Saliency None Deep Lift Input XGrad Saliency
LOG 0.747 0.735 0.725 0.724 0.718 0.739 0.740 0.733 0.738
MLP 0.701 0.720 0.715 0.716 0.714 0.711 0.711 0.717 0.722
K* 0.628 0.626 0.625 0.626 0.625 0.619 0.619 0.625 0.624
RoF 0.729 0.732 0.727 0.726 0.723 0.726 0.724 0.732 0.726
DT 0.605 0.598 0.608 0.617 0.608 0.605 0.607 0.602 0.611
RaF 0.732 0.731 0.730 0.731 0.730 0.730 0.729 0.732 0.733
Table 3: AUC values obtained from the classification of the CR dataset.
CR Original
RaSGAN WGAN-GP
None Deep Lift Input XGrad Saliency None Deep Lift Input XGrad Saliency
LOG 0.786 0.770 0.778 0.778 0.780 0.783 0.769 0.771 0.778
MLP 0.783 0.782 0.776 0.782 0.777 0.785 0.785 0.782 0.778
K* 0.678 0.676 0.677 0.677 0.678 0.677 0.672 0.674 0.674
RoF 0.788 0.788 0.789 0.791 0.789 0.789 0.789 0.787 0.784
DT 0.636 0.636 0.643 0.641 0.640 0.642 0.636 0.639 0.636
RaF 0.802 0.794 0.798 0.799 0.798 0.798 0.795 0.794 0.797
Table 4: AUC values obtained from the classification of the LG dataset.
LG Original
RaSGAN WGAN-GP
None Deep Lift Input XGrad Saliency None Deep Lift Input XGrad Saliency
LOG 0.922 0.914 0.913 0.913 0.910 0.909 0.915 0.916 0.898
MLP 0.922 0.919 0.918 0.920 0.916 0.917 0.916 0.908 0.917
K* 0.828 0.829 0.829 0.829 0.829 0.829 0.829 0.829 0.829
RoF 0.922 0.921 0.920 0.921 0.918 0.921 0.923 0.918 0.918
DT 0.777 0.754 0.768 0.758 0.756 0.773 0.752 0.769 0.753
RaF 0.923 0.923 0.922 0.923 0.923 0.923 0.924 0.924 0.923
Table 5: AUC values obtained from the classification of the LA dataset.
LA Original
RaSGAN WGAN-GP
None Deep Lift Input XGrad Saliency None Deep Lift Input XGrad Saliency
LOG 0.898 0.894 0.894 0.894 0.896 0.890 0.891 0.892 0.890
MLP 0.901 0.908 0.905 0.905 0.912 0.905 0.911 0.910 0.907
K* 0.817 0.817 0.817 0.818 0.818 0.818 0.818 0.817 0.818
RoF 0.893 0.891 0.892 0.892 0.891 0.889 0.891 0.888 0.889
DT 0.733 0.734 0.734 0.732 0.733 0.731 0.732 0.736 0.733
RaF 0.897 0.897 0.897 0.899 0.898 0.897 0.898 0.898 0.897
Table 6: Average rankings provided by the Friedman test for each tested combination.
Original
RaSGAN WGAN-GP
None Deep Lift Input XGrad Saliency None Deep Lift Input XGrad Saliency
LOG 10.8 21.9 25.8 26.1 26.9 22.9 22.8 22.0 25.4
MLP 19.8 20.6 25.1 22.9 24.4 23.6 19.9 19.9 24.3
K* 40.6 41.0 41.1 40.5 39.4 40.9 42.1 42.0 41.4
RoF 17.1 17.4 18.6 18.0 21.8 20.8 18.1 20.4 23.9
DT 50.0 51.5 47.8 49.1 49.6 49.9 52.3 49.3 50.6
RaF 8.4 11.0 11.9 7.6 9.4 10.5 9.6 8.0 8.9
with Saliency — and in RoF — with InputXGrad —;
the performance of LOG and K* is better in the orig-
inal implementation; and RasGAN performs better in
RoF and DT, with no XAI method and with InputX-
Grad respectively. A similar pattern can be noted in
the CR dataset, with each type of augmentation per-
forming better in the same number of algorithms, not
following a specific pattern. However, the perfor-
mance in the LG dataset is more pronounced, with
RasGAN never providing the better results. Since our
implementations performed equally well in the other
two datasets, with no combination standing out, the
results raise the question of whether data augmenta-
tion made a significant difference in these classifica-
tions at all. Additionally, the LG dataset generally
suggests that between RasGAN and WGAN-GP, the
Association of Fractal Geometry and Data Augmentation Through GANs and XAI for Classification of Histology Images
761

latter can be more competitive with the no augmenta-
tion implementation.
In essence, the potential of GANs to compensate
for dataset difficulties, including or not XAI methods,
is not very present here, and this can be for a variety
of reasons, including the necessity of more intensive
training in the generating phase. Nevertheless, this
work is significant for the fractal features and histo-
logical images classification research, as it presents
the results performance of using handcrafted features
in histological images. These findings provide guide-
lines for researchers and experts interested in develop-
ing artificial augmentation techniques for histopatho-
logical datasets, and what to expect on the perfor-
mance of these methods. The association of hand-
crafted features and data augmentation in histological
images does not present itself in these cases, but since
it should improve the results, there are a few lines to
go from here.
In future work, we should evaluate different GAN
training methods combined with handcrafted features.
There’s potential for augmentation to yield better
results with more intensive training, compared to
transformer and convolutional counterparts (Rozendo
et al., 2024). While this might seem like a draw-
back, the time invested in fractal geometry analysis —
which can be significantly shorter than more complex
implementations in some cases — offsets this con-
cern. Furthermore, the potential for combining frac-
tal geometry analysis with other advanced machine
learning techniques could lead to more robust and ac-
curate classification models for histological images.
As the field continues to evolve, it will be crucial to
explore these hybrid approaches to maximize the ben-
efits of both handcrafted features and new techniques.
ACKNOWLEDGEMENTS
This research was funded in part by the Coordenac¸
˜
ao
de Aperfeic¸oamento de Pessoal de N
´
ıvel Supe-
rior—Brasil (CAPES)—Finance Code 001; National
Council for Scientific and Technological Develop-
ment CNPq (Grants #132940/2019-1, #313643/2021-
0 and #311404/2021-9); the State of Minas Gerais Re-
search Foundation—FAPEMIG (Grant #APQ-00578-
18); S
˜
ao Paulo Research Foundation—FAPESP
(Grant #2022/03020-1).
REFERENCES
Alajaji, S. A., Khoury, Z. H., Elgharib, M., Saeed, M.,
Ahmed, A. R., Khan, M. B., Tavares, T., Jessri, M.,
Puche, A. C., Hoorfar, H., et al. (2023). Generative
adversarial networks in digital histopathology: current
applications, limitations, ethical considerations, and
future directions. Modern Pathology, page 100369.
Battalapalli, D., Vidyadharan, S., Prabhakar Rao, B., Yo-
geeswari, P., Kesavadas, C., and Rajagopalan, V.
(2023). Fractal dimension: analyzing its potential
as a neuroimaging biomarker for brain tumor diagno-
sis using machine learning. Frontiers in Physiology,
14:1201617.
Brancati, N. and Frucci, M. (2024). Improving breast tumor
multi-classification from high-resolution histological
images with the integration of feature space data aug-
mentation. Information, 15(2):98.
Gulrajani, I., Ahmed, F., Arjovsky, M., Dumoulin, V., and
Courville, A. (2017). Improved training of wasser-
stein gans.
Hechtlinger, Y. (2016). Interpretation of prediction models
using the input gradient.
Ivanovici, M. and Richard, N. (2010). Fractal dimension
of color fractal images. IEEE Transactions on Image
Processing, 20(1):227–235.
Japkowicz, N. and Shah, M. (2011). Evaluating learning
algorithms: a classification perspective. Cambridge
University Press.
Jiang, L., Huang, S., Luo, C., Zhang, J., Chen, W., and Liu,
Z. (2023). An improved multi-scale gradient gener-
ative adversarial network for enhancing classification
of colorectal cancer histological images. Frontiers in
Oncology, 13:1240645.
Jolicoeur-Martineau, A. (2018). The relativistic discrimina-
tor: a key element missing from standard gan.
Roberto, G. F., Lumini, A., Neves, L. A., and do Nasci-
mento, M. Z. (2021). Fractal neural network: A new
ensemble of fractal geometry and convolutional neu-
ral networks for the classification of histology images.
Expert Systems with Applications, 166:114103.
Rozendo, G. B., Garcia, B. L. d. O., Borgue, V. A. T.,
Lumini, A., Tosta, T. A. A., Nascimento, M. Z. d.,
and Neves, L. A. (2024). Data augmentation in
histopathological classification: An analysis explor-
ing gans with xai and vision transformers. Applied
Sciences, 14(18):8125.
Ryspayeva, M. (2023). Generative adversarial network as
data balance and augmentation tool in histopathology
of breast cancer. In 2023 IEEE International Confer-
ence on Smart Information Systems and Technologies
(SIST), pages 99–104. IEEE.
Shrikumar, A., Greenside, P., and Kundaje, A. (2019).
Learning important features through propagating ac-
tivation differences.
Simonyan, K., Vedaldi, A., and Zisserman, A. (2014).
Deep inside convolutional networks: Visualising im-
age classification models and saliency maps.
ICEIS 2025 - 27th International Conference on Enterprise Information Systems
762
