
Automatic Lead Qualification Based on Opinion Mining in CRM
Projects: An Experimental Study Using Social Media
Victor Hugo Ferrari Can
ˆ
edo Radich
a
, Tania Basso
b
and Regina Lucia de Oliveira Moraes
c
University of Campinas - UNICAMP, Limeira, Brazil
Keywords:
Lead Qualification, Sentiment Analysis, Opinion Mining, Machine Learning, CRM, Lead Scoring, NLP.
Abstract:
Lead qualification is one of the main procedures in Customer Relationship Management (CRM) projects.
Its main goal is to identify potential consumers who have the ideal characteristics to establish a profitable
and long-term relationship with a certain organization. Social networks can be an important source of data
for identifying and qualifying leads, since interest in specific products or services can be identified from the
users’ expressed feelings of (dis)satisfaction. In this context, this work proposes the use of machine learning
techniques and sentiment analysis as an extra step in the lead qualification process in order to improve it. In
addition to machine learning models, sentiment analysis, also called opinion mining, can be used to understand
the evaluation that the user makes of a particular service, product, or brand. The results indicated that sentiment
analysis derived from social media data can serve as an important calibrator for the lead score, representing a
significant competitive advantage for companies. By incorporating consumer sentiment insights, it becomes
possible to adjust the Lead Score more accurately, enabling more effective segmentation and more targeted
conversion strategies.
1 INTRODUCTION
Currently, we live in a world where major changes are
taking place in consumption relationships, and the in-
ternet and social networks play a key role in these
changes. Social networks have helped build a col-
lective identity and create true consumer communi-
ties, becoming a major influence on consumption and
overcoming marketing communications and even per-
sonal preferences. Consumers are continually shar-
ing positive or negative stories about their experiences
and preferences. (Kotler et al., 2017) found that spon-
taneous conversations about brands are more reliable
than targeted advertising campaigns.
At the same time, market competition has also
been changing, and technology plays an important
role in this change. By connecting more than millions
of people, businesses, governments, and advertisers,
these technologies allow collecting, storing, and pro-
cessing large amounts of information about the be-
havior, preferences, interests, ideas, knowledge, and
physical and psychological characteristics of Internet
a
https://orcid.org/0009-0003-8512-2639
b
https://orcid.org/0000-0003-2467-2437
c
https://orcid.org/0000-0003-0678-4777
users. This information can be a source of significant
competitive advantage if they are used, for example,
to assess the likelihood that a new contact will become
a customer.
In this context, having an efficient process to iden-
tify potential customers with the ideal characteristics
for a profitable and long-term relationship can be de-
cisive for business continuity. To achieve better cus-
tomer relationship, companies adopt what is called
Customer Relationship Management (CRM), i.e., a
software that allows the monitoring of all interactions
with current and future customers (Jadli et al., 2022).
In the context of CRM, the management and qual-
ification of leads play a crucial role in improving cus-
tomer acquisition strategies. A lead is defined as a
contact who has shown interest in a company’s prod-
uct or service. To enhance the accuracy of lead qual-
ification, this study integrates traditional lead scoring
techniques with sentiment analysis, leveraging data
from social networks to adjust lead rankings based on
user feedback and historical interaction data. The fol-
lowing section outlines the methodology used to im-
plement and evaluate this enhanced approach. Thus,
lead management comprises all the steps taken by a
commercial team to track a future client (the lead)
from the first contact with the company until the com-
456
Radich, V. H. F. C., Basso, T. and Moraes, R. L. O.
Automatic Lead Qualification Based on Opinion Mining in CRM Projects: An Experimental Study Using Social Media.
DOI: 10.5220/0013237400003929
In Proceedings of the 27th International Conference on Enterprise Information Systems (ICEIS 2025) - Volume 1, pages 456-466
ISBN: 978-989-758-749-8; ISSN: 2184-4992
Copyright © 2025 by Paper published under CC license (CC BY-NC-ND 4.0)
pletion of the purchase (Kotler and Keller, 2012).
Still, in the context of customer relations, and to help
the sales and marketing companies, lead scoring tech-
niques are adopted. These techniques aim to identify
leads that are more likely to become customers, qual-
ify them, and then prioritize them (Koschnick, 1995).
With the emergence of big data, it became possi-
ble to create data-driven marketing in companies that
use collected data for decision-making. However, few
companies manage to achieve all the competitive ad-
vantages or have found the best way to practice data
marketing. Forecasting is a problem for many com-
panies, and most of Salesforce relies on intuition to
evaluate each lead, which causes different kind of
intuitions, making forecast inaccurate (Kotler et al.,
2021).
In this work it is presented an alternative analysis
for the mapping of the persona (i.e., ideal customer
archetype). This analysis comprises the addition of a
step in the lead management, which consists of sen-
timent analysis or opinion mining through social net-
work data. This would provide decision makers with a
proposal for improving lead scoring and qualification,
and, consequently, assisting in developing more rele-
vant marketing strategies for consumers current and
future needs.
After this introduction, Section 2 presents some
background, which is essential to understand the
work. Related works are presented in Section 3. Sec-
tion 4 explain the methodology followed by the re-
sults and discussion in Section 4.6. Finally, the Sec-
tion 5 concludes presenting the main challenges for
the future, as well as its potential impact on organiza-
tions.
2 BACKGROUND
This section brings the fundamental concepts for un-
derstanding the proposal. As such, Section 2.1 covers
CRM systems and lead qualification, and ML-based
lead scoring models are presented in Section 2.2. Sec-
tion 2.3 addresses natural language processing (NLP)
and sentiment analysis.
2.1 CRM Systems and Lead
Qualification
A qualified lead is a contact identified by a company’s
marketing or sales team as a potential customer. Lead
management (and interest group segmentation) are
practices commonly used in CRM systems to help the
company divide the market into groups of customers
based on different needs, characteristics, or behaviors
that may require a product or a strategy for differenti-
ated marketing.
The main objective of a CRM system is to observe
the life cycle and behavior of a consumer. Monitoring
this customer-company relationship can also facilitate
the creation of actions focused on customer loyalty
and satisfaction. Thus, the CRM is a solution that can
be used by the marketing and sales teams as well as
the after-sales and service teams.
A strategic model widely used by sales and mar-
keting teams to monitor customer relationships is the
sales funnel. This tool is a visually structured model
separated by stages, where the entire buying journey
of a potential customer can be observed (Kotler and
Keller, 2012). This model can be adapted according
to the realities of each company or type of business.
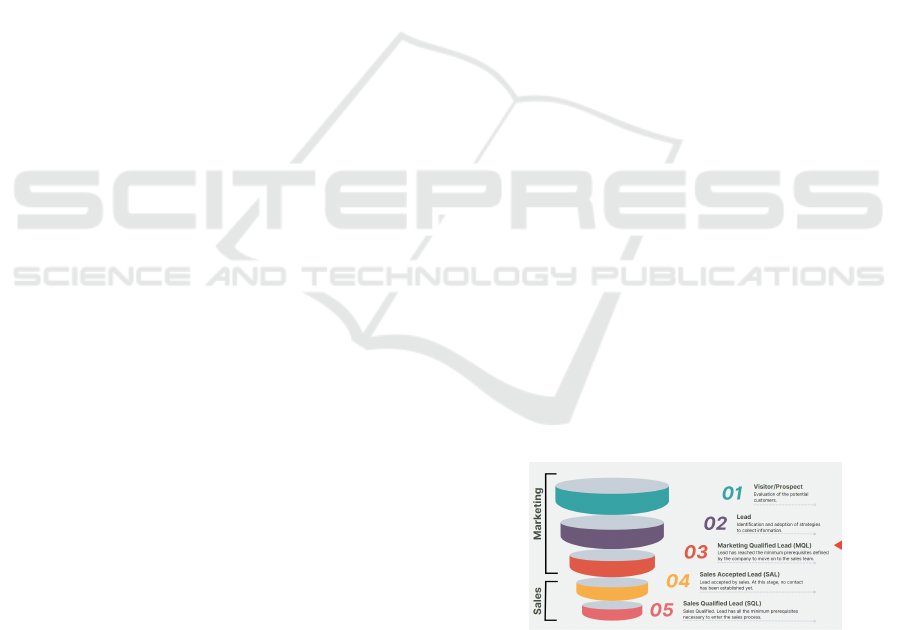
Figure 1 presents an expanded adaptation of the sales
funnel of Kotler and Keller (2012).
In Figure 1, the steps 1 (Visitor/Prospect) and 2
(Lead) comprise the Top of the Funnel, where knowl-
edge and discovery of the product or service by visi-
tors take place; the marketing team does the prospect-
ing (or attraction) in an attempt to convert the visi-
tors into leads; the collection of basic contact infor-
mation is performed. The steps 3 (Marketing Qual-
ified Lead) and 4 (Sales Accepted Lead) comprise
the Middle of the Funnel, where visitors have already
interacted with some brand or product content and
showed interest by providing some type of personal
information, either directly or indirectly; lead quali-
fication takes place and a relationship of trust is es-
tablished with the future customer, so that he can ad-
vance in the sales funnel. Finally, the step 5 (Sales
Qualified Lead) comprises the Bottom of the Funnel,
where leads that have gone through the entire process
of getting to know the product or service are identi-
fied; the marketing team has classified them as ready
to be contacted by a salesperson.
Figure 1: Lead qualification process.(Kotler and Keller,
2012).
The qualification process is typically time-
consuming and complex, and it frequently results in
loss of temporal aspect of the potential client’s need.
Many times, when the approach is made, the cus-
tomer’s need has already been solved or no longer
exists. For this reason, the need to qualify a lead
Automatic Lead Qualification Based on Opinion Mining in CRM Projects: An Experimental Study Using Social Media
457

quickly and assertively becomes increasingly relevant
for companies and this is where our approach can
help.
2.2 ML Based Lead Scoring Models
Lead Scoring aims to classify leads to determine
which are most likely to purchase a particular product
or service, and therefore, they should be prioritized
within a sales process through a score assigned to lead
actions in the funnel stages or by specific character-
istics of the potential customer. In traditional lead
scoring models, the values assigned to each action or
characteristic of the lead are at the discretion of the
sales or marketing teams (experts), who, empirically,
assign a score to each item that makes up the score.
Usually, a sum of these scores is obtained, and the
responsible team will indicate whether or not a lead
is qualified to proceed with a purchase or service ac-
quisition, considering a final cut-off score previously
defined by the company.
In this work, supervised models will be used,
whose results, obtained after using classification
methods, consist of labels assigned to a sample based
on attributes and numbers for methods based on re-
gression. Some ML algorithms were evaluated by
Skiena (Skiena, 2017) based on a subjective analy-
sis (considering five dimensions: power, ease of inter-
pretation, ease of use, training speed, and prediction
speed) and will be considered in this research for ef-
fectiveness analysis and performance in building lead
scoring. The idea is to evaluate these different tech-
niques to identify those that present good accuracy af-
ter training combined with good prediction speed.
2.3 Natural Language Processing (NLP)
and Sentiment Analysis
Natural language processing (NLP) is a field of AI
that gives machines the ability to read, understand,
and derive meaning from human languages, which en-
compass both written and spoken language.
Currently, the two most widespread NLP appli-
cations are voice-controlled personal assistants and
chatbots (which can even understand sentiments)
(Kotler et al., 2021).
Sentiment analysis consists of mining texts in or-
der to identify and extract subjective information that
may help in understanding and classifying the opinion
of the user who wrote the text. The objective of this
type of analysis is to label the analyzed text according
to the opinion or sentiment contained in it.
Opinion texts are generally informal and contain
slang, irony, sarcasm, abbreviations, and emoticons.
Due to the complexity of its process of understanding
and manipulating language, it is common to use sev-
eral different techniques to deal with different prob-
lems during sentiment analysis. One of these tech-
niques is tokenization, which is used to divide a
sentence into several elements (or *tokens*), while
discarding some characters, such as punctuation or
spaces.
Recent NLP research using artificial neural net-
works is enabling the creation of pre-trained models.
BERT (Bidirectional Encoder Representations from
Transformers), launched by Google in 2018 as a new
algorithm in its engine, is a recent example of this
evolution. This solution consists of a pre-trained NLP
model that seeks to improve the user experience with
a better understanding of what is being researched,
with the objective of presenting increasingly assertive
results, learning from the user experience. More re-
cently, in October 2020, a group of researchers pre-
sented a version of BERT for Brazilian Portuguese,
which was called BERTimbau (Souza et al., 2020).
This model is very promising and represents a signif-
icant advance for the state of the art in this area of
research.
3 RELATED WORK
Regarding lead scoring models, the work presented
by (Benhaddou and Leray, 2017) describes a way to
build a lead scoring model with a Bayesian network
for CRM systems. In training, the model performed
well in terms of precision, recall, and accuracy. How-
ever, the few available examples and the imbalance
presented in the data set indicate that the model still
needs to be improved. Cust
´
odio et al.(Cust
´
odio et al.,
2020) proposed the construction of a lead scoring
model for companies that operate in the context of
public tenders. The authors compared some ML al-
gorithms such as SVM, Random Forests, Neural Net-
works, and Adaboost, and the SVM presented the best
performance for the data set. However, the expected
results do not consider the company’s expertise, fo-
cusing on historical data. Jadli et al.(Jadli et al., 2022)
compare the performance of several ML algorithms
to predict and drive models using lead scoring. The
Random Forest and Decision Tree models presented
the highest accuracy scores. This work served as a
starting point for selecting the ML algorithms, and
the partial results that we obtained corroborate their
results regarding the algorithms’ applicability tested
so far.
Related to sentiment analysis, Feizollah et
al.(Feizollah et al., 2019) presented a model that col-
ICEIS 2025 - 27th International Conference on Enterprise Information Systems
458

lected Twitter posts about halal tourism and cosmetics
in the last ten years. An experiment was carried out
to calculate and analyze the sentiment of tweets using
deep learning algorithms. They grouped the texts into
positive or negative sentiments and quantified them.
The authors used extensive data collection to train the
algorithms and achieved good accuracy. The work by
Nilpao et al.(Nilpao et al., 2022) proposed an appli-
cation to recommend coffee shops based on Twitter
data. Based on the sentiment analysis collected, the
application shows the coffee shop mentioned in the
texts on the map. The model used for sentiment anal-
ysis is the Naive Bayes method and reached 86% of
the mean accuracy.
Specific works in Brazilian Portuguese were an-
alyzed. Cardoso and Pereira (Cardoso and Pereira,
2020) presented a supervised method using NLP tools
for opinion mining in Portuguese and English lan-
guages. In this study, the authors investigated the
maturity of the tools for Portuguese in comparison
with the already-consolidated tools for the English
language. The authors identified that it is not rec-
ommended to translate texts from Portuguese to En-
glish in order to obtain greater efficiency, as automatic
translation introduces losses in the quality of texts.
In the work of Sousa et al. (Souza et al.,
2020), BERT (Bidirectional Encoder Representations
from Transformers) models for Brazilian Portuguese
were trained. The authors identified that the models
achieved superior performance for NLP tasks com-
pared to multilingual BERT. This model in the pre-
trained version, for Brazilian Portuguese (BERTim-
bau), will be used in the present work. Models based
on the Transformers architecture, such as BERT, per-
formed well for our type of analysis (Souza et al.,
2020).
Since some works do not consider the company’s
expertise (Cust
´
odio et al., 2020) or dataset character-
istics (e.g., unbalanced data) (Benhaddou and Leray,
2017), and using intuition to evaluate each lead makes
the forecast inaccurate (Koschnick, 1995), we believe
that including sentiment analysis in the lead scoring
process would help to improve the results of this pro-
cess, especially when it comes to sentiment analysis
in the Brazilian Portuguese language.
4 THE APPROACH
A quick and efficient automated lead qualification
process is a significant competitive advantage for
companies and organizations, as response time plays
a critical role in converting leads into customers
and can greatly influence consumer decision-making.
Leveraging machine learning models and sentiment
analysis from social media can further enhance this
process by accelerating lead qualification and en-
abling personalized, timely responses, improving
overall conversion rates.
So, it is understood that ML models combined
with sentiment analysis in social networks can be used
as important accelerators. By having these types of
monitoring tools available, companies can combine
data that is already stored in their knowledge bases
with information shared in real time on networks.
Still, as in traditional marketing, you can combine all
this data in a model with the company’s own exper-
tise. Thus, the use of these technologies allows com-
panies to anticipate potential customer recognition
and be able to prepare more personalized responses
at the most appropriate time.
The proposed approach is a lead qualification pro-
cess consisting of five steps, as shown in Figure 1.
This process is based on the conceptual scheme of the
sales funnel, where an adaptation was made to repre-
sent the qualification of leads in companies that work
with sales of products or services.
The final score will be reached after the execution
of all the steps. Figure 2 shows the macro flow of the
process, whose steps are:
Figure 2: Score Calculation Macroflow Process.
• Pre-processing: in this step, the cleaning pro-
cesses of the collected data will be carried out (re-
moval of duplicate data, normalization, reduction,
and transformation of data); the textual elements
will also be pre-processed for sentiment analysis;
• Segmentation: in this step, the contact database
is segmented based on characteristics and behav-
iors; converted and non-converted leads will be
separated from the historical base; other groups
can be established depending on the characteristic
to be scored (for example, considering the ideal
customer profile for a company, brand, service, or
product); a later adjustment in the score can be
made according to the definition of the company
(expertise);
Automatic Lead Qualification Based on Opinion Mining in CRM Projects: An Experimental Study Using Social Media
459

• Lead scoring: after cleaning the data and seg-
menting it into interest groups, the score can be
defined; available historical data will be used,
considering the activity and behavior of each lead
and customer (leads already converted and seg-
mented in the Segmentation step), as well as their
profiles (as defined by the company), for assign-
ing an initial score. The best ML model will be
used to define the score;
• Calibration: a critical step of the entire process,
where the contacts will be recycled according to
the score obtained in the previous lead scoring
stage, and those who have had some change in
behavior (online or offline) will receive an appro-
priate score, in addition to adding the results ob-
tained in the sentiment analysis. In this case, re-
views with 1 to 3 stars are classified as negative,
while those with 4 or 5 stars are classified as pos-
itive.
• Evaluation of results: this step consists of evaluat-
ing whether the score obtained is sufficient for the
contact to be considered a qualified lead. Partial
results will be evaluated according to the cutoff
score (minimum score defined for the model); in
practice, if the minimum score is reached, it will
indicate that the leads in question are ready to be
sent to the sales team.
For this study, we selected a public dataset pro-
vided by the Kaggle community (Kaggle, 2024), con-
taining 9,240 records and 37 attributes related to lead
behavior and the profile of a fictitious education-
focused company. This dataset was chosen for being
reasonably balanced between users who became cus-
tomers (3,561) and those who did not convert (5,679),
in addition to already containing the leads’ behavioral
history. These factors enable a more accurate analysis
of the experimental results.
Since the calibration step requires sentiment anal-
ysis, it is important to define the best strategy to per-
form it. So, we investigated how the use of ma-
chine learning models and the use of an artificial
intelligence-based algorithm (ChatGPT) can be ap-
plied to identify sentiments in evaluations posted by
social network users. The goal is, first, to identify the
best machine learning model for this context. Then,
investigate whether it is worth using a model trained
specifically with the text analysis or if it is better to
use the generic ChatGPT model. Details and results
of this study are in the subsection 4.4.
4.1 Predictive Model
Initially, the pre-processing step was performed (see
Figure 2). The first analysis was focused on balanc-
ing the classes “converted leads” and “unconverted
leads”. Although the data were not fully equalized in
proportion, we understand that they represented the
reality of conversion rate, establishing a proportion
of approximately 60% (not converted) to 40% (con-
verted). Then it was necessary to make a cleaning in
the base, as it had a lot of blank or null data. For
this reason, some variables were removed from the
dataset. The criterion adopted was to exclude vari-
ables that presented more than 50% of null values.
In this first stage the dimension was reduced from 37
to 22 attributes. It is worth mentioning that among
the attributes that remained, two represent the com-
pany’s expertise and were previously evaluated based
on the lead’s activities. Continuing with a more care-
ful analysis, some outliers were excluded, as they
could distort the results of statistical analyses. So, it is
important to identify and to treat them appropriately
(Mitchell, 1997). With this step, the execution of the
Pre-Processing stage of the solution was concluded.
In the segmentation stage (Figure 2), the data set
was divided into two parts, one referring to converted
leads and the other to non-converted leads. Using this
approach, it was possible to identify some interesting
behaviors and patterns. For example, both converted
and non-converted leads come from the same source:
Google. Also, in most cases, the last recorded ac-
tivity of converted leads was sending an SMS, while
for non-converters it was sending an email. These are
some examples of observed behavior.
After cleaning the data and segmenting it into
groups, the score could be defined in the Lead Scoring
stage of the process. For this end, it was necessary to
choose an appropriate Machine Learning (ML) model
for the database in use, which was the Logistic Re-
gression. The choice was made due to simplicity of
application and the success stories observed in simi-
lar situations and reported in the literature (Jadli et al.,
2022) (Yadavilli and Seshadri, 2021). The module
used to build the model was Logistic Regression from
the library Scikit-learn (Scikit-learn, 2024b).
For model training, the dataset was divided into
two sets: training data (70%) and test data (30%). Af-
ter evaluating the first training results, it was observed
that the excess of variables to be analyzed harmed the
results. Therefore, the tool Recursive Feature Elim-
ination (RFE) (Scikit-learn, 2024c) was used to as-
sist in the choice of the most important variables for
defining the final model, with the 15 best classified by
the method being chosen. As a last step, the p-valor
was analyzed and those attributes that had a p-valor
> 0.05 were eliminated.
The results obtained when we applied the model
to the test data revealed an excellent specificity of
ICEIS 2025 - 27th International Conference on Enterprise Information Systems
460

96.38%, meaning that the model is well tuned to cor-
rectly identify negative results and avoid false posi-
tives. Also, the model reaches a good accuracy of
84.9%, which indicates that it performs well in gen-
eral in correctly predicting the results, suggesting that
the model is well adjusted without signs of overfitting.
However, the sensitivity of 66.96% indicates that the
model can detect positive cases in a large proportion,
but not in an excellent way, that is, the model may still
be missing a considerable amount of positives (false
negatives).
So, the model presented solid performance with
high accuracy and specificity, in addition to maintain-
ing a low false positive rate. However, the sensitiv-
ity and the negative predictive value indicate that the
model can improve in detecting true positives. For
the context of this application, we understand that the
calibration stage can adjust the efficiency of the final
score.
4.2 Lead Score Calibration
In this stage of the research, a calibration (Figure
2) layer was developed for calculation of the Lead
Score, aimed at improving accuracy by incorporating
sentiment analysis of reviews extracted from Google
Play (Google LLC, 2024a) . This layer allows for
a more refined adjustment of predictions, integrating
user feedback as an additional factor for classifying
the probability of lead conversion. Below are the
main steps of the training process:
• Data Collection. user reviews from Google Play
were extracted and analyzed, capturing the senti-
ments expressed regarding products or services;
• Sentiment Analysis. sentiment analysis was ap-
plied to the reviews, categorizing them as posi-
tive, negative, or neutral. This step utilized Nat-
ural Language Processing (NLP) techniques and
compared the models with the best performance
for this task;
• Incorporation of Sentiments into the Lead
Score. The sentiment scores from each review
were integrated into the Lead Score calculation
pipeline. This created a calibration layer that
weights the impact of these opinions on conver-
sion predictions;
• Model Training. The machine learning model
was trained using a dataset that included both tra-
ditional lead attributes (such as browsing behavior
and previous interactions) and the sentiment vari-
ables extracted from the reviews;
• Adjustment and Refinement. The calibration of
the Lead Score was adjusted based on the results
obtained in training, ensuring that user sentiment
had the appropriate weight in the final score cal-
culation;
• Validation and Evaluation. After training, this
layer was specifically added to incorporate the re-
sults of sentiment analysis, refining the lead scor-
ing process to better reflect customer sentiment.
With this approach, the Lead Score not only re-
flects the observable behavior of leads but also con-
siders the subjective perception of users expressed in
their reviews. This adds a new dimension to the scor-
ing process, enhancing the ability to predict leads with
a higher potential for conversion.
4.3 Data Collection
For the data collection stage, the library google-play-
scraper (Google LLC, 2024b) was used. This li-
brary was chosen because it abstracts the complexity
of directly accessing Google Play pages and extract-
ing data, providing a simple and efficient interface for
obtaining structured information. Additionally, it of-
fers interesting features such as filtering by language,
country, and review rating, allowing for more targeted
data collection. This level of flexibility was essen-
tial for adapting the extraction process to the specific
needs of this study, ensuring that the captured infor-
mation adequately reflected relevant user interactions
and the target audience. The ability to sort reviews by
relevance or date was also useful for prioritizing the
most representative or recent opinions, respectively.
During the data extraction process (scraping), a
total of 357,973 reviews from 94 apps across various
categories and types were collected and stored in a lo-
cal database using Microsoft SQL Server. The collec-
tion was systematic, ensuring that reviews were fully
and accurately extracted, preserving important meta-
data such as publication date, star rating, and review
content. The decision to store the data in a relational
database like SQL Server was strategic to ensure scal-
ability, security, and ease of querying, allowing for
efficient and organized analysis.
4.3.1 Implications of Data Protection in Model
Implementation
It is important to highlight that this work faced chal-
lenges related to the use of personal data, similar to
those that many companies encounter when imple-
menting artificial intelligence in their business con-
texts. The growing concern with regulatory compli-
ance, particularly regarding the protection of personal
data, requires a careful balance between innovation
and privacy.
Automatic Lead Qualification Based on Opinion Mining in CRM Projects: An Experimental Study Using Social Media
461

The General Data Protection Law (LGPD) in
Brazil and the General Data Protection Regulation
(GDPR) in Europe establish strict rules on the han-
dling of personal data, including the collection, stor-
age, and processing of sensitive information. In ac-
cordance with these regulations, organizations are re-
quired to ensure the privacy and security of data, as
well as to obtain explicit consent from users for the
use of their data for specific purposes, such as train-
ing machine learning models.
Due to the requirements imposed by these laws, it
was not possible to use a real lead database for the ex-
periments in this study. The use of personal data in an
experimental context could infringe upon data protec-
tion laws, especially considering that, in many cases,
data cannot be effectively anonymized to prevent the
identification of individuals.
Thus, to ensure compliance with legal guidelines
and mitigate the risks associated with the misuse of
personal data, we opted to use a public lead dataset
available on the Kaggle platform. This dataset was
chosen because it does not contain sensitive or iden-
tifiable information, allowing us to perform the nec-
essary simulations for the final lead score calculation
without compromising individuals privacy.
Moreover, to ensure data representativeness and
validity in the sentiment analysis process, user re-
views from Google Play were randomly associated
with the leads present in the public dataset. A ta-
ble named Lead x UserID was created in the SQL
Server database, establishing the relationship between
Google Play users and the leads from the dataset. This
approach ensured that the study followed compliance
guidelines while enabling a robust and realistic anal-
ysis of the results obtained.
4.4 Sentiment Analysis Strategies
The prediction accuracy of machine learning models
depends on the complexity of natural data and the per-
formance of the learning algorithms (Sarker, 2021).
To establish an effective machine learning model and
get better prediction accuracy, it is necessary to se-
lect a suitable algorithm based on actual problems and
then fully improve the model.
To evaluate the performance of different classi-
fication algorithms on our dataset, we trained and
tested four models: Random Forest Classifier, Sup-
port Vector Machine (with Linear Kernel), Multino-
mial Naive Bayes, and Logistic Regression. These
models were chosen because they are frequently cited
in the literature as well-suited for text classification
tasks (Cust
´
odio et al., 2020).
For this analysis, we used cross-validation on the
defined models with the scikit-learn library (Scikit-
learn, 2024a). Table 1 presents the accuracy rates
obtained for the four classification models evaluated.
Logistic Regression and Multinomial Naive Bayes
achieved the highest performance rates, with accura-
cies of 0.8970 and 0.8945, respectively.
Table 1: Training set accuracies.
Model Accuracy
RandomForestClassifier 0.6570
LinearSVC 0.8435
MultinomialNB 0.8945
LogisticRegression 0.8970
Although the difference between these two mod-
els is small, the confusion matrix analysis revealed
that Logistic Regression has a slightly lower false
positive rate, which may be crucial for our applica-
tion, where accurately identifying positive opinions is
a priority. Additionally, Logistic Regression provides
a more intuitive interpretation of coefficients, facili-
tating the analysis of each feature’s importance in the
classification.
The results obtained reinforce findings from previ-
ous literature which highlight the advantages of using
Logistic Regression for sentiment analysis and text
classification (Mandloi and Patel, 2020; Jadli et al.,
2022). Therefore, for this data, Logistic Regression
model is the best model among the tested ones.
During the development of this research, Chat-
GPT was launched, a deep learning-based language
model from OpenAI (OpenAI, 2024). The emergence
of this new tool represented a promising opportunity
for the field of Natural Language Processing, prompt-
ing us to consider its inclusion for comparing its per-
formance with the previously chosen model.
Thus, we conducted a performance comparison
between ChatGPT and logistic regression in the con-
text of sentiment analysis. Using the ChatGPT API,
we implemented automatic classification of the re-
views and developed Python code to format the data,
ensuring an organized and standardized input. The
primary goal of this analysis was to determine which
model performs better in categorizing the sentiments
of the reviews.
The results obtained are described below:
• Accuracy:
– ChatGPT. Achieved an accuracy of 0.8466,
meaning the model correctly classified 84.66%
of the cases.
– Logistic Regression. Slightly higher accuracy
at 0.8566, indicating 85.66% correct classifica-
tions.
ICEIS 2025 - 27th International Conference on Enterprise Information Systems
462

• Precision:
– ChatGPT. Precision was 0.8822, showing that
out of all instances predicted as positive,
88.22% were actually positive.
– Logistic Regression. A very similar precision
of 0.8821, meaning 88.21% of the predicted
positives were correct.
• Specificity:
– ChatGPT. The model’s specificity was 0.9301,
which reflects its ability to correctly identify
93.01% of the true negatives (i.e., how well it
avoids false positives).
– Logistic Regression. Slightly lower speci-
ficity at 0.9274, indicating it correctly classified
92.74% of the true negatives.
• Sensitivity (Recall):
– ChatGPT. Sensitivity (or recall) was 0.7302,
meaning it identified 73.02% of the actual pos-
itives.
– Logistic Regression. Higher recall of 0.7579,
detecting 75.79% of the actual positives.
• F1 Score:
– ChatGPT. The F1 score was 0.7991, which is
the harmonic mean of precision and recall, re-
flecting a balance between these two metrics.
– Logistic Regression. A slightly better F1 score
at 0.8153, showing it performs better overall in
balancing precision and recall.
In this context, ChatGPT is a slightly better model
in terms of precision, indicating that it is a bit more
effective at avoiding false positives. However, it has
slightly lower sensitivity, which means it may be less
effective at identifying all true positives.
Logistic Regression shows an overall advantage
in terms of accuracy, sensitivity, and F1-Score. This
suggests that, for this dataset, Logistic Regression of-
fers a slightly better balance (better results) between
avoiding errors and capturing all positive cases.
Both models exhibit similar performances, as il-
lustrated by the ROC curve in Figure 3. The ROC
(Receiver Operating Characteristic) curve visually
compares the trade-off between the true positive rate
(sensitivity) and the false positive rate (specificity)
for different threshold values. However, Logistic Re-
gression might be preferred in scenarios where cap-
turing as many true positives as possible is crucial,
due to its higher sensitivity. On the other hand, Chat-
GPT may be a better choice in situations where pre-
cision—minimizing false positives—is more critical,
as indicated by its position on the ROC curve.
Figure 3: ROC Curve Logistic Regression vs ChatGPT.
Therefore, for the application in this project and
with this specific dataset, Logistic Regression is the
most suitable model.
4.5 Final Lead Score Calculation with
Calibration Step
The calculation of the final lead score combines sev-
eral aspects of a lead’s potential to convert into a cus-
tomer. This process leverages historical data, prede-
fined corporate criteria, and sentiment analysis to cre-
ate a comprehensive score. Here’s a detailed expla-
nation of each component and how they contribute to
the final score:
• Historical Lead Score (LS
h
). This score is de-
rived from the lead’s past interactions with the
company. It reflects behaviors such as previ-
ous purchases, engagement with marketing cam-
paigns, website visits, and responses to communi-
cations.
If a lead has engaged with emails frequently,
visited product pages, and made inquiries, they
would have a higher historical lead score (e.g.,
LS
h
= 80 out of 100). Conversely, a lead with
minimal interaction would have a lower score
(e.g., LS
h
= 30);
• Corporate Lead Score (LS
c
). This score is deter-
mined by the company based on the lead’s charac-
teristics and how well they fit the target audience
profile. This could include factors like industry,
company size, location, or demographic informa-
tion.
A lead from a target industry with a high potential
for conversion might receive a higher corporate
lead score (e.g., LS
c
= 70). A lead from a non-
target industry might receive a lower score (e.g.,
LS
c
= 40);
• Sentiment Lead Score (LS
s
). This score is de-
rived from sentiment analysis of the lead’s feed-
back, reviews, or interactions with the company.
It assesses the lead’s feelings towards the brand,
which can significantly influence their likelihood
to convert.
If sentiment analysis of the lead’s interactions in-
dicates a positive sentiment (e.g., through positive
Automatic Lead Qualification Based on Opinion Mining in CRM Projects: An Experimental Study Using Social Media
463
comments or high ratings), they would receive a
higher sentiment lead score (e.g., LS
s
= 1.2). In
contrast, negative sentiment would lead to a lower
score (e.g., LS
s
= 0.8);
Final Lead Score Calculation. This work proposes
the calculation of the final lead score using a com-
bination of key parameters, as described in Equation
1. The calculation considers the lead’s historical in-
teractions with the company (LS
h
), the alignment of
the lead’s profile with corporate criteria (LS
c
), and the
sentiment expressed by the lead towards the company
(LS
s
). The formula integrates these elements to pro-
vide a comprehensive score:
LS
final
= (LS
h
+ LS
c
) × L S
s
(1)
Calculation Example 1. Let’s consider a hypotheti-
cal lead with the following scores:
• Historical Lead Score (LS
h
): 80
• Corporate Lead Score (LS
c
): 70
• Sentiment Lead Score (LS
s
): 1.2 (positive senti-
ment)
Using the Equation 1:
LS
final
= (80 + 70) × 1.2 = 150 × 1.2 = 180 (2)
In this case, the final lead score would be 180.
This score indicates a strong potential for conversion,
helping the sales team prioritize this lead over others
with lower scores.
Calculation - Example 2. Now, let’s consider a dif-
ferent lead:
• Historical Lead Score (LS
h
): 30
• Corporate Lead Score (LS
c
): 40
• Sentiment Lead Score (LS
s
): 0.8 (negative senti-
ment)
Calculating the final lead score:
LS
final
= (30 + 40) × 0.8 = 70 × 0.8 = 56 (3)
In this example, the final lead score is 56, suggest-
ing a lower likelihood of conversion, which would
prompt the sales team to focus on leads with higher
scores.
4.6 Final Training and Results
For the final training, the Logistic Regression model
was used for sentiment analysis on the textual re-
views, with the data split into 70% for training and
30% for testing and validation. A new column called
”sentiment” was created based on the star ratings, cat-
egorizing them as ”positive” (4-5 stars) or ”negative”
(1-3 stars) through Python functions. After this, the
tokenization process was carried out using BERTim-
bau, and the tokens were converted into NumPy ar-
rays for use in scikit-learn.
To enhance the analysis, the TF-IDF technique
was applied. It calculates the product of Term Fre-
quency and Inverse Document Frequency, normaliz-
ing word counts and weighing the relevance of terms
in each review. With the model adjusted, the training
was executed, yielding the following results:
• Accuracy: 89.23%
• Precision: 90.86%
• Specificity: 95.52%
• Sensitivity: 79.06%
• F1 Score: 83.98%
These metrics demonstrate the efficiency of the
model in predicting sentiment from textual reviews.
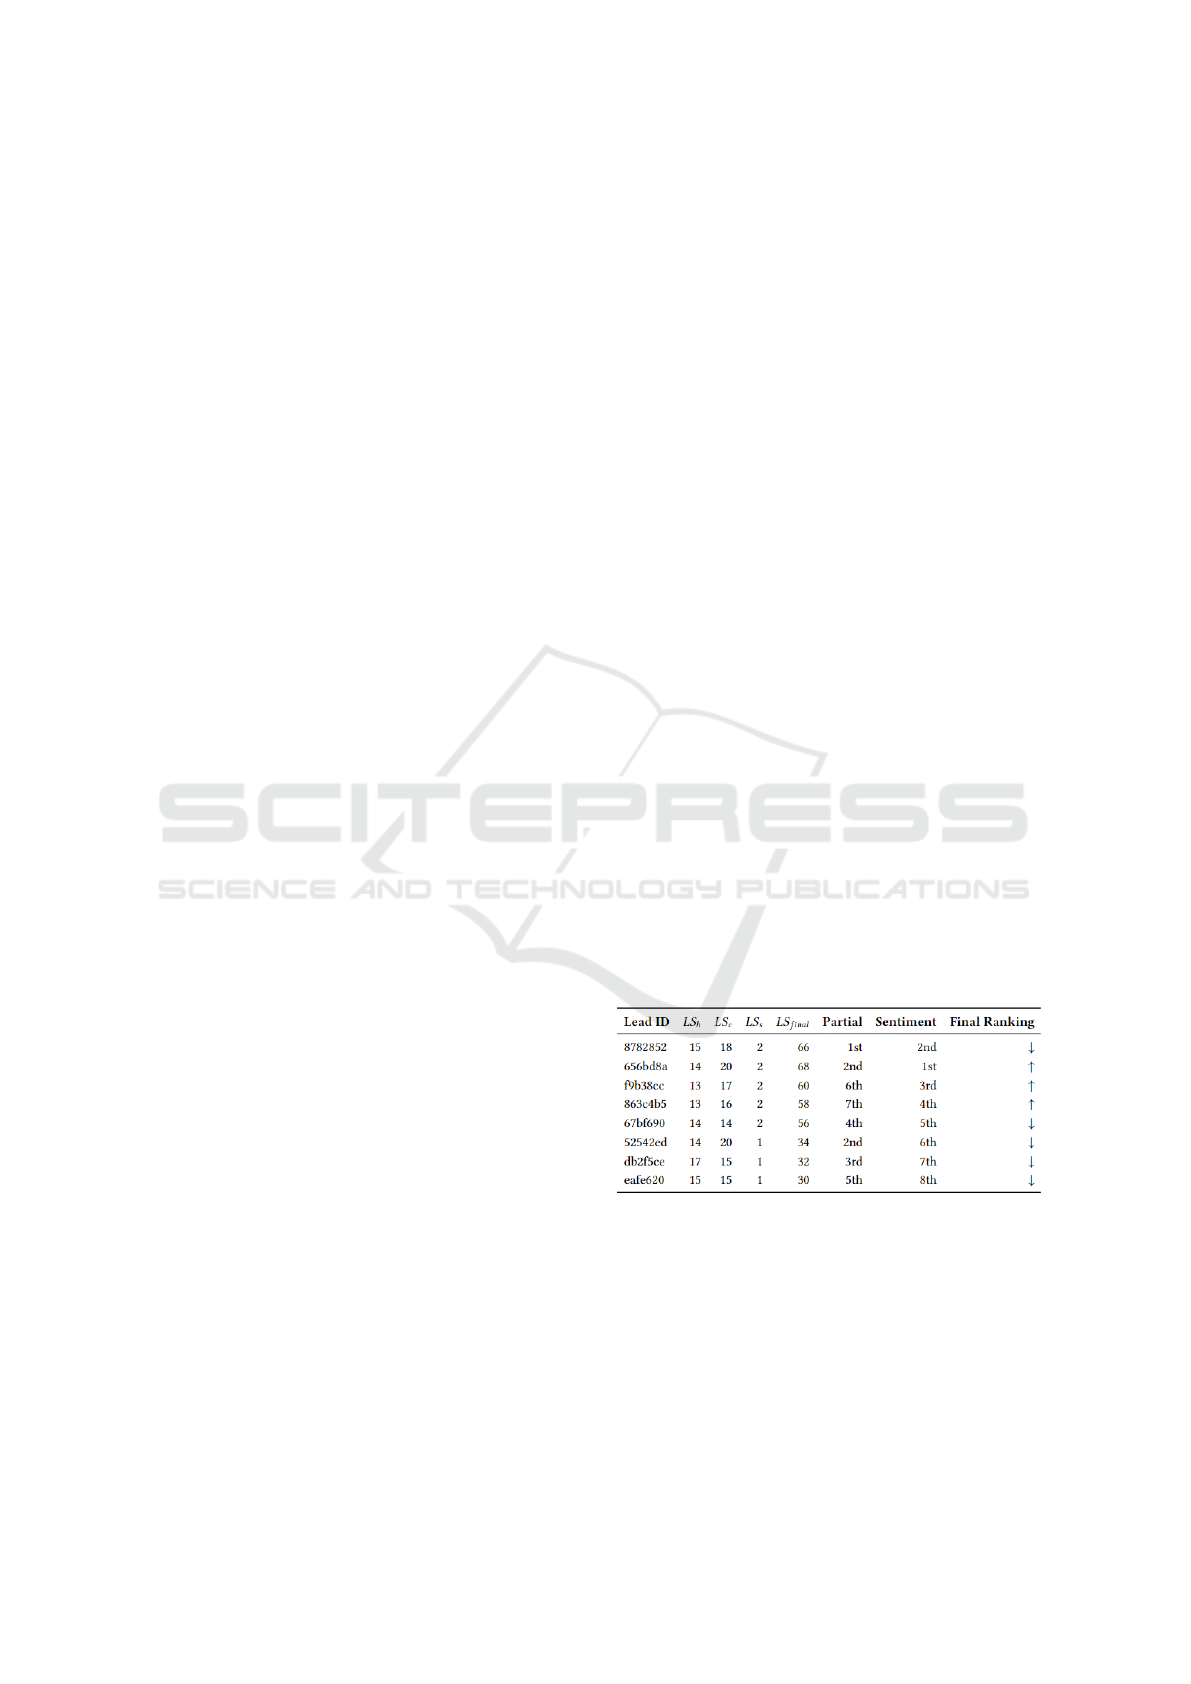
Figure 4 illustrates an example of the final lead
score calculation, based on Equation 1, which was
simplified through the assignment of weights in sen-
timent analysis. In this example, positive sentiments
are assigned a weight of 2, while negative sentiments
receive a weight of 1. The columns ”Partial” and
”Sentiment” display the partial ranking and the rel-
ative position of each lead.
Figure 4: Comparative Lead Score Calculation.
In this example, the lead identified as 656bd8a has
a final lead score of 68, initially ranking 2nd in the
partial classification. However, due to a stronger sen-
timent score, where it is ranked 1st in sentiment, it
moved up to 1st position in the Final Ranking.
Conversely, the lead 8782852, which initially held
the 1st position in the partial ranking, fell to 2nd place
in the Final Ranking due to a less favorable sentiment
score, remaining 2nd in this metric.
ICEIS 2025 - 27th International Conference on Enterprise Information Systems
464

In this context, it is possible to highlight how dif-
ferent factors, such as history, behavior, and senti-
ment, directly influence the final ranking of each lead,
allowing a more detailed analysis for strategic priori-
tization decisions.
5 CONCLUSIONS
This study demonstrated that by incorporating user
feedback alongside historical data and company-
defined scores, the proposed model provided a more
comprehensive and accurate prediction of lead con-
version potential.
The results indicate that sentiment analysis sub-
stantially improved the calibration of the final score,
capturing not only the objective behavior of leads but
also users’ subjective perception of the brand, prod-
uct, or service. This approach enables companies to
prioritize leads with a higher likelihood of conversion
more effectively, representing a competitive advan-
tage in an increasingly data-driven marketing environ-
ment.
However, challenges and opportunities for future
research remain. A relevant improvement would be to
expand the dataset to include more extensive and di-
verse sources of social media reviews, which could
enhance the model’s generalization across different
sectors. Additionally, testing other deep learning ar-
chitectures may further increase the accuracy of senti-
ment analysis and lead scoring. Moreover, enhancing
real-time sentiment analysis and integrating it more
seamlessly with CRM systems could provide action-
able insights for sales and marketing teams, enabling
quicker responses and more personalized engagement
with potential customers.
In summary, the incorporation of sentiment analy-
sis into lead scoring models represents a significant
advancement in optimizing lead management pro-
cesses. By refining the way companies assess and pri-
oritize potential customers, this approach has the po-
tential to increase conversion rates and support more
targeted and effective marketing strategies.
ACKNOWLEDGEMENTS
This work was financed by CAPES - Coord. de
Aperfeic¸oamento de Pessoal de N
´
ıvel Superior -
Brasil, finance code 001. Also, it was supported by
the PPGT/FT - UNICAMP.
REFERENCES
Benhaddou, Y. and Leray, P. (2017). Customer relation-
ship management and small data — application of
bayesian network elicitation techniques for building
a lead scoring model. In 2017 IEEE/ACS 14th Inter-
national Conference on Computer Systems and Appli-
cations (AICCSA).
Cardoso, B. and Pereira, D. (2020). Evaluating an aspect ex-
traction method for opinion mining in the portuguese
language. In Symposium on Knowledge Discovery,
Mining and Learning (KDMILE).
Cust
´
odio, J., Costa, C. J., and Carvalho, J. P. (2020). Suc-
cess prediction of leads – a machine learning ap-
proach. In 2020 15th Iberian Conference on Infor-
mation Systems and Technologies (CISTI).
Feizollah, A., Ainin, S., Anuar, N. B., Abdullah, N. A. B.,
and Hazim, M. (2019). Halal products on twitter: Data
extraction and sentiment analysis using stack of deep
learning algorithms. IEEE Access, 7:83354–83362.
Google LLC (2024a). Google play. Acesso em: 12 out.
2024.
Google LLC (2024b). Google play. Acesso em: 12 out.
2024.
Jadli, A., Hamim, M., Hain, M., and Hasbaoui, A. (2022).
Toward a smart lead scoring system using machine
learning. Indian Journal of Computer Science and En-
gineering (IJCSE), 13(2):433–443.
Kaggle (2024). Dataset. Acesso em: 12 out. 2024.
Koschnick, W. (1995). Dictionary of Marketing. Gower
Pub Co.
Kotler, P., Kartajaya, H., and Setiawan, I. (2017). Marketing
4.0—Moving from Traditional to Digital. John Wiley
and Sons.
Kotler, P., Kartajaya, H., and Setiawan, I. (2021). Marketing
5.0: Technology for Humanity. John Wiley and Sons.
Kotler, P. and Keller, K. (2012). Marketing Management -
14th Edition. Pearson Education Inc., Prentice Hall.
Mandloi, L. and Patel, R. (2020). Twitter sentiments analy-
sis using machine learning methods. In 2020 Interna-
tional Conference for Emerging Technology (INCET).
Mitchell, T. (1997). Machine Learning. McGraw-Hill, Ale-
manha.
Nilpao, P., Nanta, N., Suetrong, N., and Promsuk, N.
(2022). Development of the recommended coffee
shops application based twitter sentiment analysis. In
2022 37th International Technical Conference on Cir-
cuits/Systems, Computers and Communications (ITC-
CSCC).
OpenAI (2024). Ask chatgpt anything. Acesso em: 12 out.
2024.
Sarker, I. H. (2021). Machine learning: Algorithms, real-
world applications and research directions. SN Com-
put. Sci., 2(3).
Scikit-learn (2024a). Cross-validation: evaluating estimator
performance. Acesso em: 12 out. 2024.
Scikit-learn (2024b). Machine learning in python. Acesso
em: 12 out. 2024.
Automatic Lead Qualification Based on Opinion Mining in CRM Projects: An Experimental Study Using Social Media
465

Scikit-learn (2024c). Rfe. Acesso em: 12 out. 2024.
Skiena, S. S. (2017). The Data Science Design Manual.
Springer, Suic¸a.
Souza, F., Nogueira, R., and Lotufo, R. (2020). Bertim-
bau: Pretrained bert models for brazilian portuguese.
In In: Cerri, R., Prati, R.C. (eds) Intelligent Systems.
BRACIS 2020. Lecture Notes in Computer Science, vol
12319.
Yadavilli, S. and Seshadri, K. (2021). A framework for pre-
dicting item ratings based on aspect level sentiment
analysis. In 2021 International Conference on Ad-
vance Computing and Innovative Technologies in En-
gineering (ICACITE), pages 327–332.
ICEIS 2025 - 27th International Conference on Enterprise Information Systems
466
