
Optimization of Food Inputs in Restaurants in Metropolitan Lima
Through Prediction and Monitoring Based on Machine Learning
Marcos Olivos
a
, Alexandre Motta
b
and Pedro Castaneda
c
Faculty of Information Systems Engineering, Peruvian University of Applied Sciences (UPC), Lima, Peru
Keywords: Machine Learning, Prediction, Restaurants, Waste Reduction, Predictive Models, Artificial Intelligence.
Abstract: This work presents the development of a web-based monitoring and prediction system designed to optimize
food supply in restaurants in Metropolitan Lima, addressing challenges such as efficient inventory
management and food waste reduction. The solution employs six Machine Learning models (Random Forest,
Gradient Boosting, Ridge Regression, Lasso Regression, Linear SVR, and Neural Network), evaluated using
accuracy metrics such as Mean Squared Error (MSE), Root Mean Squared Error (RMSE), and Mean Absolute
Error (MAE). Among the models, Gradient Boosting demonstrated the best performance, with an MSE of
0.0032, RMSE of 0.057, and MAE of 0.027, outperforming the others in terms of accuracy, including Neural
Network and Random Forest, which also offered competitive results. While the approach was developed in
the specific context of Metropolitan Lima, the applied methods and obtained results can be adapted to other
urban markets with similar dynamics, demonstrating broader applicability. This system not only promotes
more efficient and sustainable inventory planning, but also contributes to the economic growth of restaurants
by optimizing resources and improving their profitability in a highly competitive environment.
1 INTRODUCTION
This article addresses inefficient inventory
management in restaurants in Metropolitan Lima, a
problem that generates food waste and affects the
economic and environmental sustainability of these
establishments. According to the United Nations
(2019; as cited in Wu & Teng, 2022), approximately
one third of the food produced globally is wasted each
year, which equates to large-scale economic and
environmental losses, so improving accuracy in
purchasing planning is crucial.
Existing solutions to improve inventory
management in restaurants have explored various
Machine Learning techniques, showing their
potential in resource optimization. In the study
carried out by Wu and Teng (2023), a machine
learning system was implemented in a restaurant
chain in Peru, managing to reduce food waste from
200-400 kg per day to just 115 g per customer in a
standard buffet. However, despite the advances made
in the implementation of Machine Learning solutions
a
https://orcid.org/0009-0000-1745-930X
b
https://orcid.org/0009-0004-0375-2002
c
https://orcid.org/0000-0003-1865-1293
for inventory management, the adaptation of these
tools to specific contexts such as that of Metropolitan
Lima remains a challenge, mainly due to the
variability in consumption patterns and the quality of
the available data. In addition, most current models
lack mechanisms to automatically adjust and are not
designed to adapt to fluctuations in demand, which
can lead to situations of oversupply or shortage of
inputs, limiting their effectiveness in dynamic
environments.
This work proposes a web-based prediction
system adapted to local needs, which integrates not
only a single algorithm, but several Machine
Learning models. These models will be dynamically
adjusted based on consumption statistics and patterns,
allowing the system to optimally adapt to the specific
conditions of each restaurant, thus optimizing the
supply of inputs and reducing waste.
The following sections of the paper will address
the state of the art, system design, results, discussions,
conclusions, and future projections.
144
Olivos, M., Motta, A. and Castaneda, P.
Optimization of Food Inputs in Restaurants in Metropolitan Lima Through Prediction and Monitoring Based on Machine Learning.
DOI: 10.5220/0013233700003950
In Proceedings of the 15th International Conference on Cloud Computing and Services Science (CLOSER 2025), pages 144-150
ISBN: 978-989-758-747-4; ISSN: 2184-5042
Copyright © 2025 by Paper published under CC license (CC BY-NC-ND 4.0)
2 RELATED WORKS
Several studies highlight the importance of advanced
technologies in optimizing supply chains in the food
sector. Dadi et al. (2021) highlights the use of
machine learning and other digital tools to reduce
human intervention and improve accuracy in data
management, resulting in a significant reduction in
waste and optimization of response times. Along
these lines, Islam et al. (2021) present a demand
forecasting approach along with an optimization
model that increases supply chain efficiency by 15%
and reduces costs by 10%, by minimizing uncertainty
in supplier selection and order allocation. In addition,
Birkmaier et al. (2022) propose an advanced
forecasting system that reduces historical data bias by
75%, allowing for better synchronization between
supply and demand for perishable products, which
increases in-store quality and optimizes inventory
freshness. Finally, the study by Beheshti et al. (2022)
introduces a closed supply chain model in peri-urban
areas, which increases the waste collector's expected
profits by 30% and improves the profitability of the
chain through the application of recycling techniques
and flexibility contracts.
On the other hand, reducing waste in the food
supply chain has been a key objective in several
recent studies. Birkmaier et al. (2022) show that an
advanced forecasting system can prevent waste
generation by optimizing the synchronization
between supply and demand, which considerably
reduces the volume of discarded food. Sharma et al.
(2022) integrates smart devices such as the e-nose, e-
eye, and e-tongue to monitor food quality in real time,
achieving a 30% decrease in food waste thanks to the
implementation of this technology. Meanwhile,
Herron et al. (2022) implement a "First Expire, First
Out" (FEFO) management model to reduce losses in
the retail trade of perishable products, showing that
after 8 hours at more than 4°C, the risk of loss of
product shelf life increases by 43.8%. Similarly,
Kumar (2023) implements machine learning to
improve the accuracy of demand prediction, which
allows reducing food waste, with a decrease in
prediction error, achieving an RMSE of 18.83 and an
MAE of 14.18 in his predictions.
Furthermore, advances in demand prediction
techniques have proven to be essential for effective
inventory management in the food sector, allowing
companies to anticipate supply needs and adjust their
strategies. Posch et al. (2022) employ Bayesian
modeling methods and generalized additive models
(GAMs), achieving a mean absolute error (MAD) of
2.681 and a root mean square error (MSE) of 14.133
in predicting food and beverage sales in restaurants,
which is significantly higher than traditional
approaches. Likewise, Migueis et al. (2022) use long-
term memory neural networks (LSTM) to forecast
demand for fresh fish, achieving an RMSE of 27.82
and a MAE of 20.63, which reduces inventory
buildup and improves accuracy in stock levels.
Finally, the study by Makridis et al. (2023)
implements a prediction system for food safety using
time series and NLP, achieving a mean square error
(MSE) of 0.922 in predicting food recalls, thus
optimizing food safety and inventory management.
By synthesizing these findings, this work
underscores the importance of integrating advanced
forecasting systems, waste reduction strategies, and
demand prediction techniques to develop a
comprehensive and adaptive solution for inventory
management. Unlike previous approaches, which
often focus on isolated elements or specific contexts,
this research combines multiple machine learning
models into a unified framework that allows for
dynamic adjustments to varying conditions.
3 SYSTEM DESIGN
3.1 Architecture
The logical architecture of the web system has been
designed to optimize the prediction and monitoring of
the supply of inputs in restaurants in Metropolitan
Lima.
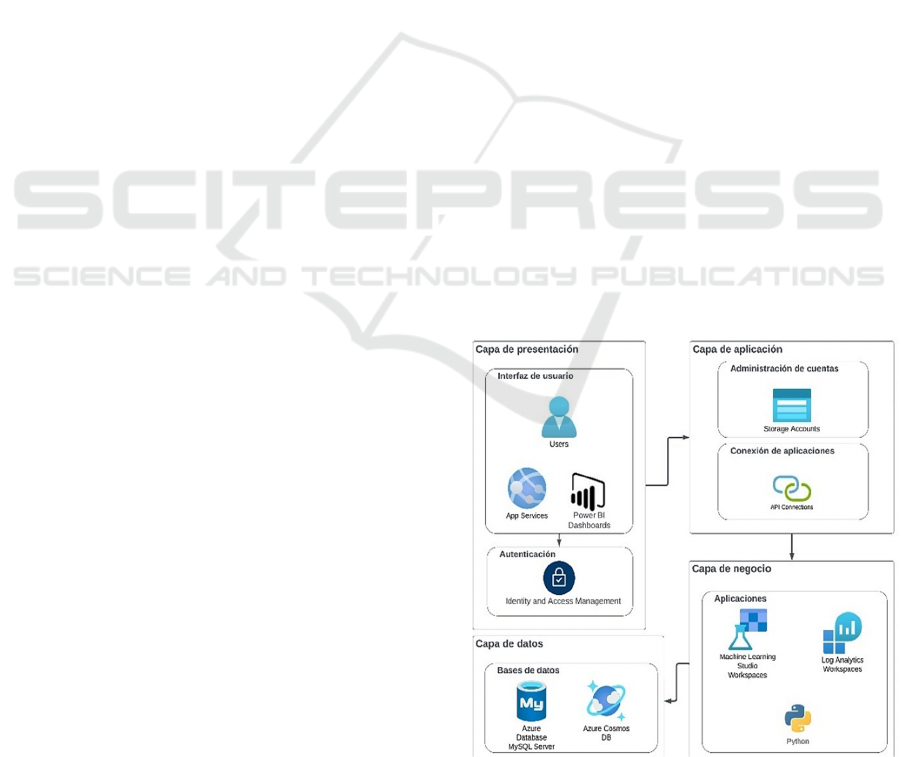
Figure 1: Logical architecture of the web system.
Optimization of Food Inputs in Restaurants in Metropolitan Lima Through Prediction and Monitoring Based on Machine Learning
145

Figure 1 explains that the solution effectively
integrates advanced technologies such as Machine
Learning, Python, and Azure cloud platforms,
strategically distributed across four layers:
Presentation, Application, Business, and Data. On the
other hand, with the implemented machine learning
algorithms, the system allows an accurate prediction
of demand, which contributes to improving inventory
planning and reducing the loss of inputs. In addition,
the platform offers an interface accessible from web
and mobile devices, supported by Power BI for the
visualization of data in real time, which facilitates
continuous and detailed monitoring. In the backend,
processes are automated, and alerts are implemented
that simplify data-driven decision making. Finally,
the infrastructure has been designed to be scalable
and adaptable to the changing needs of the restaurant
sector, ensuring efficient and sustainable
management of food inputs.
3.1.1 Presentation Layer
The presentation layer is designed to offer an
accessible and dynamic user experience through
Azure App Services. Users interact with the
application from this interface, which can be either a
web app or a mobile app. In addition, dashboards
generated by Power BI are integrated into this layer,
providing interactive visualizations and detailed
reports on system performance, based on information
stored in databases. This layer allows users to manage
the system and visualize data efficiently and securely.
3.1.2 Application Layer
The application layer acts as an intermediary between
the presentation and business/data layers. It ensures
that user requests are handled correctly. In this layer,
APIs are controlled to handle requests to the database
and other external services. Storage Accounts provide
secure storage of files and documents that may be
required for the application, while API Connections
allow integration with other external services, such as
payment gateways or authentication services.
3.1.3 Business Layer
In this layer, data is processed and business rules that
define the application logic are executed. Data
processing is done using Python, which also handles
predictions and advanced calculations using machine
learning algorithms. To ensure robust processing,
platforms such as Machine Learning Studio
Workspaces are integrated, which allows prediction
models to be trained and deployed. In addition, the
application status is continuously monitored using
Log Analytics Workspaces to ensure performance
and detect any possible anomalies or errors.
3.1.4 Data Layer
The data layer stores all the information necessary for
system operation, including user configurations,
roles, transactions, and historical records. Azure
Cosmos DB provides a highly scalable system for
managing non-relational data and real-time data,
while Azure Database MySQL Server manages
structured relational data. Data is synchronized and
analyzed to generate reports in Power BI, which
connects to dashboards and provides key
visualizations for administrators.
3.2 Methodology
3.2.1 Dataset
The dataset initially consisted of synthetic data
created to simulate typical restaurant sales patterns,
sourced from publicly available information, industry
reports, and general sales trends. This synthetic data
included daily sales figures, types of dishes sold,
preparation times, and inventory management details,
providing a foundation for testing and refining the
initial machine learning models. Once the initial
model was developed, it was validated with real data
extracted from the sales and inventory systems of a
restaurant. The real dataset spans a full year and
incorporates both seasonal trends and variations in
demand, offering a more accurate representation of
the restaurant’s operations. This combination of
synthetic and real data allowed for a thorough
evaluation of the system's ability to adapt to actual
conditions, enhancing the reliability of the results and
ensuring that the model could effectively optimize
inventory management and reduce food waste in a
real-world setting.
3.2.2 Model
The model implemented for the prediction and
monitoring of food supply in restaurants in
Metropolitan Lima is based on a machine learning
approach that integrates various algorithms to
maximize the accuracy of the predictions. This
framework follows a data flow that ranges from the
initial collection of information to the visualization of
results in real time.
In this context, data preprocessing plays a crucial
role, as it ensures the quality of the information used
for model training. This process involves data
CLOSER 2025 - 15th International Conference on Cloud Computing and Services Science
146
cleaning, which removes duplicate entries and
corrects errors, as well as normalizing values and
transforming categorical variables into numerical
ones.
3.2.3 Indicators
The success indicators used in evaluating model
accuracy are based on common prediction error
metrics, each with its own particular characteristics.
Table 1 below describes the indicators that will be
used to evaluate the system's performance and its
effectiveness in predicting and monitoring the supply
of inputs in restaurants. These metrics are essential to
ensure that the system meets the established
objectives and can make adjustments in real time
based on the results obtained.
Table 1: List of indicators to assess the accuracy of the
prediction.
Metrics Description Equation
Mean
Squared
Error
(MSE)
Calculates the average of
the squared errors
between the predicted
values and the actual
values. It penalizes large
errors, useful for normal
distributions. (IBM, 2024)
𝑀𝑆𝐸
1
𝑛
𝑦
𝑦
Root
Mean
Squared
Error
(RMSE)
It is the square root of the
MSE, representing the
errors in the same units as
the predicted values. It
facilitates interpretation
by users. (IBM, 2024)
𝑅𝑀𝑆𝐸
∑
𝑦
𝑦
𝑁𝑃
Mean
Absolute
Error
(MAE)
Calculates the average of
the absolute differences
between predicted and
actual values, without
giving extra weight to
large errors. (IBM
Cognos, 2024)
𝑀𝐴𝐸
1
𝑛
𝑌
𝑌
3.2.4 Training
To begin training the model, extensive data
preprocessing was performed, including cleaning,
normalization, and transforming categorical variables
into numerical ones, ensuring that the model could
optimally learn from the information provided. In
addition, several machine learning algorithms were
implemented, including Random Forest, Gradient
Boosting, Ridge Regression, Lasso Regression,
Linear SVR, and neural networks (MLP).
Finally, the performance of each model was
evaluated using metrics such as Mean Squared Error
(MSE), Root Mean Squared Error (RMSE) and Mean
Absolute Error (MAE), which allowed comparing
and selecting the most efficient model for predicting
food input demand. This comprehensive approach not
only optimizes the Machine Learning model, but also
contributes to more effective supply management in
the restaurant.
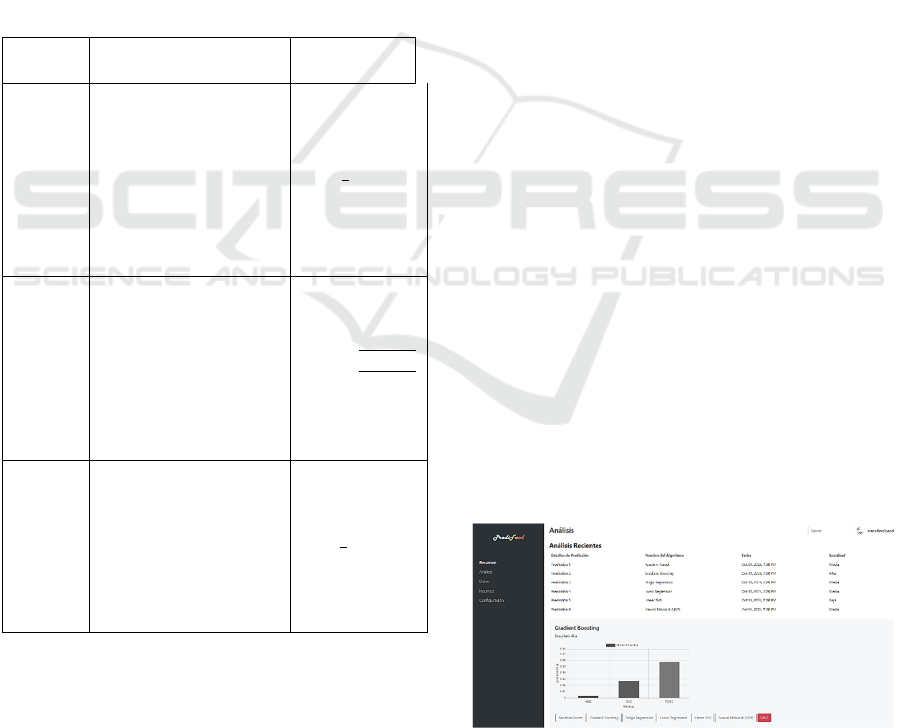
3.2.5 Interfaces
The web-based prediction and monitoring system
interface, developed in Azure, offers an intuitive and
dynamic environment designed to optimize workflow
and usability. Users can interact with dashboards
displaying key data such as supply levels,
consumption trends, and demand forecasts. These
visualizations provide a clear overview, helping users
make informed decisions about inventory and
procurement. A key feature is the Machine Learning
algorithm module, which shows performance metrics
and enables users to assess prediction accuracy. As
new data is added, the system automatically compares
the updated predictions, allowing users to adjust
parameters and improve future forecasts.
The interface also includes an alert system that
notifies users if discrepancies are detected between
the model’s predictions and the incoming data,
signaling when adjustments may be needed. This
allows for timely intervention and ensures more
accurate predictions. Additionally, the system is
flexible and customizable, adapting to specific
restaurant needs and evolving demand patterns.
Accessible across a range of devices, the interface
provides a scalable solution for efficient inventory
management and waste reduction.
Figure 2: Summary of prediction percentages with machine
learning.
Optimization of Food Inputs in Restaurants in Metropolitan Lima Through Prediction and Monitoring Based on Machine Learning
147
4 RESULTS
This section shows the results obtained by evaluating
six selected Machine Learning models: Random
Forest, Gradient Boosting, Ridge Regression, Lasso
Regression, Linear SVR, and Neural Network (MLP).
These models were trained and evaluated to predict
inventory demand in restaurants, seeking to reduce
food waste and optimize purchase planning. The
evaluation metrics used include the Mean Squared
Error (MSE), Root Mean Squared Error (RMSE), and
Mean Absolute Error (MAE), which measure the
performance of each model in terms of accuracy and
adaptive capacity.
4.1 Results Table
Table 2 presents the results of the metrics for each of
the evaluated models. This table highlights the MSE,
RMSE and MAE values, which allow the error in the
predictions of each model to be quantified. These
results directly inform the prediction of ingredient
quantities needed for optimal restaurant inventory
management.
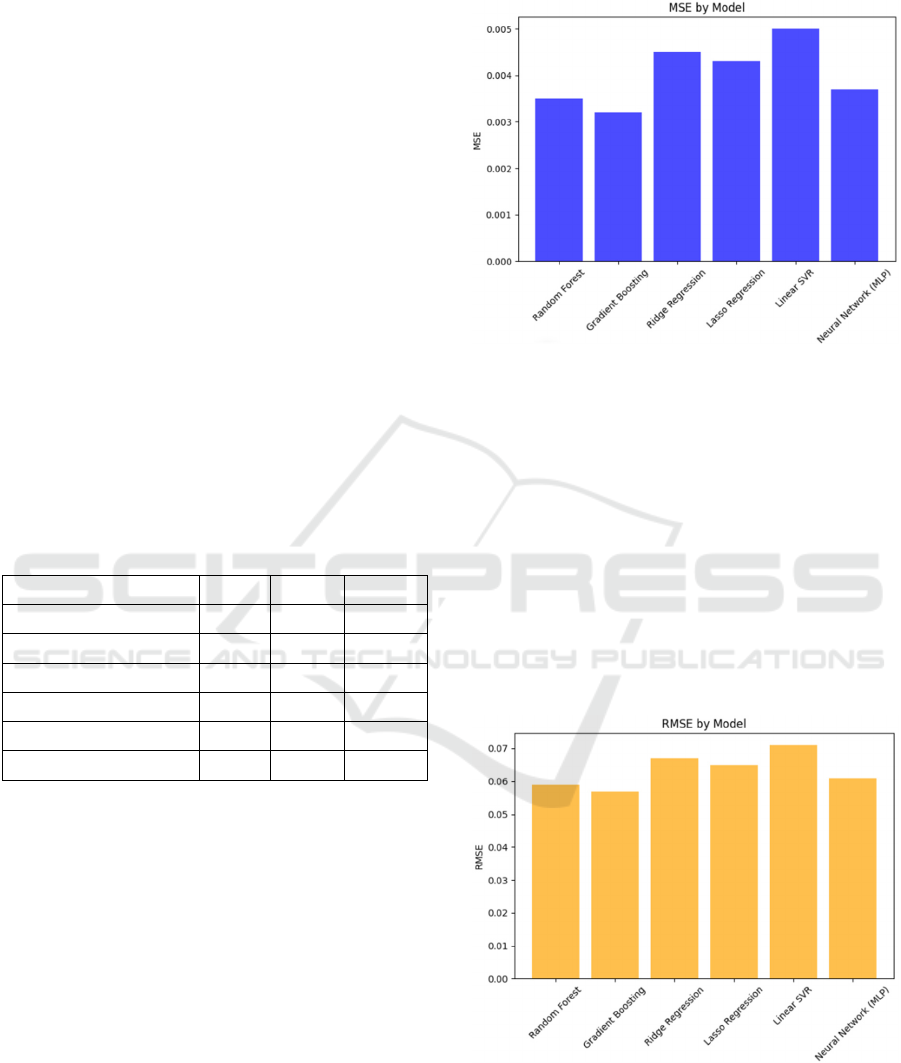
Table 2: List of results according to indicators.
Models MSE RMSE MAE
Random Forest 0.0035 0.059 0.028
Gradient Boosting 0.0032 0.057 0.027
Ridge Regression 0.0045 0.067 0.031
Lasso Regression 0.0043 0.065 0.030
Linear SVR 0.0050 0.071 0.034
Neural Network (MLP) 0.0037 0.061 0.029
The values obtained in MSE, RMSE, and MAE reveal
that the Gradient Boosting model obtained the lowest
values in all the metrics, indicating a minimum error
in the inventory demand predictions. These
percentages are instrumental in calculating the
necessary ingredients for various dishes, enabling a
more precise weekly forecast of their required
quantities. The Random Forest and Neural Network
(MLP) models also show competitive performance,
albeit with slight increases in the error metrics
compared to Gradient Boosting.
4.2 Metric Comparison Charts
To visually illustrate the performance of the models,
several graphs were generated that allow a detailed
comparison of the MSE, RMSE and MAE metrics
between the evaluated models.
4.2.1 Bar Chart for MSE
Figure 3: Comparison of Mean Squared Error (MSE)
between Models.
Figure 3 shows the mean squared error (MSE) values
for each model. This graph shows that Gradient
Boosting and Random Forest have the lowest MSE
values, suggesting a greater ability of these models to
minimize squared errors in their predictions. This
implies that compared to other models, Gradient
Boosting and Random Forest are more effective in the
accuracy of their estimates, which is crucial for
informed decision making in the context of data
analysis.
4.2.2 Bar Chart for RMSE
Figure 4: Root Mean Squared Error (RMSE) Analysis for
Prediction Accuracy.
Figure 4 presents the root mean square error (RMSE)
values, which reflect the average of the squared errors
on the same scale as the data. Gradient boosting keeps
CLOSER 2025 - 15th International Conference on Cloud Computing and Services Science
148
the RMSE lowest, making it the model with the most
accurate prediction, closely followed by random
forest and neural network (MLP).
4.2.3 Line Chart for MAE
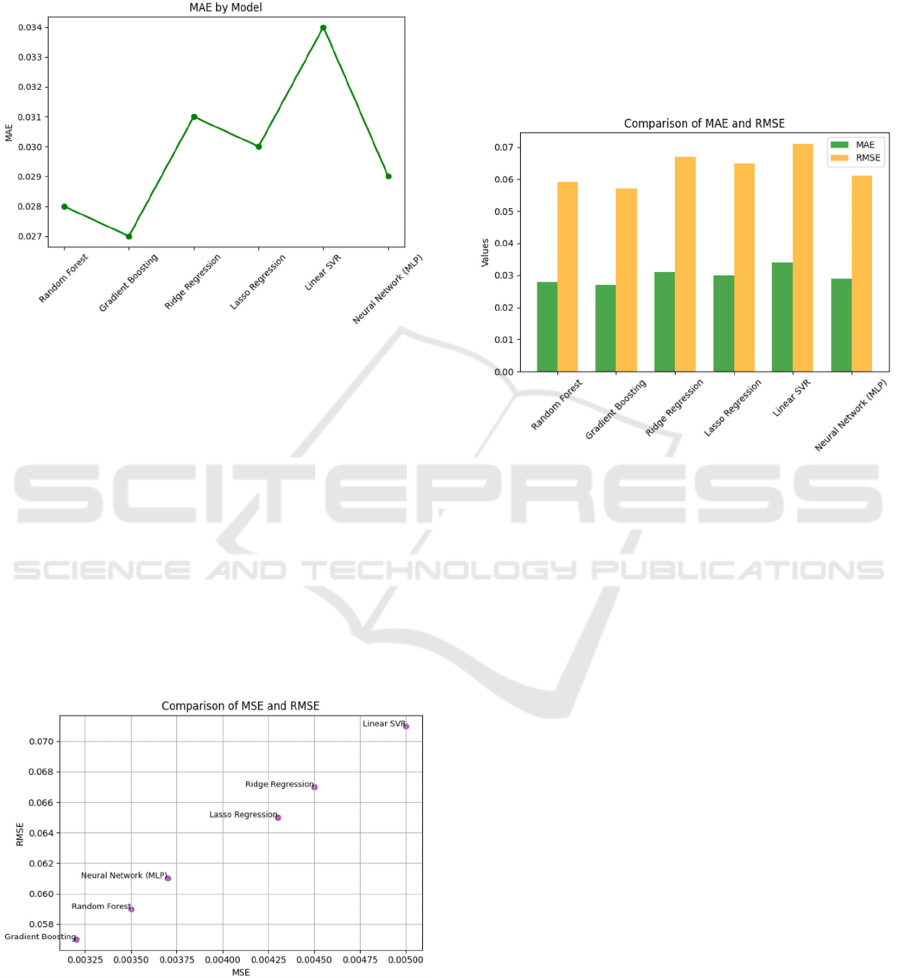
Figure 5: Mean Absolute Error (MAE) Evaluation in
Inventory Forecasting.
In Figure 5, the Mean Absolute Error (MAE) values
for each model are shown, providing a clear view of
the average absolute errors. Gradient Boosting and
Random Forest stand out again with low values,
suggesting their effectiveness in minimizing absolute
errors in inventory demand predictions. This level of
precision supports better planning for weekly
ingredient needs, helping estaurants avoid
overstocking and reducing waste.
4.2.4 Scatter Plot for Comparison of MSE
and RMSE
Figure 6: Scatter Plot: Relationship between MSE and
RMSE in Models.
Figure 6 presents a scatterplot comparing the Root
Mean Square Error (MSE) and Root Mean Square
Error (RMSE) for each model, highlighting the
relationship between these two error metrics.
Gradient Boosting and Random Forest exhibit
consistency by maintaining low values across both
metrics. This reliability in prediction accuracy further
enhances the ability to forecast ingredient
requirements efficiently, ensuring smoother
inventory management.
4.2.5 Grouped Bar Chart for MAE and
RMSE
Figure 7: Comparison of MAE and RMSE Metrics in
Evaluated Models.
Figure 7 presents a scatterplot comparing the Root
Mean Square Error (MSE) and Root Mean Square
Error (RMSE) for each model, highlighting the
relationship between these two error metrics. It is
observed that Gradient Boosting and Random Forest
maintain low values in both metrics, demonstrating
consistency in the accuracy of the predictions.
5 DISCUSSIONS
The results of this work demonstrate significant
improvements in demand prediction and inventory
management in restaurants in Metropolitan Lima,
surpassing in accuracy studies such as Kumar et al.
(2023), which achieved an RMSE of 18.83 and an
MAE of 14.18. Our system employs models such as
Gradient Boosting and Random Forest, which
automatically adjust to daily variations, optimizing
supply and reducing waste of inputs, which
distinguishes it from previous approaches, such as the
Bayesian model of Posch et al. (2022) with an MSE
of 14.133, or the system of Birkmaier et al. (2022),
which reduces historical biases in perishable data by
75% but lacks local adaptability. This solution not
Optimization of Food Inputs in Restaurants in Metropolitan Lima Through Prediction and Monitoring Based on Machine Learning
149

only contributes to existing knowledge in inventory
prediction but could also be implemented in other
food sector environments, such as hotels, where input
optimization is key to reducing costs and increasing
sustainability.
6 CONCLUSIONS
This work demonstrates the effectiveness of a
prediction and monitoring system for optimizing the
supply of inputs in restaurants in Metropolitan Lima,
achieving a significant reduction in food waste and an
improvement in inventory management. The
implementation of Machine Learning provides an
accurate estimate of demand, adapting to
consumption variations and the particularities of the
restaurant sector. The advantages of this system
include more efficient resource planning and a
positive impact on the operational and economic
sustainability of establishments. However, the
limitations of the system lie in its dependence on data
quality and its adjustment to specific patterns, which
could require further improvements to increase its
adaptability. The results can be applied to inventory
optimization in other food sectors, and future research
could integrate new data sources and improve the
automation of the system, thus increasing its impact
on the sustainability of the sector.
ACKNOWLEDGMENTS
The authors are grateful to the Dirección de
Investigación de la Universidad Peruana de Ciencias
Aplicadas for the support provided for this research
work through the economic incentive.
REFERENCES
Beheshti, S., Heydari, J., & Sazvar, Z. (2021). Food waste
recycling closed loop supply chain optimization
through renting waste recycling facilities. Sustainable
Cities And Society, 78, 103644. https://doi.org/10.1016/
j.scs.2021.103644
Birkmaier, A., Imeri, A., & Reiner, G. (2024). Improving
supply chain planning for perishable food: data-driven
implications for waste prevention. Journal Of Business
Economics, 94(6), 1-36. https://doi.org/10.1007/s11
573-024-01191-x.
Dadi, V., Nikhil, SR, Mor, RS, Agarwal, T., & Arora, S.
(2021). Agri-Food 4.0 and Innovations: Revamping the
Supply Chain Operations. Production Engineering
Archives 27 (2), 75-89. https://doi.org/10.30657/pea.20
21.27.10 .
Herron, C. B., Garner, L. J., Siddique, A., Huang, T.,
Campbell, J. C., Rao, S., & Morey, A. (2022). Building
“First Expire, First Out” models to predict food losses
at retail due to cold chain disruption in the last mile.
Frontiers In Sustainable Food Systems, 6.
https://doi.org/10.3389/fsufs.2022.1018807.
Islam, S., Amin, S., & Wardley, L. (2021). Machine
learning and optimization models for supplier selection
and order allocation planning. International Journal Of
Production Economics, 242, 108315. https://doi.org/
10.1016/j.ijpe.2021.108315 .
Kumar, I., Rawat, J., Mohd, N., & Husain, S. (2021).
Opportunities of Artificial Intelligence and Machine
Learning in the Food Industry. Journal Of Food
Quality, 2021, 1-10. https://doi.org/10.1155/2021/
4535567 .
Makridis, G., Mavrepis, P., & Kyriazis, D. (2022). A deep
learning approach using natural language processing
and time-series forecasting towards enhanced food
safety. Machine Learning, 112(4), 1287-1313.
https://doi.org/10.1007/s10994-022-06151-6.
Miguéis, V., Pereira, A., Pereira, J., & Figueira, G. (2022).
Reducing fresh fish waste while ensuring availability:
Demand forecast using censored data and machine
learning. Journal Of Cleaner Production, 359, 131852.
https://doi.org/10.1016/j.jclepro.2022.131852 .
Posch, K., Truden, C., Hungerländer, P., & Pilz, J. (2022).
A Bayesian approach for predicting food and beverage
sales in staff canteens and restaurants. International
Journal Of Forecasting, 38(1), 321-338. https://doi.org/
10.1016/j.ijforecast.2021.06.001 .
Sharma, P., Vimal, A., Vishvakarma, R., Kumar, P., De
Souza Vandenberghe, L.P., Gaur, V.K., & Varjani, S.
(2022). Deciphering the blackbox of omics approaches
and artificial intelligence in food waste transformation
and mitigation. International Journal Of Food
Microbiology, 372, 109691. https://doi.org/10.1016/j.ij
foodmicro.2022.109691 .
Wu, C. E., & Teng, C. (2022). Reducing Food Waste in
Buffet Restaurants: A Corporate Management
Approach. Foods, 12(1), 162. https://doi.org/10.3390/
foods12010162
CLOSER 2025 - 15th International Conference on Cloud Computing and Services Science
150
