
T-RAPPI: A Machine Learning Model for the Corredor
Metropolitano
Deneb Traverso
a
, Gonzalo Pacheco
b
and Pedro Castañeda
c
Faculty of Information Systems Engineering, Universidad Peruana de Ciencias Aplicadas (UPC), San Isidro, Lima, Peru
Keywords: Machine Learning, Random Forest, Mobile Application, Intelligent Transportation Systems, Public
Transportation Prediction, Smart City Technologies.
Abstract: The public transportation system in Lima, Peru, faces significant challenges, including bus shortages, long
queues, and severe traffic congestion, which diminish service quality. These issues arise from a lack of modern
management tools capable of efficiently handling the Metropolitano bus system. This paper introduces T-
RAPPI, a predictive model based on Random Forest, developed to estimate bus arrival times at Metropolitano
stations. Using historical data on bus arrivals and operational parameters, the model achieved exceptional
accuracy, with an R² score of 0.9998 and a MAPE of 0.0554%, demonstrating its robustness and ability to
minimize prediction errors. The implementation of T-RAPPI represents a substantial improvement over
existing systems, providing operators with data-driven insights to optimize route planning and bus allocation.
Additionally, the model's integration into the mobile application Metropolitano + enhances the commuting
experience by offering users real-time bus arrival predictions, reducing uncertainty and wait times. Future
extensions of this work could include incorporating real-time traffic and weather data to further enhance
prediction accuracy and expanding the model to other transit systems in Lima and beyond.
1 INTRODUCTION
Traffic congestion in Metropolitan Lima ranks among
the worst in Latin America, causing an average delay
of 24 minutes for every 10 kilometers traveled
(Gonzales, 2023). This situation worsens during peak
hours, with average travel time per kilometer
reaching 33 minutes. The public transportation
system, specifically the Metropolitano, faces various
issues, such as insufficient buses, long queues, and
disorganization at stations (Infraestructura Vial
2024). At a broader level, congestion in Latin
American cities like Bogotá, Mexico City, and Rio de
Janeiro is also affected by infrastructure and
operational factors that hinder the efficiency of public
transportation (Calatayud et al., 2021).
The lack of appropriate technological tools within
the Metropolitano limits its ability to efficiently
manage passenger flow and operations, which affects
the user experience and increases operating costs and
reduces productivity (Rivas et al., 2022).
a
https://orcid.org/0009-0008-7042-9781
b
https://orcid.org/0009-0001-7904-9434
c
https://orcid.org/0000-0003-1865-1293
Implementing technological solutions could
significantly enhance operational efficiency,
providing users with a more comfortable and reliable
service.
In this context, several Latin American capitals,
such as Bogotá and Mexico City, have implemented
advanced technologies, including mobile applications
and real-time tracking systems to efficiently manage
public transportation (Porras, 2023). Applications
like TransMilenio (Colombia) and Transantiago
(Chile) serve as established solutions in major
regional capitals. Similarly, independent applications
like Moovit provide routes for various public
transportation services in over 3,400 cities across 112
countries (Santos & Nikolaev, 2021).
Despite the success of some applications, many
existing solutions still have limitations. Applications
like Transantiago lack advanced fleet management
and user experience personalization technologies.
Others, like Moovit, do not provide real-time data
374
Traverso, D., Pacheco, G. and Castañeda, P.
T-RAPPI: A Machine Learning Model for the Corredor Metropolitano.
DOI: 10.5220/0013220700003941
In Proceedings of the 11th International Conference on Vehicle Technology and Intelligent Transport Systems (VEHITS 2025), pages 374-381
ISBN: 978-989-758-745-0; ISSN: 2184-495X
Copyright © 2025 by Paper published under CC license (CC BY-NC-ND 4.0)

with high precision, relying only on estimations. This
generates user frustration and reduces adoption.
Responding to the need for technological tools
that optimize Metropolitano's transportation service,
we developed a Machine Learning model called T-
RAPPI, based on the Random Forest technique. This
model aims to improve user experience and optimize
the operational management of the Metropolitano
system. T-RAPPI will provide estimated arrival times
for buses, trained using historical records of bus
arrivals and departures across various routes within
the Metropolitano. This will provide valuable data
both for users, who can plan their trips better, and
operators, who can optimize route planning and bus
allocation according to projected demand.
This paper covers related work in Section 2,
which laid the groundwork for our solution proposal.
Section 3 details the model's design (architecture,
dataset, indicators, and interfaces). Section 4 presents
the evaluations conducted on the solution and the
results obtained. Section 5 discusses the test results,
concluding with research findings and
acknowledgments in Sections 6 and 7.
2 RELATED WORKS
In terms of Machine Learning (ML) models used to
predict transportation demand, studies like those by
Blättler and Imhof (2023) and AlKhereibi et al.
(2023) highlight the effectiveness of the Random
Forest (RF) method in these tasks. Blättler and Imhof
employed this model to predict Demand Responsive
Transport (DRT) in rural areas of Switzerland,
utilizing variables such as population and proximity
to train stations, achieving an explanation of 25% of
the variability in services. Meanwhile, AlKhereibi et
al. used RF to predict subway demand, based on
historical and geospatial data related to land use,
achieving an R² of 98.8% and a KGE efficiency of
96.93%. Both studies underscore Random Forest's
capability to handle large volumes of data and
complex variables.
On the other hand, Graham et al. (2023) and Hu et
al. (2022) focused on using different ML techniques
to predict travel times and classify passengers.
Graham et al. compared methods like RF and Support
Vector Machines (SVM) to estimate passenger flows
and travel times, concluding that RF was the most
effective according to metrics like RMSE and MAPE.
Hu et al. used Backpropagation Neural Network
(BPNN) to classify passengers in Beijing, achieving
an accuracy of 95.4%, demonstrating ML's potential
to improve public transportation management by
identifying behavior patterns.
Regarding the prediction of occupancy and wait
times in transportation, Glück et al. (2022) and Ding
et al. (2022) presented innovative ML-based
solutions. Glück et al. used K-nearest neighbors
(KNN) to predict vehicle occupancy in real-time,
reaching an accuracy of 80% in short-term
predictions. Meanwhile, Ding et al. developed the
Du-Bus system, which estimates bus wait times
without GPS data, achieving an MAE of 0.78
minutes. Both studies highlight ML's potential to
enhance public transport user experience through
precise and real-time predictions.
Finally, Müller-Hannemann et al. (2022), Yin and
Zhang (2023), and Imoize et al. (2022) explored how
ML techniques can optimize route planning and
resource management in transport systems. The first
study utilized Support Vector Regression (SVR) to
assess the robustness of transportation schedules,
overcoming traditional simulation limitations with a
Relative Mean Error below 1%. Yin and Zhang
proposed a method to predict bus travel time based on
driver driving styles, improving predictive accuracy
by using trip histories. Lastly, Imoize et al. focused
on an adaptive traffic management system based on
IoT and ML for smart cities, which optimizes traffic
flow and reduces accidents. These studies underline
how ML can improve both planning and operational
efficiency in public transport and urban traffic.
3 SYSTEM DESIGN
3.1 Architecture
The RF T-RAPPI model will be integrated into a
mobile application called ‘Metropolitano +’, allowing
guides and users to view the model's predictions,
including upcoming bus arrivals at stations. This
application will be developed in Flutter and will be
available for mobile devices with the Android
operating system. The model’s processed data will be
managed in the cloud using Firebase services. The
structure of the application is as follows:
▪ Users: The application is designed for two
types of users: regular users and service guides.
Both will connect to the application via an
Android device with network connectivity.
▪ ‘Metropolitano +’: This application will
contain the ML model and present model-fed
reports on bus arrivals and general service
information.
T-RAPPI: A Machine Learning Model for the Corredor Metropolitano
375

▪ Flutter/Dart: These will be the framework and
language used for developing the application's
front end, targeting Android.
▪ T-RAPPI Model: The T-RAPPI model will be
integrated into the back end, processing data
stored in the database to generate predictions.
Through the construction of decision trees, the
model will deliver precise results on bus
arrivals at stations.
▪ Firebase Cloud Storage: Firebase’s cloud
database service will store application
information, including credentials and data for
various modules, as well as the datasets that
enable the T-RAPPI model to make
predictions.
▪ Firebase ML Kit: A Firebase service for ML
model development in mobile applications.
▪ Firebase Authenticator: Manages user
credentials for application access.
▪ Firebase Hosting: Manages the deployment of
the mobile application.
Figure 1: Physic Architecture of the ‘Metropolitano +’ app.
3.2 Methodology
3.2.1 Dataset
For developing the T-RAPPI model, a dataset
containing detailed information on the arrival and
departure times of Metropolitano buses at various
stations was used. This data was provided by Lima
and Callao’s Urban Transport Authority (ATU) via
their transparency portal, covering the period from
January 1, 2023, to December 31, 2023, and includes
records of scheduled bus arrival and departure times
at different stations, as well as service frequency by
line and schedule.
To ensure the data was suitable for modeling, a
thorough preprocessing pipeline was applied.
Records with missing arrival or departure times were
removed to prevent inaccuracies in predictions.
Outliers, such as extreme arrival times caused by
reporting errors or exceptional events, were identified
and excluded.
Once cleaned, the dataset was transformed to
make it suitable for the RF algorithm. Categorical
variables, including bus lines, station names, and
service types, were encoded numerically using one-
hot encoding. Numerical features, such as time
intervals and station occupancy rates, were
normalized to ensure consistent scaling, enhancing
the algorithm's ability to process the data effectively.
A temporal index was also introduced by
aggregating records based on date and time intervals.
This adjustment allowed the model to capture patterns
related to peak and off-peak hours, significantly
improving its ability to predict future events based on
historical trends.
The data was divided into two subsets for
modeling:
▪ 70% of the dataset was allocated for training,
allowing the RF algorithm to learn patterns
from historical data and develop predictive
rules based on decision tree construction.
▪ The remaining 30% was reserved as a test set
to evaluate the model's predictive ability on
unseen data. This split ensures the model
generalizes well and does not overfit the
training data. Evaluation metrics like accuracy
and MSE were used to assess its performance.
Additionally, a 5-fold cross-validation was used
for a more robust evaluation, ensuring that the
model's performance is not dependent on a single data
partition.
3.2.2 Model
The T-RAPPI model is a prediction system based on
an RF algorithm, designed to forecast bus arrival
times at Lima's Metropolitano stations. It utilizes
historical data on bus arrivals and departures, station
occupancy, and other contextual variables like traffic.
The workflow follows a structured approach,
starting with data preprocessing, feature extraction,
and model construction.
VEHITS 2025 - 11th International Conference on Vehicle Technology and Intelligent Transport Systems
376
During preprocessing, Metropolitano data is
cleaned and prepared by removing missing or
anomalous values and transforming categorical
variables into numerical ones through encoding.
Numerical features are normalized, and the data is
split into training, test, and validation sets without
mixing examples. As the dataset contains temporal
data, a temporal index is created to improve the
model’s accuracy in predicting future sequences.
The RF algorithm was chosen after conducting a
comprehensive benchmarking process involving
several predictive modeling techniques, including
Gradient Boosting Machines (GBMs), SVR, and
neural networks. RF excelled in accuracy and
robustness when handling noisy data, offered
interpretability by providing clear insights into
feature importance, and demonstrated computational
efficiency on moderate-sized datasets, making it ideal
for real-time applications. Additionally, its resistance
to overfitting and versatility in handling mixed data
types (numerical and categorical) make it the optimal
choice for predicting arrival times across diverse
operational scenarios.
3.2.3 Training
The training of the T-RAPPI model is based on the
RF algorithm, a supervised learning method that
combines the results of multiple decision trees to
improve accuracy and reduce the risk of overfitting.
In each iteration, the model selects a random subset
of features and data to train several independent
decision trees (bagging). The trees then vote on the
final prediction, making the model more robust
against errors or noise in the data.
The hyperparameters adjusted in this process
include:
• n_estimators: the number of trees in the forest.
A higher number of trees improves model
stability, although it increases computation
time.
• max_depth: the maximum depth of each tree,
controlling how extensively each tree can grow.
A very high value could lead to overfitting,
while a low value could underfit the model.
• min_samples_split: the minimum number of
samples required to split a node, which ensures
that nodes do not split when samples are
insufficient.
• max_features: The maximum number of
features selected to split at each node. This
parameter controls the randomness of the forest
and improves its generalization ability.
Regarding the computational resources used for
training, the T-RAPPI model was executed on Google
Colaboratory (free plan), which provided access to
1.5 GB of RAM (out of 12.7 GB available) and 32.5
GB of disk space (out of 107.7 GB available). During
the training process, GPUs were not used, as the free
plan was sufficient for the current scope of the
project. However, future improvements, such as
integrating real-time data or scaling the model, could
benefit from utilizing more advanced resources like
GPUs for faster processing.
To ensure the robustness and reliability of the T-
RAPPI model, a 5-fold cross-validation process is
implemented. In this technique, the dataset is divided
into five subsets, and the model is trained five times,
each time using a different subset as the test set and
the others as the training set. This process helps
prevent the model from overfitting the training data.
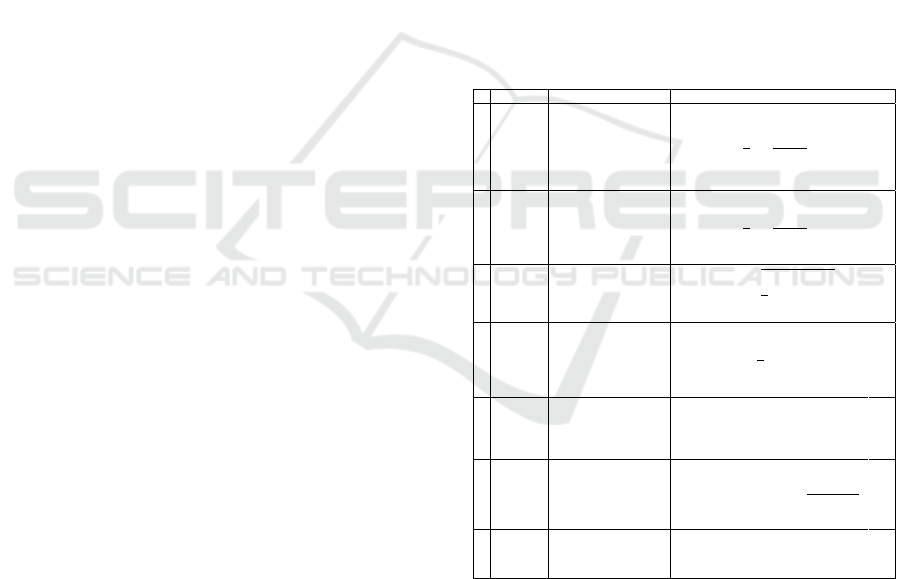
3.2.4 Evaluation and Statical Analysis
Table 1: Metrics used to evaluate the T-RAPPI model.
4 RESULTS
To model the variation in travel times within the
Metropolitano system, we used an approach based on
the RF algorithm. This model, named T-RAPPI, is
suitable for regression problems, as it is robust against
outliers and capable of capturing complex, non-linear
relationships.
# Metric Description Formule
1 MAPE
Evaluates the average
error as a percentage
between predicted and
actual values, useful for
understanding the
magnitude of relative
error.
𝑀𝐴𝑃𝐸=
1
𝑛
𝑦
𝑖
−𝑦
𝑖
𝑦
𝑖
×100
𝑛
𝑖=1
(1)
2 R
2
Measures the proportion
of variance explained by
the model, indicating
how well the model fits
the data. An R² close to 1
implies a good fit.
𝑀𝐴𝑃𝐸=
1
𝑛
𝑦
𝑖
−𝑦
𝑖
𝑦
𝑖
×100
𝑛
𝑖=1
(2)
3 RMSE
Measures the magnitude
of prediction errors,
penalizing larger errors
by squaring them.
𝑅𝑀𝑆𝐸=
1
𝑛
(𝑦
𝑖
−𝑦
𝑖
)
2
𝑛
𝑖=1
(3)
4 MAE
Is the average of absolute
errors between
predictions and actual
values. Unlike RMSE, it
does not penalize large
errors as severely.
𝑀𝐴𝐸=
1
𝑛
|
𝑦
𝑖
−𝑦
𝑖
|
𝑛
𝑖=1
(4)
5 Max Error
Measures the maximum
absolute difference
between predicted and
actual values in the
dataset.
𝑀𝑎𝑥 𝐸𝑟𝑟𝑜𝑟=max
𝑖=1
|
𝑦
𝑖
−𝑦
1
|
(5)
6
Explained
Variance
Measures the proportion
of total variance in the
data explained by the
model. A higher value
implies a better model fit.
𝐸𝑥𝑝𝑙𝑎𝑖𝑛𝑒𝑑 𝑉𝑎𝑟𝑖𝑎𝑛𝑐𝑒= 1 −
𝑉𝑎𝑟(𝑦 − 𝑦
)
𝑉𝑎𝑟(𝑦)
(6)
7
Median
Absolute
Error
Measures the median of
absolute errors between
predictions and actual
values.
𝑀𝑒𝑑𝐴𝐸= 𝑚𝑒𝑑𝑖𝑎𝑛𝑎(
|
𝑦
𝑖
−𝑦
1
|
)
(7)
T-RAPPI: A Machine Learning Model for the Corredor Metropolitano
377
The dataset used to train the T-RAPPI model
includes multiple relevant features for predicting
variation, such as variables like SERVICE, PROG.
TIME MINUTES, VISUAL OCCUPANCY, among
others. The target variable, VARIATION, was used
to assess how well the T-RAPPI model can predict
the differences between actual and scheduled times.
To evaluate T-RAPPI's effectiveness, we used the
metrics detailed in the previous section. The values
obtained are shown in Table 2.
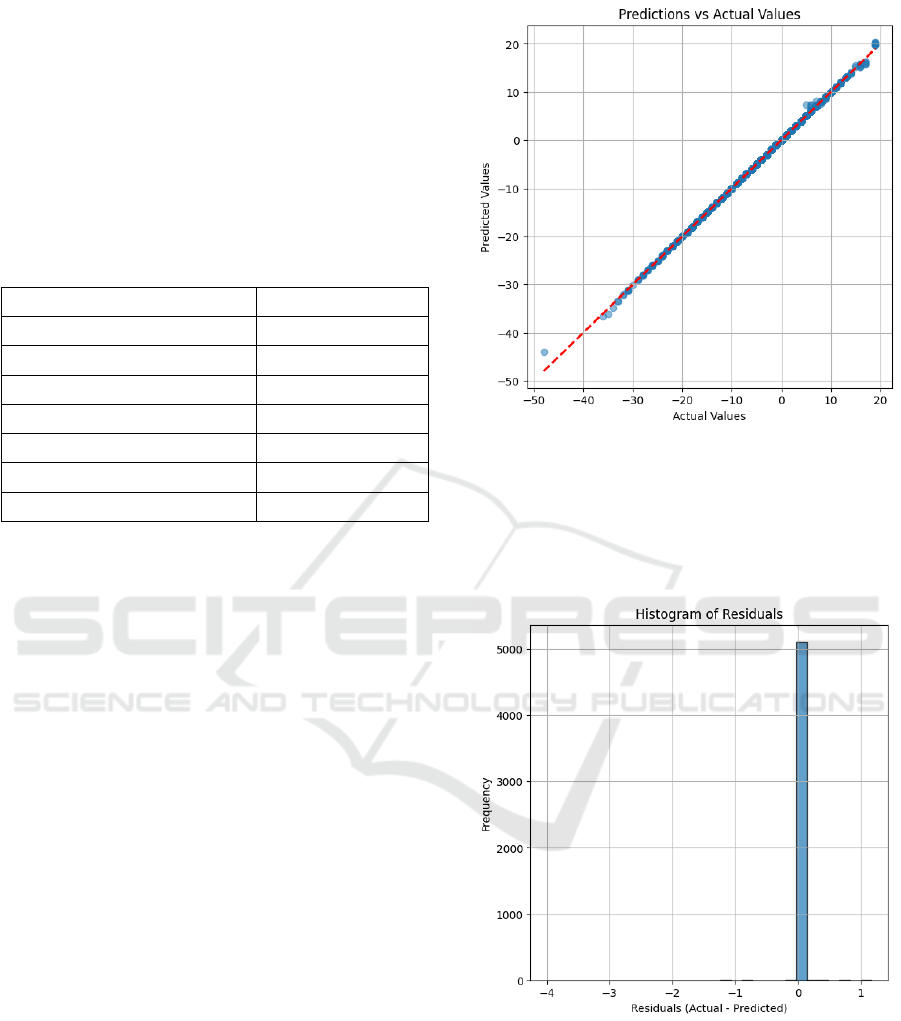
Table 2: T-RAPPI model Parameters.
Metric Value
MAE 0.0062
RMSE 0.0912
MAPE 0.0554%
R² 0.9998
Max Error 4.0
Explained Variance Score 1.0
MedAE 0.0
• The R² score of 0.9998 indicates that the model
is able to explain nearly all variability in the
data, suggesting that the predictions are
extremely accurate.
• The MAE of 0.0062 and RMSE of 0.0912
confirm that the average error in the predictions
is very low.
• The MAPE of 0.0554% indicates that the
percentage error is less than 0.1% on average, a
strong indicator of a highly accurate model.
• The Max Error of 4.0 shows that the greatest
absolute error between predictions and actual
values was 4 units, which is reasonable given
the target variable's range.
• The Explained Variance Score of 1.0 and the
Median Absolute Error of 0.0 reinforce that the
model captures nearly all information in the data
without significant errors.
4.1 Graphics
Below, we present graphs that demonstrate the
effectiveness and results of the T-RAPPI model:
Scatter Plot of Predictions vs. Actual Values: This
plot shows the relationship between the model's
predictions and the actual values. Ideally, the points
should align with the diagonal line representing a
perfect prediction. In this case, the predictions are
very close to the line, indicating a high degree of
accuracy.
Figure 2: Scatter Plot of Predictions vs. Real Values.
Error Histogram (Residuals): This plot shows the
distribution of prediction errors. The errors are
symmetrically distributed around 0, suggesting that
the model does not exhibit bias towards
overestimations or underestimations.
Figure 3: Error Histogram.
Feature Importance Chart: Highlights the most
relevant variables in the model. REFERENCE and
STATUS are the key contributors, while other
features, grouped as Other Features, showed minimal
impact on predictions. This approach simplifies
visualization and confirms the evaluation of all
variables.
VEHITS 2025 - 11th International Conference on Vehicle Technology and Intelligent Transport Systems
378
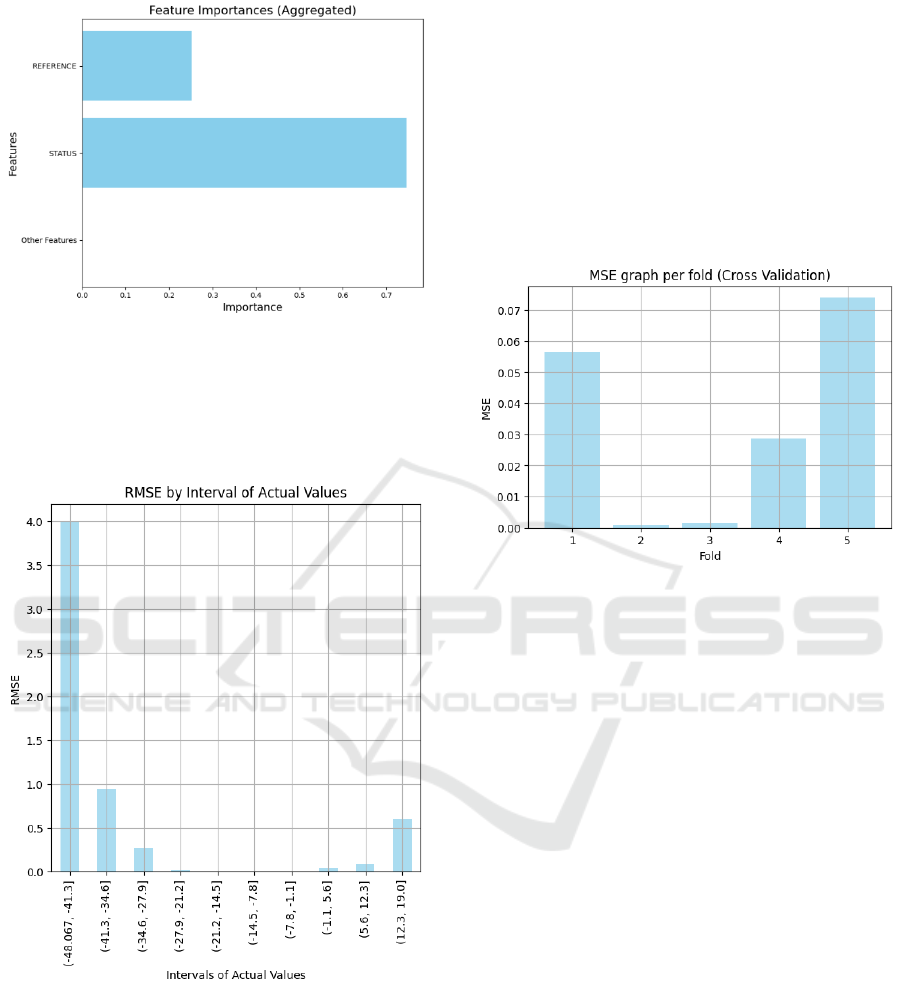
Figure 4: Feature Importance Chart.
RMSE Chart by Real Value Intervals: This chart
shows RMSE across different intervals of the target
variable. The model maintains low error across all
value ranges.
Figure 5: RMSE Chart by Real Value Intervals.
4.2 Cross Validation
To evaluate the model's generalization ability and
avoid overfitting on the training data, we performed
5-fold cross-validation. In each iteration, one subset
is used as the test set while the other four serve as
training sets. This process is repeated five times, so
each subset serves as the test set once. Finally, results
from the five iterations are averaged, providing a
more robust and representative assessment of the
model's performance.
The cross-validation results showed some
variability in MSE across folds. Below are the key
results:
• Average MSE: 0.0323
• Standard Deviation of MSE: 0.0292
The following bar chart visualizes the MSE
obtained in each of the five folds during cross-
validation:
Figure 6: MSE graph per fold (Cross Validation).
In this graph, each bar represents the MSE of a
specific fold, allowing us to observe how error varies
across different data subsets.
The cross-validation results reinforce that the
Random Forest model performs well on most data
subsets, although certain specific folds (folds 1 and 5)
exhibited higher errors. These results suggest that the
model has a good generalization capability, but it
might benefit from further fine-tuning of
hyperparameters or additional analysis of data in
folds with higher errors. Overall, the model has
shown to be robust and precise in predicting the
variable VARIATION.
5 DISCUSSIONS
The results obtained with the T-RAPPI model, based
on RF, indicate a significant improvement in
predicting bus arrival times for Lima's Metropolitano
system. This outcome provides a modern and
efficient solution to the historical lack of advanced
technological tools for public transportation
management in the city.
T-RAPPI: A Machine Learning Model for the Corredor Metropolitano
379

5.1 Implications of the Results
The predictive model developed offers a clear
improvement in the ability to accurately forecast bus
arrival times at Metropolitano stations, with an R² of
0.9998, indicating that nearly all data variability is
explained by the model. These results significantly
enhance the operational management of the
Metropolitano system, allowing for more efficient
planning by operators. Users also benefit, as they gain
access to precise arrival time information, improving
their experience and reducing frustration from long
waiting times.
5.2 Comparison with Other Studies
Direct comparisons between T-RAPPI and previous
studies are limited due to differences in datasets and
contexts. For example, Glück et al. (2022) used KNN
to predict vehicle occupancy with 80% accuracy,
highlighting the challenges of high accuracy in
complex systems. T-RAPPI, however, demonstrated
better accuracy in predicting bus arrival times,
showing the suitability of the RF algorithm for
operational data with temporal dependencies.
Other studies, like those by Blättler and Imhof
(2023) and AlKhereibi et al. (2023), focus on
geospatial data, while T-RAPPI uses historical
operational records from Lima’s Metropolitano
system, tailoring it to the city's unique conditions.
Though direct comparisons are difficult, T-RAPPI
highlights the versatility of Random Forest across
different data types and contexts.
In conclusion, the differences in datasets and
objectives highlight the diversity of approaches in
public transportation research, with T-RAPPI
contributing by effectively utilizing historical
operational data for arrival time prediction within
Lima’s transit system.
5.3 Utility in an Operational
Environment
The T-RAPPI model has direct applicability in the
operational environment of the Metropolitano. By
integrating it into the ‘Metropolitano +’ mobile
application, the model can be used by both
Metropolitano guides and users. Guides can use
predictions to optimize bus allocation, manage
service frequencies, and respond more quickly to
passenger demand variations. Meanwhile, users
benefit from the ability to plan their trips with greater
certainty, reducing waiting times and the stress
associated with service uncertainty.
A broader application of this type of model could
be considered in terms of improving not only the
efficiency of transportation systems but also resource
optimization in other public service systems. For
example, in the context of emergency management or
urban planning, where response times and resource
distribution could benefit from robust predictive
models.
5.4 Future Perspective
One key challenge is its reliance on historical data,
which may reduce accuracy in unexpected situations,
such as sudden traffic disruptions, extreme weather,
or operational anomalies. To improve the model’s
adaptability, integrating real-time data on traffic and
weather conditions would be a valuable enhancement,
enabling more accurate predictions in dynamic
scenarios.
Future extensions could also explore applying the
model to other transit lines in Lima or adapting it to
different cities. However, this would require
addressing challenges such as differences in data
availability, transit systems, and urban layouts, which
may demand adjustments to the model’s features and
preprocessing methods.
Despite these challenges, T-RAPPI provides a
solid foundation for advancing urban transit
management. With further refinements and the
inclusion of new data sources, it has the potential to
become a more versatile tool for improving public
transportation systems across different regions.
6 CONCLUSIONS
This study introduces and evaluates T-RAPPI, a
Random Forest-based model designed to predict bus
arrival times in Lima's Metropolitano transportation
system. The model achieves high accuracy, with an
R² of 0.9998 and an extremely low average error,
showcasing its robustness and effectiveness. Its
impact lies in improving operational planning and
user experience by providing precise predictions that
aid decision-making for system operators and users,
optimizing resources and reducing waiting times.
Key advantages of the model include its ability to
handle large data volumes and its flexibility to adapt
to various operational scenarios, making it a valuable
tool for transportation systems with similar
characteristics. However, a noted limitation is its
reliance on historical and operational data, which may
reduce accuracy in the face of extraordinary events or
sudden changes in traffic conditions.
VEHITS 2025 - 11th International Conference on Vehicle Technology and Intelligent Transport Systems
380

The T-RAPPI model is integrated into the
'Metropolitano +' mobile application, ensuring
usability for both operators and end-users. This
integration enables operators to make more informed
decisions and improve service efficiency, while users
can better plan their trips.
Future work suggests incorporating real-time
variables, such as weather and traffic conditions, to
enhance the model's accuracy. Additionally,
expanding its application to other public
transportation systems in Lima and other cities could
provide a more comprehensive and robust solution for
urban transportation management.
ACKNOWLEDGEMENTS
The authors are grateful to the Dirección de
Investigación de la Universidad Peruana de Ciencias
Aplicadas for the support provided for this research
work through the economic incentive.
REFERENCES
Alkhereibi, A. H., Wakjira, T. G., Küçükvar, M., & Onat,
N. C. (2023). Predictive machine learning algorithms
for metro ridership based on urban land use policies in
support of Transit-Oriented Development.
Sustainability, 15(2), 1718. https://doi.org/10.3390/su1
5021718
Badii, C., Difino, A., Nesi, P., Paoli, I., & Paolucci, M.
(2021). Classification of users’ transportation
modalities from mobiles in real operating conditions.
Multimedia Tools And Applications, 81(1), 115-140.
https://doi.org/10.1007/s11042-021-10993-y
Calatayud, A., González, S. S., Maya, F. B., Zúñiga, F. G.,
& Márquez, J. M. M. (2021, marzo). Congestión urbana
en América Latina y el Caribe: Características, costos y
mitigación. https://doi.org/10.18235/0003149
Cerqueira, S., Arsénio, E., Barateiro, J., & Henriques, R.
(2024). Moving from classical towards machine
learning stances for bus passengers’ alighting
estimation: a comparison of state-of-the-art approaches
in the city of Lisbon. Transportation Engineering,
100239. https://doi.org/10.1016/j.treng.2024.100239
Gonzales, F. (2024, 14 febrero). ¿Cuánto se pierde en Lima
Metropolitana por el tráfico? Instituto Peruano de
Economía. https://www.ipe.org.pe/portal/cuanto-se-
pierde-en-lima-metropolitana-por-el-trafico /
Hu, S., Weng, J., Liang, Q., Zhou, W., & Wang, P. (2022).
Individual Travel Knowledge Graph-Based Public
Transport Commuter identification: A Mixed Data
Learning approach. Journal of Advanced
Transportation, 2022, 1–16. https://doi.org/10.1155/20
22/2012579
Imhof, S., & Blättler, K. (2023). Assessing spatial
characteristics to predict DRT demand in rural
Switzerland. Research In Transportation Economics,
99, 101301. https://doi.org/10.1016/j.retrec.2023.1013
01
Infraestructura Vial. (2024) Desafíos y Recomendaciones
para Mejorar el Metropolitano en Lima. https://infraes
tructuravial.pe/infraestructura-vial/desafios-y-recomen
daciones-para-mejorar-el-metropolitano-en-lima/
Müller–Hannemann, M., Rückert, R., Schiewe, A., &
Schöbel, A. (2022). Estimating the robustness of public
transport schedules using machine learning.
Transportation Research. Part C, Emerging
Technologies, 137, 103566. https://doi.org/10.1016/
j.trc.2022.103566
Porras, H. J. (2023). Evaluación de la problemática del
servicio de las líneas alimentadoras del Metropolitano
en el sistema de transporte urbano de Lima y Callao y
propuesta de mejora basada en sistemas inteligentes de
transporte [Tesis de Maestría, Universidad ESAN.
Escuela de Administración de Negocios para
Graduados]. Repositorio Institucional Universidad
ESAN. https://hdl.handle.net/20.500.12640/3636
Qadir, A., Outay, F., Gazder, U., & Khalid, M. B. (2023).
Optimizing operational parameters through
minimization of running costs for shared mobility
public transit service: an application of decision tree
models. Personal and Ubiquitous Computing, 27(5),
1655–1668. https://doi.org/10.1007/s00779-023-
01739-8
Rivas, J., Lujan, M. & Palma, R. (2022). El estrés y su
relación con el rendimiento laboral en conductores de
transporte público de la empresa Allin Group-Javier
Prado S.A, Lima-2022. Ciencia Latina Revista
Científica Multidisciplinar, 6(2). https://doi.org/10.37
811/cl_rcm.v6i2.2016
Ruiz, E. A., Yushimito, W. F., Aburto, L., & De la Cruz, R.
(2024). Predicting passenger satisfaction in public
transportation using machine learning models.
Transportation Research. Part A, Policy And Practice,
181, 103995. https://doi.org/10.1016/j.tra.2024.103995
Santos, G., & Николаев, Н. В. (2021). Mobility as a
Service and Public Transport: A Rapid Literature
Review and the Case of Moovit. Sustainability, 13(7),
3666. https://doi.org/10.3390/su13073666
Yin, Z., & Zhang, B. (2023). Bus Travel Time Prediction
Based on the Similarity in Drivers’ Driving Styles.
Future Internet, 15(7), 222. https://doi.org/10.33
90/fi15070222
Zimmo, I., Hörcher, D., Singh, R., & Graham, D. J. (2023).
Benchmarking Travel Time and Demand Prediction
Methods Using Large-scale Metro Smart Card Data.
Periodica Polytechnica. Transportation Engineering,
51(4), 357-374. https://doi.org/10.3311/pptr.22252
T-RAPPI: A Machine Learning Model for the Corredor Metropolitano
381
